Monthly Archives: November 2014

Ice Fog causes Flight Diversions at Denver International

Ice Fog at Denver International Airport on Sunday 30 November resulted in the diversion of almost 50 flights. (News Link) From the link:

Sunday morning fog caused about 46 flights scheduled to land at Denver International Airport to be diverted, airport officials said.

GOES_R_IFRProb_30Nov2014_anim

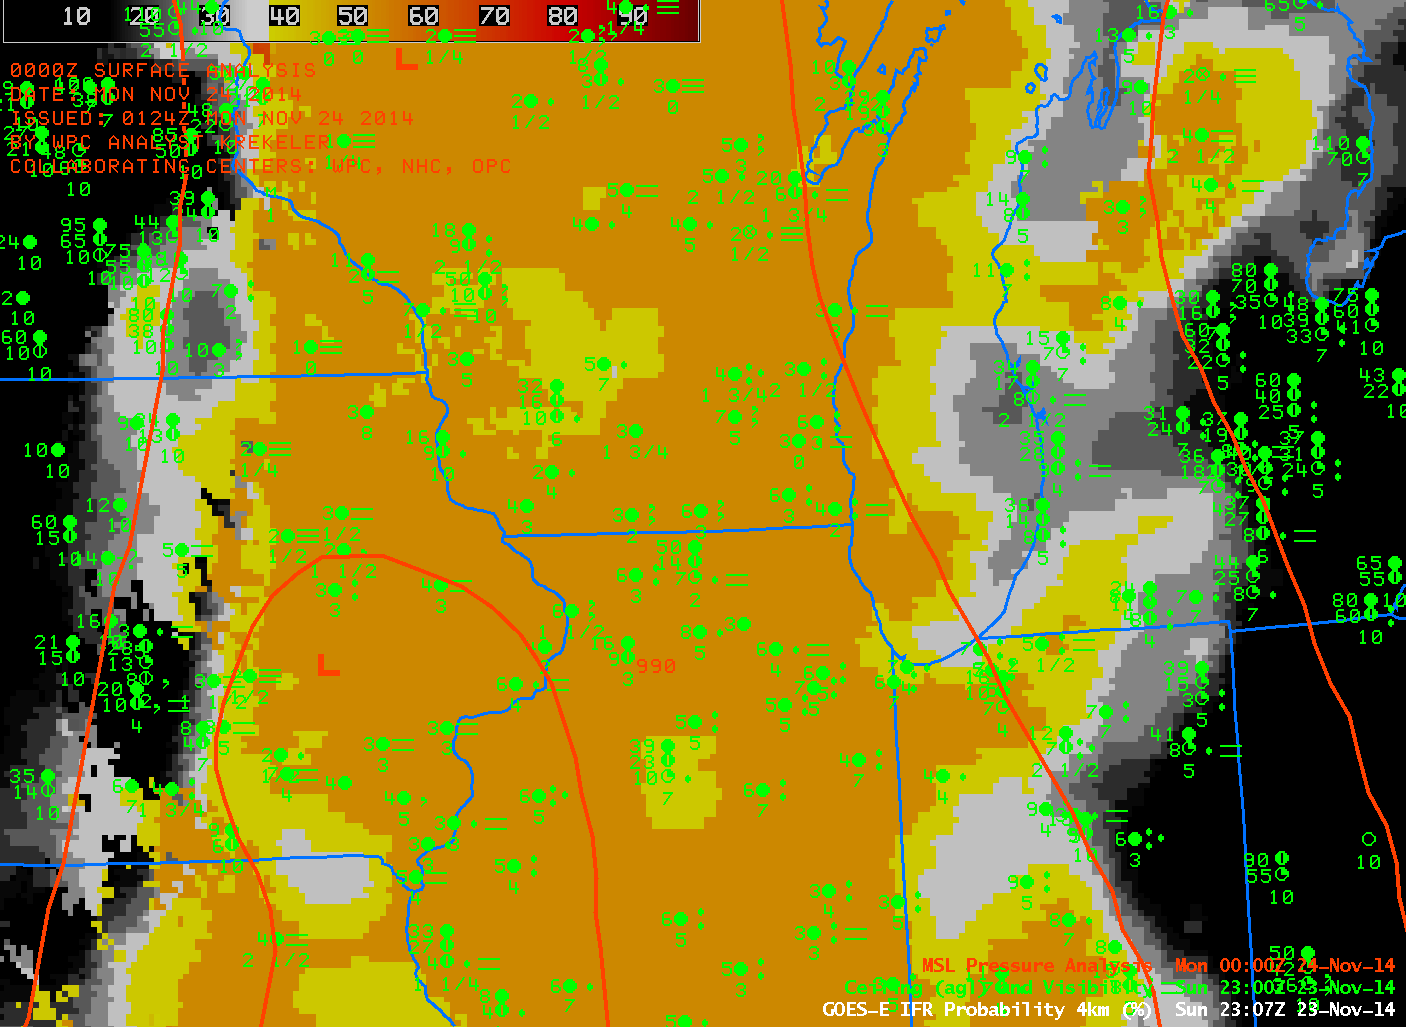
GOES-R IFR Probability Fields, every 15 minutes, from 0500 UTC through 2200 UTC on 30 November 2014, along with surface reports of ceilings and visibility (Click to enlarge)

The GOES-R IFR Probability field gave useful anticipatory information for this event. The animation above shows a line of high IFR Probability moving southward and westward. Stations within the highest IFR Probability reported freezing fog (e.g. Sidney Nebraska (KSNY) at 0800 UTC, Akron, CO (KAKO) at 1200, 1300 and 1400 UTC and Kit Carson Airport in Burlington CO (KITR) at 1400 UTC). When the region of higher IFR Probability abuts up against Denver International (KDEN), then, at 1600 UTC, the Freezing Fog that occurred should not surprise. This region of enhanced IFR Probability persisted near Denver International through 2200 UTC.

The METARS, listed below, show the onset of the freezing fog (FZFG). Note that times are boldface in black, and fog-related observations are boldfaced in red:

KDEN 301353Z 13005KT 10SM FEW110 BKN220 07/M13 A2981 RMK AO2
SLP068 T00721128 $=
KDEN 301453Z 17007KT 10SM FEW110 SCT220 06/M11 A2984 RMK AO2
SLP082 FG BANK DSNT NW-SE T00561111 51034 $=
KDEN 301539Z 07016KT 1/2SM R35L/P6000FT FZFG FEW001 FEW110
SCT220 M06/M08 A2988 RMK AO2 WSHFT 1505 FG FEW001
T10611078 $=
KDEN 301542Z 07017KT 1/4SM R35L/P6000FT FZFG FEW001 FEW110
SCT220 M06/M07 A2989 RMK AO2 WSHFT 1505 FG FEW001 VIS W
1/2 T10611072 $=
KDEN 301553Z 07019KT 1/4SM R35L/2200VP6000FT FZFG VV002
M06/M07 A2991 RMK AO2 WSHFT 1505 PRESRR SLP131 FROPA
I1000 T10611072 $=
KDEN 301630Z 07020KT 1/8SM R35L/1400V2200FT FZFG VV001
M06/M07 A2993=
KDEN 301637Z 08019KT 1/4SM R35L/1400V2400FT FZFG VV001
M06/M07 A2994 RMK AO2 PK WND 07026/1633 TWR VIS 1/4
I1004 T10611072 $=
KDEN 301651Z 08021G28KT 1/4SM R35L/1000V1600FT FZFG VV002
M07/M07 A2995 RMK AO2 PK WND 07028/1643 I1004 $=
KDEN 301653Z 08023KT 1/4SM R35L/1000V1400FT FZFG VV002
M07/M07 A2996 RMK AO2 PK WND 07028/1643 SLP145 I1004
T10671072 $=

(Click here to see a more English Language Listing; Click here to see a meteorogram)

GOES_BTD_30Nov2014_anim

GOES-13 Brightness Temperature Difference fields (10.7µm – 3.9µm) from 0800 through 1600 UTC on 30 November 2014 (Click to enlarge)

For comparison, the Brightness Temperature Difference Field is shown above. Terrain-induced cirrus clouds largely obscured the view of low clouds from satellite in this case. Thus, the incorporation of surface information via the Rapid Refresh model was key to producing an IFR Probability field with useful content.

Visible Imagery from GOES-13 (below) and GOES-15 (bottom) show the cirrus and the underlying low clouds. The steady southward advancement of the low clouds is consistent with the motion of the IFR Probability fields.

GOES13_DENVER_ICE_30Nov2014anim

GOES-13 Visible Imagery (0.63µm) animation, 1400-1800 UTC on 30 November 2014 (Click to enlarge)

GOES15_DENVER_ICE_30Nov2014anim

GOES-15 Visible Imagery (0.62µm) animation, 1400-1800 UTC on 30 November 2014 (Click to enlarge)

Advection Fog with a Cyclone over the Midwest

GOES_IFR_PROB_20141123_2307

GOES-based GOES-R IFR Probabilities and surface observations of Ceilings and Visibilities, ~2300 UTC, and the 0000 UTC HPC Analysis of surface pressure (Click to Enlarge)

In the image above, a trough of low pressure is depicted along the Mississippi River, with moist southerly flow over the Ohio Valley and Western Great Lakes (Dewpoints in Wisconsin at this time were mid- to upper-40s (Fahrenheit). This moist air is easily cooled to its dewpoint by the underlying cool ground, and dense fog is a result. However, this fog is difficult to detect from satellite because of the multiple cloud layers that accompany low pressure systems. GOES-R IFR Probabilities show a good signal because of Fog Predictors that are derived from numerical model output (the numerical model used is the Rapid Refresh). In this case, the Rapid Refresh was accurately depicting the evolution of the system because the model-based field of IFR Probabilities accurately overlaps the region of observed IFR (and near-IFR) conditions.

Fused Products yield better Output

GOES_IFR_US_11-3.9_Sat_20141121_1100toggle

GOES-R IFR Probabilities computed from GOES-East, and GOES-East Brightness Temperature Differences (10.7 µm – 3.9 µm), 1100 UTC on 21 Nov 2014 (Click to enlarge)

The traditional method of detecting fog/low stratus from satellite data, the brightness temperature difference between the longwave and shortwave infrared channels (10.7 µm – 3.9 µm on GOES) can overpredict regions of reduced ceilings and visibilities because satellites see only the top of the cloud. GOES-R IFR Probabilities, in contrast, incorporate surface-based information into a fog/low stratus predictive algorithm. As a result, regions with elevated stratus (such as eastern/northeastern Oklahoma in the toggle above) that should not affect transportation (for example) can be screened out of a field meant to diagnose regions of reduced visibilities.

Low Ceilings/visibilities over the Deep South in the wake of a cold frontal passage

GOES_IFR_PROB_20141117_02-12anim

GOES-R IFR Probabilities ~hourly from 0200-1215 UTC on 17 November along with surface plots of ceilings and visibilities (Click to enlarge)

A strong cold front moved through the deep south in the early morning of 17 November 2014, accompanied by low ceilings and reduced visibilities that were very close to IFR conditions. Multiple cloud layers, however, prevented brightness temperature difference fields from diagnosing the low clouds. In cases such as these, a data fusion product such as GOES-R IFR Probability that incorporates surface information via a model simulation (such as the Rapid Refresh) that assimilates surface data is still able to highlight regions where IFR Conditions are most likely. In the animation above, flat fields (those that are horizontally homogeneous, such as over central Mississippi at 0315 UTC) are regions where multiple cloud layers prevent the identification of low cloud features and GOES-R IFR Probability is therefore computed using model-based predictors only. Regions over Louisiana at the beginning of the animation are more pixelated in appearance. This is a region where high clouds have pushed off to the East, where satellites can observe the behavior of low stratus and where satellite data can therefore be used as a predictor in the GOES-R IFR Probability algorithm. Regions where satellite data cannot be used generally have lower probabilities because one of the predictors (satellite data) is absent. That is the case in the above animation. When satellite data can be used, IFR Probabilities increase. Use that knowledge of the behavior of IFR Probability fields to tailor your interpretation of the magnitude of the IFR Probability.

Fog over Southeast New England

Fog overspread much of southern New England overnight on 11-12 November 2014.

BostonTweet7AM_12Nov2014

Downtown Boston, Fogbound, Wednesday Morning 12 Nov 2014 (Photo Credit: Blue Hill Observatory)

From the National Weather Service in Taunton, MA, late in the day on 11 November 2014:

000
WWUS81 KBOX 120001
SPSBOX

SPECIAL WEATHER STATEMENT
NATIONAL WEATHER SERVICE TAUNTON MA
701 PM EST TUE NOV 11 2014

CTZ002>004-MAZ002>024-026-NHZ011-012-015-RIZ001>008-120415-
HARTFORD CT-TOLLAND CT-WINDHAM CT-WESTERN FRANKLIN MA-
EASTERN FRANKLIN MA-NORTHERN WORCESTER MA-CENTRAL MIDDLESEX MA-
WESTERN ESSEX MA-EASTERN ESSEX MA-WESTERN HAMPSHIRE MA-
WESTERN HAMPDEN MA-EASTERN HAMPSHIRE MA-EASTERN HAMPDEN MA-
SOUTHERN WORCESTER MA-WESTERN NORFOLK MA-SOUTHEAST MIDDLESEX MA-
SUFFOLK MA-EASTERN NORFOLK MA-NORTHERN BRISTOL MA-
WESTERN PLYMOUTH MA-EASTERN PLYMOUTH MA-SOUTHERN BRISTOL MA-
SOUTHERN PLYMOUTH MA-BARNSTABLE MA-DUKES MA-NANTUCKET MA-
NORTHERN MIDDLESEX MA-CHESHIRE NH-EASTERN HILLSBOROUGH NH-
WESTERN AND CENTRAL HILLSBOROUGH NH-NORTHWEST PROVIDENCE RI-
SOUTHEAST PROVIDENCE RI-WESTERN KENT RI-EASTERN KENT RI-
BRISTOL RI-WASHINGTON RI-NEWPORT RI-BLOCK ISLAND RI-
INCLUDING THE CITIES OF…HARTFORD…WINDSOR LOCKS…UNION…
VERNON…PUTNAM…WILLIMANTIC…CHARLEMONT…GREENFIELD…
ORANGE…BARRE…FITCHBURG…FRAMINGHAM…LOWELL…LAWRENCE…
GLOUCESTER…CHESTERFIELD…BLANDFORD…AMHERST…NORTHAMPTON…
SPRINGFIELD…MILFORD…WORCESTER…FOXBORO…NORWOOD…
CAMBRIDGE…BOSTON…QUINCY…TAUNTON…BROCKTON…PLYMOUTH…
FALL RIVER…NEW BEDFORD…MATTAPOISETT…CHATHAM…FALMOUTH…
PROVINCETOWN…VINEYARD HAVEN…NANTUCKET…AYER…JAFFREY…
KEENE…MANCHESTER…NASHUA…PETERBOROUGH…WEARE…FOSTER…
SMITHFIELD…PROVIDENCE…WEST GREENWICH…WARWICK…BRISTOL…
NARRAGANSETT…WESTERLY…NEWPORT…BLOCK ISLAND
701 PM EST TUE NOV 11 2014

…PATCHY DENSE FOG POSSIBLE OVERNIGHT INTO WEDNESDAY MORNING…

A WARM AND MOIST AIRMASS BY NOVEMBER STANDARDS WAS OVER
CONNECTICUT… RHODE ISLAND…MASSACHUSETTS AND INTO NEW HAMPSHIRE
THIS EVENING. THIS COMBINED WITH LIGHT WINDS WILL RESULT IN PATCHY
DENSE FOG OVERNIGHT INTO WEDNESDAY MORNING. THERE IS SOME
UNCERTAINTY ON HOW WIDESPREAD THE FOG WILL BE. THUS A DENSE FOG
ADVISORY HAS NOT BEEN POSTED. HOWEVER AT LEAST SOME PATCHY DENSE
FOG IS LIKELY OVERNIGHT. THEREFORE MORNING COMMUTERS SHOULD PLAN
SOME EXTRA TIME TO REACH THEIR DESTINATION. IF FORECAST CONFIDENCE
ON WIDESPREAD DENSE FOG INCREASES LATER THIS EVENING A DENSE FOG
ADVISORY WILL BE ISSUED.

$$

NOCERA

Subsequently, the NWS in Taunton tweeted two times about the fog.

How well did the GOES-R IFR Probability Fields diagnose this fog event? Note the presence of high and mid-level clouds in the picture at top, from the morning of 12 November. Their signature should be in the IFR Probability fields as well, and that is the case.

GOES_IFR_PROB_20141112_0100-1215

GOES-R IFR Probabilities (Upper Left), GOES-East Brightness Temperature Difference (10.7 µm – 3.9 µm) (Upper Right), GOES-R Cloud Thickness (Lower Left) and GOES-R Low IFR Probability (Lower Right) (Click to animate)

In the animation above, the effect of high clouds is obvious on the IFR (and Low IFR) Probability fields: when mid-level or high clouds prevent satellite data from being used as a predictor in IFR Probability fields, then model data are the main predictors. Model data have coarse resolution relative to satellite data so the IFR Probability fields in those regions have a smoother look that is not at all pixelated. Note how a signal in of low clouds in the Brightness Temperature Difference Field (orange or yellow enhancement) nearly overlaps the more pixelated parts of the IFR and Low IFR Probability fields. Where cirrus/mid-level clouds are indicated in the brightness temperature difference fields, IFR and Low IFR Probability fields are smoother; these are also regions where the GOES-R Cloud Thickness (which field is of the thickness of the highest water-based cloud viewed by the satellite) is not computed because ice-based clouds are screening any satellite view of water-based clouds.

Note how southeastern Massachussetts in the animation above — under multiple cloud layers — has relatively small IFR and low IFR (LIFR) Probability values in a region where dense fog is reported. This arises because the model being used — the Rapid Refresh — to generate IFR Probability predictors is not saturating in the lower levels. It is important to remember that when satellite data are missing, only model data are used to generate GOES-R Fog/Low Stratus products. To rely on only the IFR Probability fields as an indication of the presence of fog is to believe the model simulation in that region is correct. Sometimes the model simulation is correct (this case, for example); in the present case, however, there were regions in southeastern Massachusetts where the model forecast did not accurately represent the observed conditions.

Suomi NPP overflew New England around 0700 UTC on 12 November, and the data collected are included in the image toggle below. Suomi NPP better resolves some of the smaller valleys in interior New England, and some of the sharp edges to the fields.

VIIRS_BTD_DNB__REF_20141112_0706

As above, but with a toggle between Suomi NPP VIIRS Day Night Band and Brightness Temperature Difference (11.45 µm – 3.74 µm) in the lower right. All data at ~0700 UTC 12 Nov (Click to enlarge)

Fog near Hanford California

B1m1XkPIgAA-c8Y

Tweeted Message from the National Weather Service in HNX (Hanford, CA) showing GOES-R IFR Probabilities in the central Valley of California (click to enlarge)

The National Weather Service in Hanford tweeted the image, above, of IFR Probability this morning. How did the evolution of IFR Probabilities compare to that of brightness temperature difference fields?

The hourly animation, below, suggests that data from the Rapid Refresh model was likely crucial in determining exactly where the lowest visibility occurred; the brightness temperature difference field did not capture the horizontal extent of the narrow band of fog that developed to the east of Interstate 5 (The interstate is the purple line in the animation). Indeed, the brightness temperature difference field appears to offer little in the way of forecast value, and differences trend to zero as the sun starts to rise at the end of the animation. In contrast, both IFR and LIFR Probabilities have peak values where ceilings are obscured and visibilities are near zero, in and around Hanford, and those large values persist through sunrise.

Hanford_4Nov2014_IFR_LIFR_06-15

Hourly GOES-R IFR Probabilities (Upper Left, computed with data from GOES-15) with ceilings and visibilities plotted, Hourly GOES-R LIFR Probabilities computed with data from GOES-15 (Lower Left), GOES-15 Brightness Temperature Difference (10.7µm – 3.9µm) (Upper Right), Suomi NPP Day Night Band and Brightness Temperature Difference (11.45µm – 3.74µm) (Lower Right), times as indicated (Click to enlarge)

Suomi NPP overflew the central Valley at 0938 UTC. The Day Night Band and the brightness temperature difference (11.45µm – 3.74µm) field, below, do not contain signatures of dense fog near Hanford.

Hanford_toggle_IFR_DNB_0938_04Nov2014

As above, but at 0945 UTC, when Suomi NPP data were present (Click to enlarge)

The two-hour time-lapse video, below, shows the evolution of the Fog at the National Weather Service Office in Hanford on the morning of 4 November.