Daily Archives: November 30, 2012

Stratus vs Fog

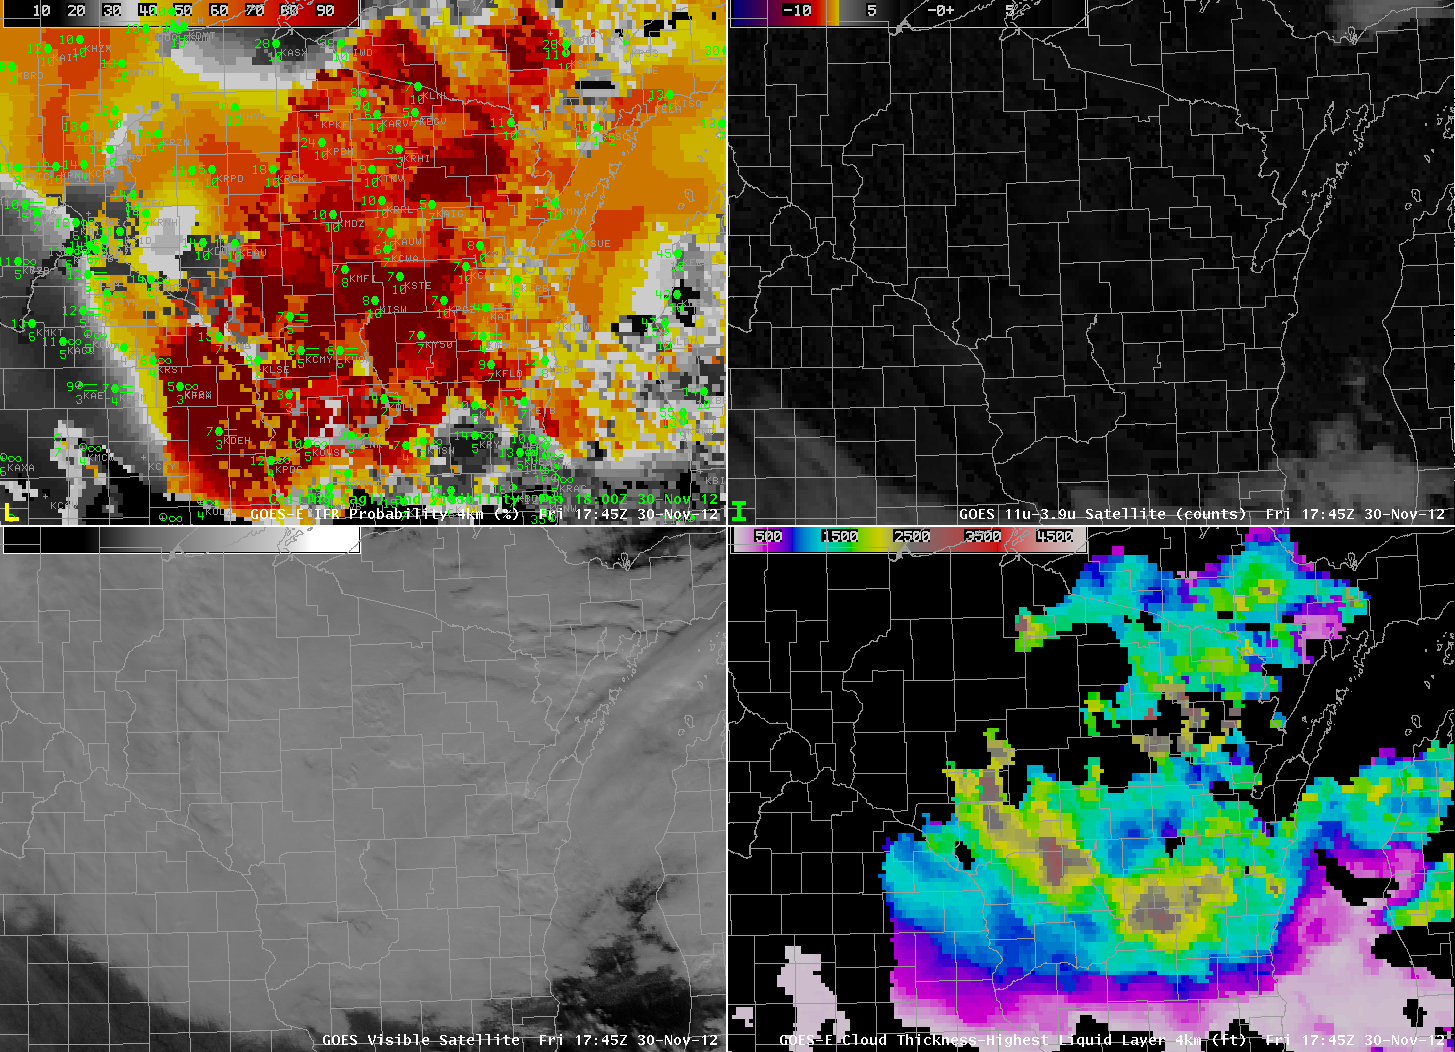
GOES-R IFR Probabilties over Wisconsin, computed from GOES-East (Upper left), GOES-East brightness temperature difference (10.7 µm – 3.9 µm) (Upper right), GOES-East Visible imagery (0.62 µm) (Lower left), GOES-R Cloud thickness (Lower right)

Stratus and fog look very similar from the satellite’s perspective, both during the day and at night.  That is why it is important to include surface information in a product that detects fog and low stratus.  The IFR Probability product over stratus-bound Wisconsin at mid-day on November 30 2012 shows a diagonal stripe of higher probabilities from southwestern Wisconsin to north-central Wisconsin.  Airports that are reporting IFR or near-IFR conditions are located within this stripe.  Over the rest of the state, where IFR probabilities are lower, the large majority of airports are reporting visibilities and ceilings exceeding IFR limitations.  The character of the visibile satellite data, and of the brightness temperature difference product, gives very little indication that surface visibilities are reduced primarily from northeast Iowa/southwest Wisconsin to north-central Wisconsin.

IFR Probabilities during a Big Storm

GOES-R IFR Probabilities computed using GOES-West data (upper left), GOES-West traditional brightness temperature difference (10.7 µm – 3.9 µm ) (upper right), surface observations of visibility and ceiling (AGL) (lower left), Blended Total Precipitable Water Product (lower right)

Large extratropical storms are often accompanied by regions of IFR conditions, but the multiple layers of clouds that are produced by the storms make fog/low stratus detection by traditional means — the brightness temperature difference between 10.7µm and 3.9µm microns (at night) — a difficult prospect.  The GOES-R Fog/Low Stratus (FLS) product that fuses satellite data with model (Rapid Refresh) data allows for estimates of IFR probabilities.  The imagery above also includes precipitable water estimates from Sounder, GPS and microwave imagery (bottom right), highlighting the tropospheric river of moisture that is impinging on the West Coast.

Highest IFR probabilities are occurring in several regions in the animation above.  They occur over the Los Angeles basin, for example, where IFR conditions are reported at several airports (San Nicolas and Los Angeles airports, for example).  Reduced visibilities are also occurring in the Sierras — Blue Canyon (at 1500 m above sea level) reports IFR conditions — and IFR probabilities are higher along the spine of the mountains.  IFR probabilities are also higher along the northern California coast, and stations like Ukiah are reporting occasional IFR conditions.  Stations in the central Valley, and along the central coast, are in a region of lower IFR probabilities, and IFR conditions are comparatively rarer there.