Category Archives: GOES-17

IFR Probability for situational awareness over the Pacific Northwest

GOES-17 IFR Probability fields, 1011-1321 UTC on 10 December 2021; Surface observations of ceilings (above ground level) and visibility are also included (Click to enlarge)

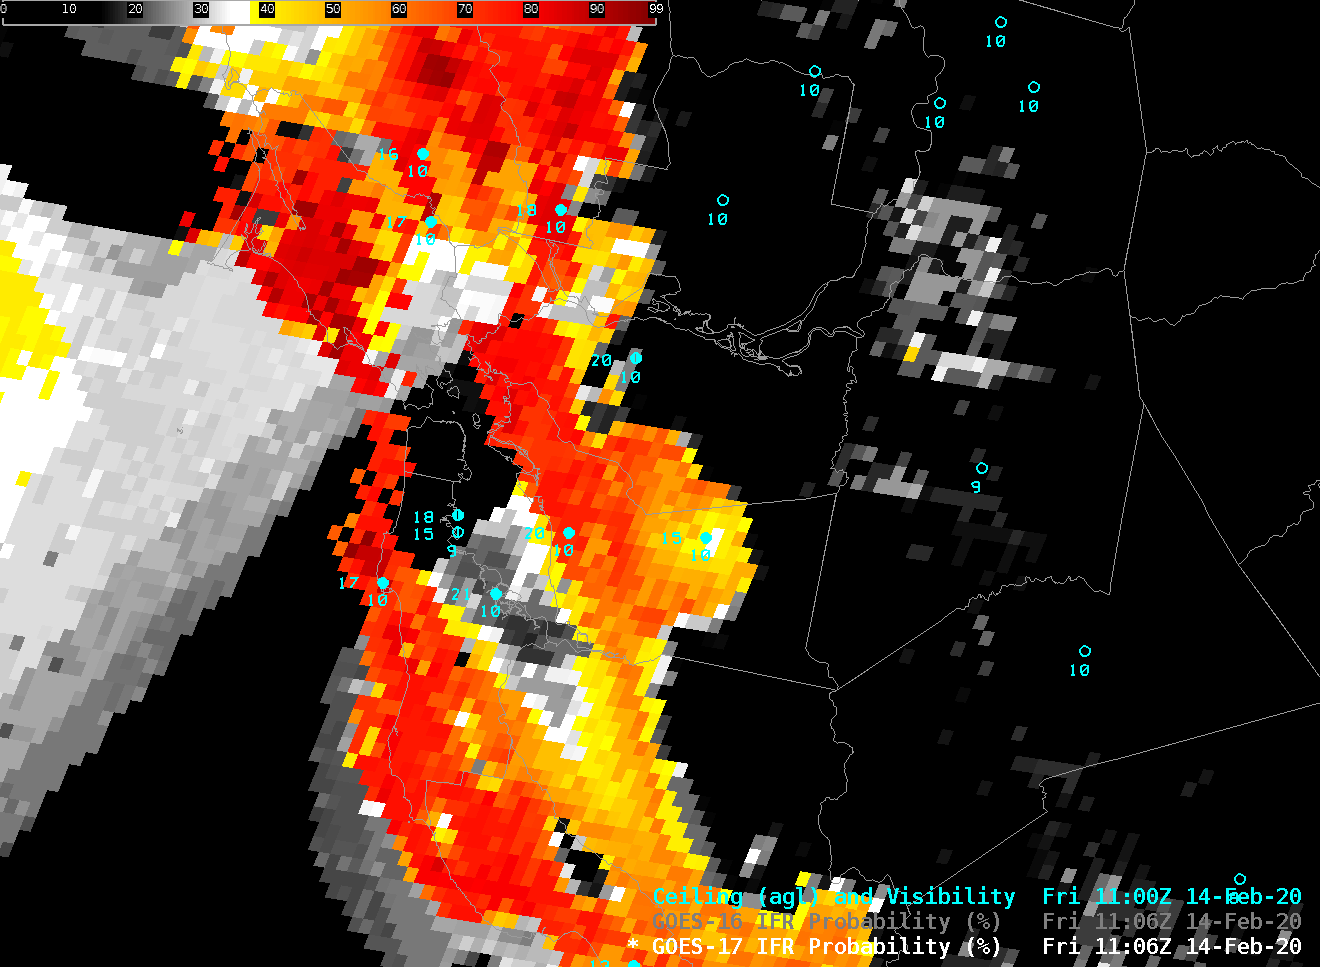
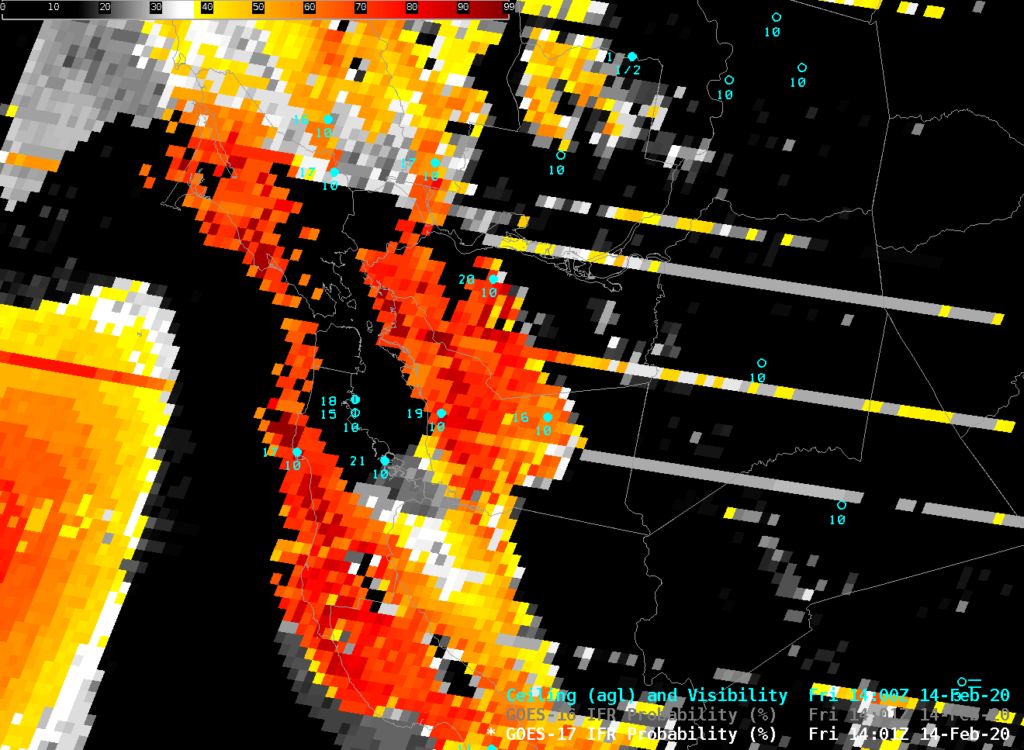
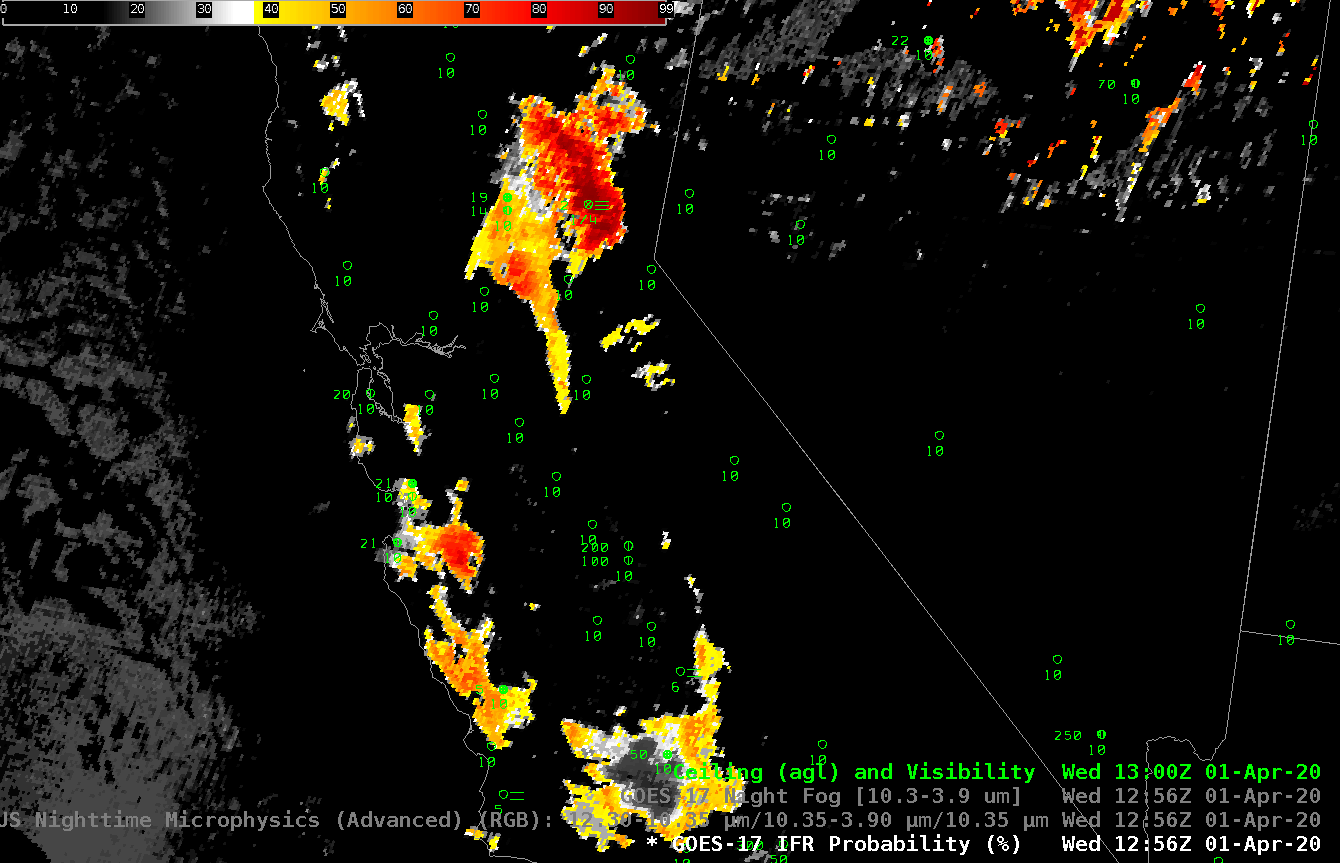
The animation above shows GOES-17 IFR Probabilities over the Pacific Northwest. This is a good situational awareness tool for fog/low stratus because it highlights regions where IFR conditions are most likely. That is, it is a quantitative product. The product also has knowledge of terrain height; if low clouds exist in regions where terrain might be rising into the clouds (for example to the northeast of Seattle WA, and to the east of Portland OR, and in Olympic National Park), IFR probabilities are heightened (pun not really intended).

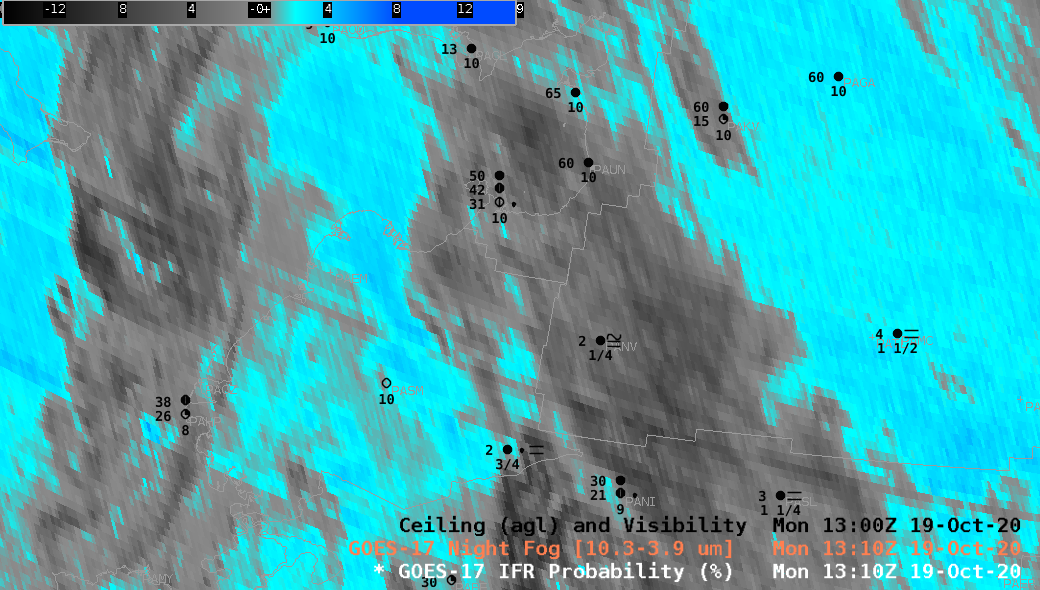
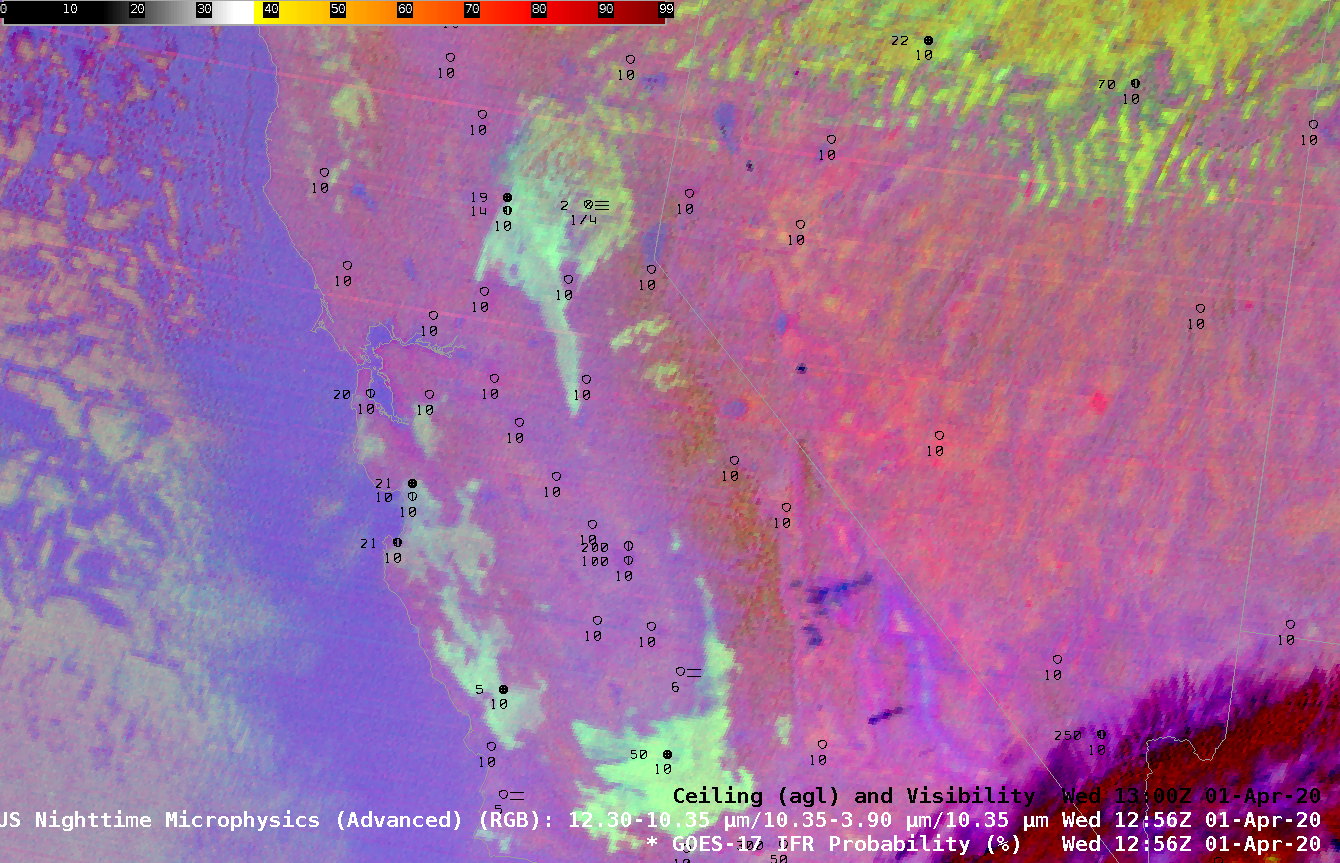
The Nighttime microphysics RGB, shown below, can also be used for qualitative situational awareness. In this case, the region of low clouds over western Washington, around Spokane (where observations show IFR conditions) and to the north, is highlighted as expected (the yellow color that is structured so that individual valleys are obvious). IFR Probabilities north of Spokane are not large, however, suggesting that model simulations there (from the Rapid Refresh model) do not show low-level saturation. (Observations at KOMK — Omak Washington — show near-IFR conditions). Another strength of IFR Probability is that it supplements satellite data where the satellite cannot view low clouds. High clouds to the east of Seattle and Portland are obscuring the view of low clouds in that region where IFR Probabilities are large and where ceilings and visibilities are likely reduced.

GOES-17 Nighttime Microphysics RGB (PACUS sector), 1011 – 1321 UTC on 10 December 2021 (Click to enlarge)

IFR Probability now archived in NOAA CLASS

Starting 21 October 2021, GOES-R IFR Probability fields are archived (for both GOES-16 and GOES-17, Full Disk and CONUS/PACUS domains) at NOAA CLASS. These fields are available under the drop-down menu: Choose ‘GOES-R Series L2+ Enterprise Products (GRABINDE)’, as shown below.

Product Search drop-down menu from the landing page of NOAA CLASS

Clicking on ‘>>Go‘ after selecting the product takes a user to the page below, from which page ABI Fog/Low Stratus products can be obtained.

Product Selection page at NOAA CLASS for GOES-17/GOES-16 Fog/Low Stratus products (including Cloud Thickness and IFR Probability fields)

The files retrieved from CLASS will be netCDF files with a filename structure such as this:

ABI-L2-GFLSC-M6_v3r0_g16_s202110220811172_e202110220813545_c202110220814421.nc

The file name above is for GOES-16 data from 0811 UTC on 22 October 2021. Such data can be displayed in (for example) Panoply, as shown below. Additionally, one could configure an AWIPS session to accept the fields.

IFR Probability fields, 0811 UTC on 22 October 2021 (GOES-16 CONUS) (Click to enlarge)

The netCDF files include many different 2-dimensional fields: IFR Probability, MVFR Probability, Low IFR Probability, Cloud Thickness, Maximum Relative Humidity between the surface and 500 feet AGL, Maximum Relative Humidity between the surface and 3000 feet AGL, Band 7 (3.9) Emissivitiy, and many more. A Full Disk image below (courtesy Tim Schmit, NOAA STAR), shows IFR Probability values on 27 October 2021 at 0000 UTC.

Global distribution of GOES-16 IFR Probability, 0000 UTC on 27 October 2021 (Click to enlarge)

Alaskan IFR Probability with GOES-17

GOES-17 Night Time Brightness Temperature (10.3 µm – 3.9 µm), Night TIme Microphysics RGB and GOES-17 IFR Probability, 1100 UTC on 24 September 2021 (Click to enlarge)

The animation above steps through the Night Fog brightness temperature difference (10.3 µm – 3.9 µm), the Nighttime Microphysics RGB (which RGB has as its green component the Night Fog brightness temperature difference) and the GOES-17 IFR Probability fields at 1100 UTC on 24 September 2021. (Note that the Night Fog Brightness Temperature difference and Night Microphysics RGB are at reduced resolution)

A low pressure system is moving onshore through southeastern Alaska. The animation includes two regions that demonstrate particular strengths of the IFR Probability field: over inland and coastal southeastern Alaska, east of Anchorage and west of Yakutat, where low clouds are diagnosed under the multiple cloud layers; over western Alaska where low clouds are diagnosed by the brightness temperature difference field — and color-enhanced as cyan/blue — but where fog observations are not occurring. Over western Alaska, model data allows the IFR Probability to screen out the region of elevated stratus.

Animations of the brightness temperature difference field, the night time microphysics RGB and the IFR Probability are shown below.

GOES-17 Night Time Brightness Temperature (10.3 µm – 3.9 µm), 0820-1310 UTC on 24 September 2021 (Click to enlarge)
GOES-17 Night Microphysics RGB, 0820-1310 UTC on 24 September 2021 (Click to enlarge)
GOES-17 IFR Probability Fields, 0820-1310 UTC on 24 September 2021 (Click to enlarge)

On this day, GOES_17 IFR Probability fields were better able to highlight regions of low ceilings and visibilities over Alaska by combining the strength of satellite detection of clouds and the ability of Rapid Refresh model simulations to predict where low-level saturation is most likely. Note that in the animation of the IFR Probability fields there are slight changes on the hour that are related to incorporation of new model output into the computation of the fields.

GOES-17 IFR Probability fields are slated to be operational as of 13 October 2021.

IFR Probability fields over the Bering Sea

GOES-17 IFR Probability from 1220 – 1710 UTC on 6 April 2021 (Click to enlarge)

GOES-17 IFR Probability fields, above, show a large region of high probabilities to the south and west of Alaska over the Bering Sea. This region of low clouds is encroaching onto shore and demonstrates how the field could be used to predict the onset of lower ceilings. The Night Fog brightness temperature difference animation, below, spanning the same times, documents how high clouds can make mask the satellite detection of low clouds. The animation also shows how the signal changes when the Sun rises (mot noticeable after about 1600 UTC). The Night Fog Brightness Temperature difference field is a component of the Nighttime Microphysics RGB; if the Night Fog Brightness Temperature difference cannot detect low fog because of high clouds, then the Nighttime Microphysics RGB similarly will not detect low clouds.

GOES-17 Night Fog Brightness Temperature Difference (10.3 µm – 3.9 µm) fields, 1220 UTC – 1710 UTC on 6 April 2021 (click to enlarge).

The toggles below of Night Fog Brightness Temperature difference and GOES-17 IFR Probability at 1400 UTC (below) and 1620 UTC (bottom) underscore how the IFR Probability field can give useful information in regions underneath high clouds. If you were scheduled to be on a boat in the Bering Sea on this day, for example, would you expect any visibility?

Toggle between GOES-17 IFR Probability and GOES-17 Night Fog Brightness Temperature Difference (10.3 µm – 3.9 µm) fields, 1400 UTC on 6 April 2021 (click to enlarge). Surface observations of ceilings and visibilities at 1600 UTC are also plotted.
Toggle between GOES-17 IFR Probability and GOES-17 Night Fog Brightness Temperature Difference (10.3 µm – 3.9 µm) fields, 1620 UTC on 6 April 2021 (click to enlarge). Surface observations of ceilings and visibilities at 1600 UTC are also plotted.

The imagery below, from webcams at Togiak (at 1700 UTC) (source), show the low clouds along the coast.

Webcam image from Togiak AK, 1715 UTC 6 April 2021, looking north
Webcam image from Togiak AK, 1715 UTC 6 April 2021, looking west

IFR Probability over southeast Alaska

GOES-17 Clean Window (10.3 µm) infrared imagery, 1000 – 1510 UTC on 19 February 2021 (Click to enlarge)

Clean Window infrared imagery from GOES-17, above, shows a cyclonic storm making landfall over the southeast Alaska peninsula. Multiple cloud levels can be inferred from this animation, and satellite detection of low clouds (and stratus), as reported in sparse METAR observations, is a challenge. Note also the occasional striping that suggests the Loop Heat Pipe on GOES-17 is not cooling the satellite (The Cooling Timeline — every 15 minutes for a Full Disk, is being used at the start of the animation).

In particular, the GOES-based ‘Night Fog ‘ Brightness Temperature Difference field, below, commonly used alone, and as part of the night time microphysics RGB, does not show a consistent signal (cyan in the enhancement) associated with low clouds/stratus/fog — because higher clouds (grey in the applied enhancement) are interfering with the view.

Night Fog Brightness Temperature Difference (10.3 µm – 3.9 µm), 1000 UTC – 1510 UTC on 19 February 2021 (click to enlarge)

GOES-17 IFR Probability combines satellite information with Rapid Refresh model (resolution: 11 km) predictions of low-level saturation. More recent model data are incorporated every hour; you might notice that fields adjust slightly at the top of the hour as that happens.

IFR Probability fields show that the likelihood of IFR conditions are extending southward along the coastal range with time, and increasing in the Inside Passage as well. Note also how IFR Probability is generally larger near mountain tops: it is created with knowledge of topography

GOES-17 IFR Probability fields, 1000 – 1510 UTC on 19 February 2021 (Click to enlarge)

GOES-17 IFR Probability around Bristol and Kvichak Bays

GOES-17 IFR Probability, 0820 – 1800 UTC on 17 November 2020 (Click to enlarge)

GOES-17 IFR Probability fields, above, show a thin region along the northern shore of Bristol and Kvichak Bays in southwestern Alaska, north of the Aleutian Peninsula, where IFR conditions are likely . Probabilities are highest around King Salmon (PAKN) and Igiugig (PAIG) northeast of King Salmon. Several nearby airports are not reporting observations (PAII — Egegik — just south of King Salmon; PATG –Togiak — along the northern shore of the Bay, east of PAEH (Cape Newenham). IFR probability uses satellite and model information to create an estimate of whether or not IFR conditions will be met in regions where observations are missing. Sometimes, as over Cape Newenham at the end of the animation, high clouds are present and only model data can be used to create the estimate.

The Night Fog Brightness Temperature Difference field, below, shows that low clouds (made up of water droplets) exist over the same region — but this one product cannot indicate whether the stratus deck observed is reducing visibility near the surface (where aviation interests require that information). The model data that are incorporated into IFR Probability in concert with satellite data allow for a better estimate of where visibility is reduced than do satellite data alone. This is especially important when the presence of high clouds, as at the end of the animation in the western part of this domain, makes it difficult for the satellite to view low clouds.

GOES-17 ‘Night Fog’ Brightness Temperature Difference field (10.3 µm – 3.9 µm), 0820-1800 UTC on 17 November 2020 (Click to enlarge)
IFR Probability, Low IFR Probability, and Night Fog Brightness Temperature difference at 1000 UTC on 17 November 2020 (Click to enlarge)

Toggles at 1000 UTC (above) and 1600 UTC (below) of IFR Probability, Low IFR Probability and Night Fog Brightness Temperature Difference, suggest that the greatest likehihood of reduced visibilities are not along the bay shore, but rather inland along the Kvichak River.

IFR Probability, Low IFR Probability, and Night Fog Brightness Temperature difference at 1600 UTC on 17 November 2020 (Click to enlarge)

GOES-17 IFR Probability over western Alaska

GOES-17 IFR Probability fields and GOES-17 Night Fog Brightness Temperature Difference (10.3 µm – 3.9 µm), 1310 UTC on 19 October 2020 (Click to enlarge)

CIMSS is now creating GOES_17 IFR Probability fields for Alaska and will presently be distributing them to the Alaska Region. An example of the utility of the products occurred on 19 October over western Alaska. The toggle above between the Night Fog brightness temperature difference field and the IFR Probability field at 1310 UTC 19 October shows several regions where IFR Probability refines where ceilings and visibilities might restrict aviation — an important piece of information in Alaska.

The default Night Fog Brightness Temperature enhancement is constructed so that stratiform clouds containing water droplets are colored different shades of blue. Higher clouds are various shades of grey.

Consider station PANV — Anvik, AK, near 62.7 N, 160 W. This is a station reporting IFR conditions, and IFR probabilities are near 80%. However, it is also under high clouds; GOES-17 is prevented from viewing low clouds, but the Rapid Refresh model data used in IFR Probability is showing saturation. Model data fills in regions of IFR conditions where high (of mid-level) clouds prevent the satellite from viewing near-surface clouds. Note how IFR Probability is also able to distinguish — correctly — between the IFR conditions at Anvik with the more benign sky conditions to the north at St. Michaels (PAMK), Unalakleet (PAUN) and Shaktoolik (PFSH) along Norton Sound.

In contrast, station PASM — St. Mary’s AK, near 62 N, 163 W — is beneath a strong signal in the Night Fog brightness temperature difference field. However, IFR conditions are not reported, and IFR probabilities are near 40% (and decreasing abruptly to the south). In this region, IFR Probability fields are screening out a region of mid-level stratus.

Station PAMC — McGrath, AK, near 63 N, 155 W — shows near-IFR conditions with a local minimum IFR Probability near 40% and a strong signal of stratus clouds in the Night Fog Brightness Temperature difference. For this station it would be prudent to see how IFR Probabilities were changing with time.

IFR Probability combines the strengths of satellite detection of low clouds with the strength of Rapid Refresh model predictions of low-level saturation to create a product useful in regimes with single or multiple cloud layers.

Detecting low ceilings over California

GOES-17 Night Fog Brightness Temperature Difference (10.3 µm – 3.9 µm) and Night Time Microphysics RGB, 1256 UTC on 01 April 2020 (Click to enlarge)

Detecting stratus at night, and thereby inferring the presence of fog, usually involves the Night Fog Brightness Temperature Difference (10.3 µm – 3.9 µm) field that identifies clouds made up of water droplets owing to the droplets’ different emissivity properties at 10.3 µm (droplets emit energy at that wavelength mostly as a blackbody) and at 3.9 µm (droplets do no emit energy at that wavelength as a blackbody). This difference field is a crucial component in the Night Time Microphysics Red-Green-Blue (RGB) Product as evinced in the toggle above. The regions shown to have low clouds (blue and cyan in the Brightness Temperature Difference field, pale yellow in the RGB) are not necessarily those regions with IFR conditions, i.e., where fog and low ceilings are present. The satellite can sense the top of the cloud, but it is a challenge to infer from the satellite data alone where the cloud base sits.

GOES-R IFR Probability fields combine satellite information with model estimates of low-level saturation. An accurate model simulation can allow the product to highlight regions of low ceilings (where fog is more likely) and screen out mid-level stratus. Consider the toggle below, and note how is emphasizes regions where observations show low ceilings and/or reduced visibilities (Blue Canyon airport northwest of Lake Tahoe and Paso Robles airport). Note also how the signal at Bakersfield, at the southern end of California’s Central Valley, is de-emphasized.

GOES-R IFR Probability fields provide a consistent signal for low ceilings and reduced visibility. The fields marry the strengths of satellite detection and model data.

GOES-17 Night Fog Brightness Temperature Difference (10.3 µm – 3.9 µm), GOES-17 IFR Probabilities, and GOES-17 Night Time Microphysics RGB, 1256 UTC on 01 April 2020 (Click to enlarge)

GOES-17 IFR Probability over San Francisco

GOES-17 IFR Probability over San Francisco, 1106 UTC, 14 February 2020, along with surface observations of ceilings and visibility (Click to enlarge)

The Cooperative Institute for Meteorological Satellite Studies (CIMSS) is (as noted in this blog post) testing GOES-17 IFR Probability fields in the AWIPS environment in preparation for their deployment to interested offices (via an LDM feed). The GOES-17 field, above, at 1106 UTC, suggests stratus offshore of San Francisco but higher ceilings over the city and the bay. Webcam views of the city (source), and of Alcatraz Island (source), below, from around 630 AM PST, also suggest relatively high ceilings over the city and the bay.

Webcam view of Alcatraz Island in San Francisco Bay, ca. 6:30 AM PST 14 February 2020

GOES-16 is also providing IFR Probability over the west coast of the United States. The toggle below between GOES-17 and GOES-16 shows how the oblique view from GOES-16 and the effects of parallax can perhaps place the probability in the wrong place. Parallax errors shift the clouds towards the sub-satellite point. Parallax effects can be explored at this website.

GOES-17 and GOES-16 IFR Probability fields, 1106 UTC on 14 February 2020 (Click to enlarge)

The GOES-17 Advanced Baseline Imager (ABI) is currently showing the effects of inadequate imager cooling by the faulty Loop Heat Pipe on board the spacecraft. At times between 1100 and 1500 UTC, as shown below for 1401 UTC, stripes will appear in the IFR Probability field. Manifestations of the Loop Heat Pipe issue will continue with increasing impact into early March, at which time Eclipse Season will mitigate the issue until April.

GOES-17 IFR Probability over San Francisco, 1401 UTC, 14 February 2020, along with surface observations of ceilings and visibility (Click to enlarge)

GOES-17 IFR Probability fields are available over the CONUS domain at this website.