The animation above shows various methods typically used to detect fog/low stratus in the early morning. Night Fog Brightness Temperature differences, bottom left, and Night Time microphysics, bottom right, are both satellite-only detection systems; a shortcoming might be that satellite data is challenged in detecting cloud bases — satellites view the cloud top. Additionally, the signal is lost as the sun rises. IFR Probability (upper right) includes information (from the Rapid Refresh model) on low-level saturation, so perhaps that field better defines the scattered pockets of fog apparent on this morning. However, the Rapid Refresh model resolution is 13-km, and a valley fog might not be well-resolved in the model.
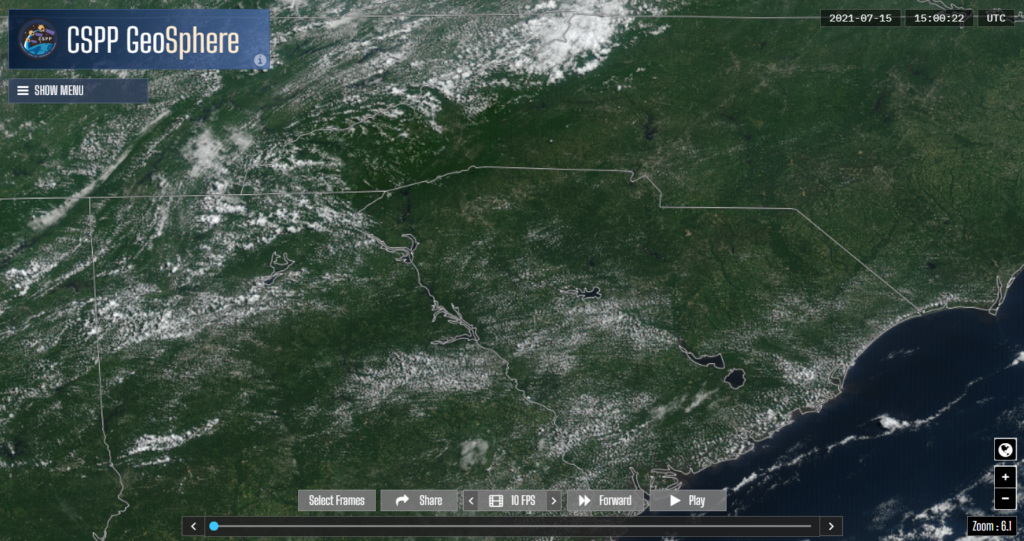
The Cloud Thickness information suggests that any clouds are thin, and that morning burn-off will be speedy. That is indeed what happened, as shown by the 1500 UTC image below (taken from the CSPP Geosphere site). Recall that the Cloud Thickness product is not produced in the times that surround sunrise (or sunset).

