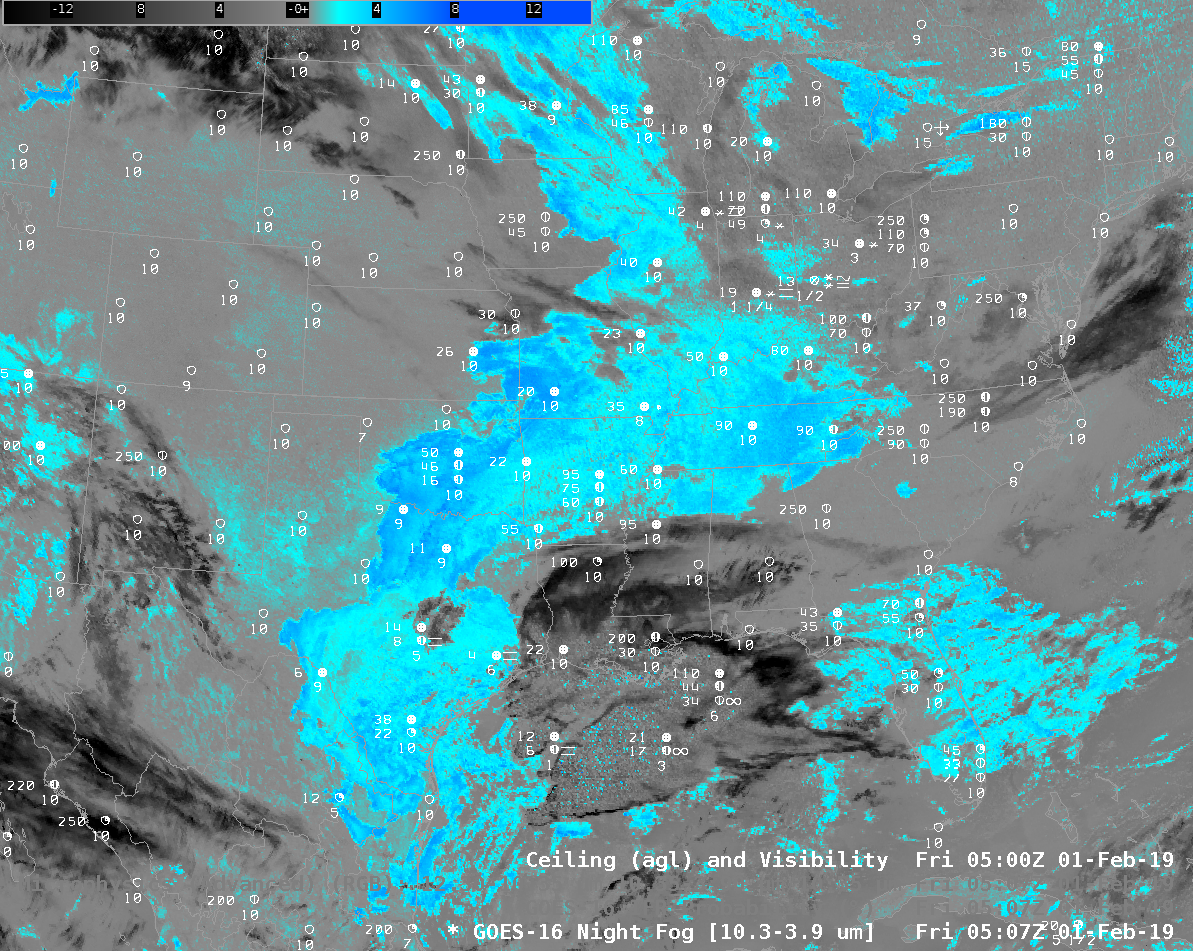
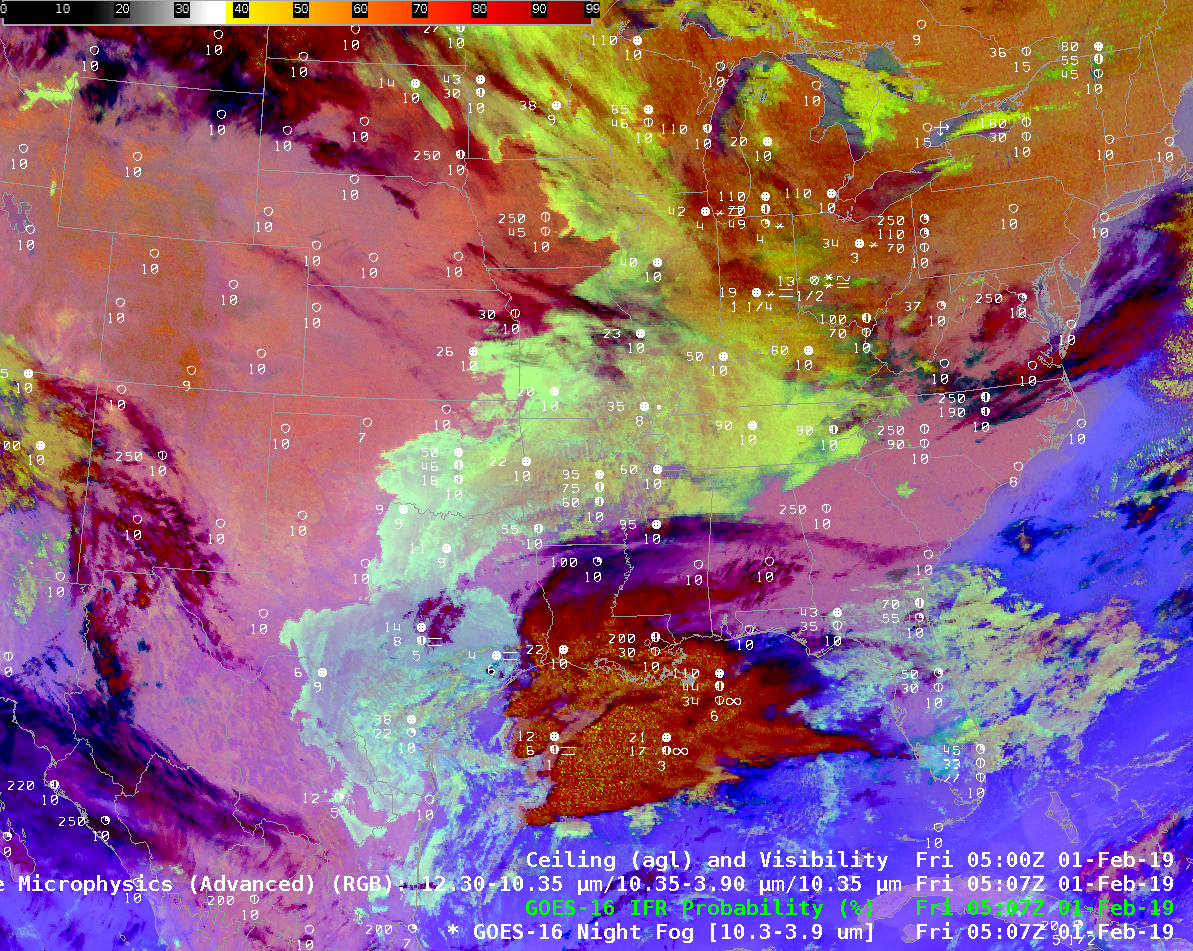
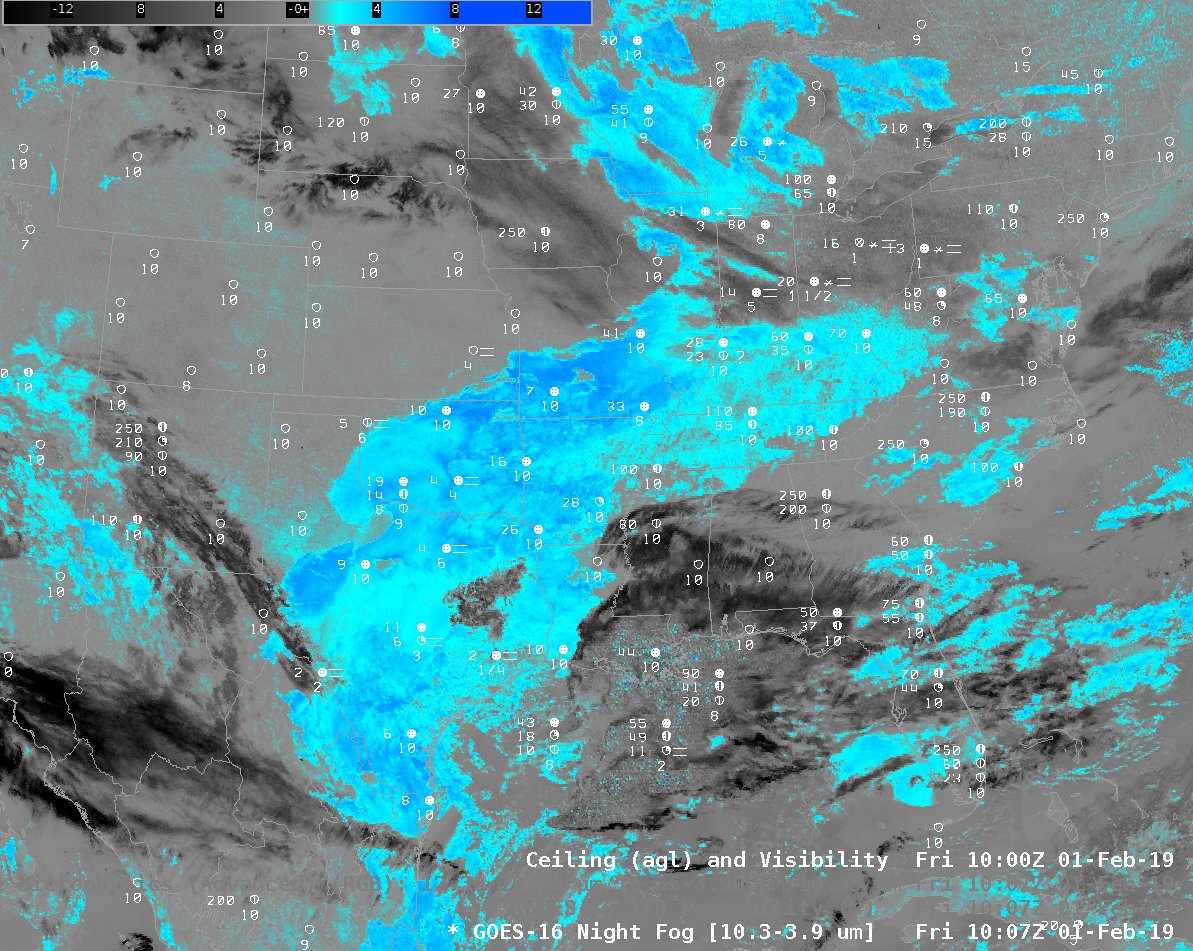
Night Fog Brightness Temperature Difference (10.3 µm – 3.9 µm) and Nighttime Microphysics RGB at 0507 UTC on 1 February 2019, and surface observations of ceilings and visibilities (Click to enlarge)
The toggle above displays the Night Fog Brightness Temperature Difference field (10.3 µm – 3.9 µm) and the Night Time Microphysics Red/Green/Blue (RGB) Product that uses the Night Fog Brightness Temprature Difference field as its green value. In the color enhancements above, cyan in the Night Fog Brightness Temperature Difference denotes positive values that occur because stratus clouds — that is, clouds that are made up of water droplets — do not emit 3.9 µm radiation as a blackbody. Consequently, the computation of brightness temperature (which assumes blackbody emission) results in a 3.9 µm brightness temperature that is cooler than at 10.3 µm (clouds are emitting 10.3 µm radiation very nearly like a blackbody). Low clouds in the RGB that may or may not support IFR conditions range in color from light cyan (over Texas and Florida) to more orange and yellow (yellow over the Great Lakes were exceptionally cold air is in place).
The fields above are overpredicting where fog/low ceilings might be occurring because cloud top measurements from the Brightness Temperature Difference do not always give reliable guidance on cloud base.
By merging satellite information about clouds and cloud type with Rapid Refresh model information at about low-level saturation, GOES-R IFR Probability fields screen out regions where IFR conditions are unlikely; the map suggests low ceilings and fog are most likely over Texas and Oklahoma. The zoomed in image, below shows that IFR conditions are indeed occurring in this region. Other regions with a strong signal in the Brightness Temperature Difference field — Tennessee, for example — show low IFR Probability and surface observations that do not show IFR conditions.
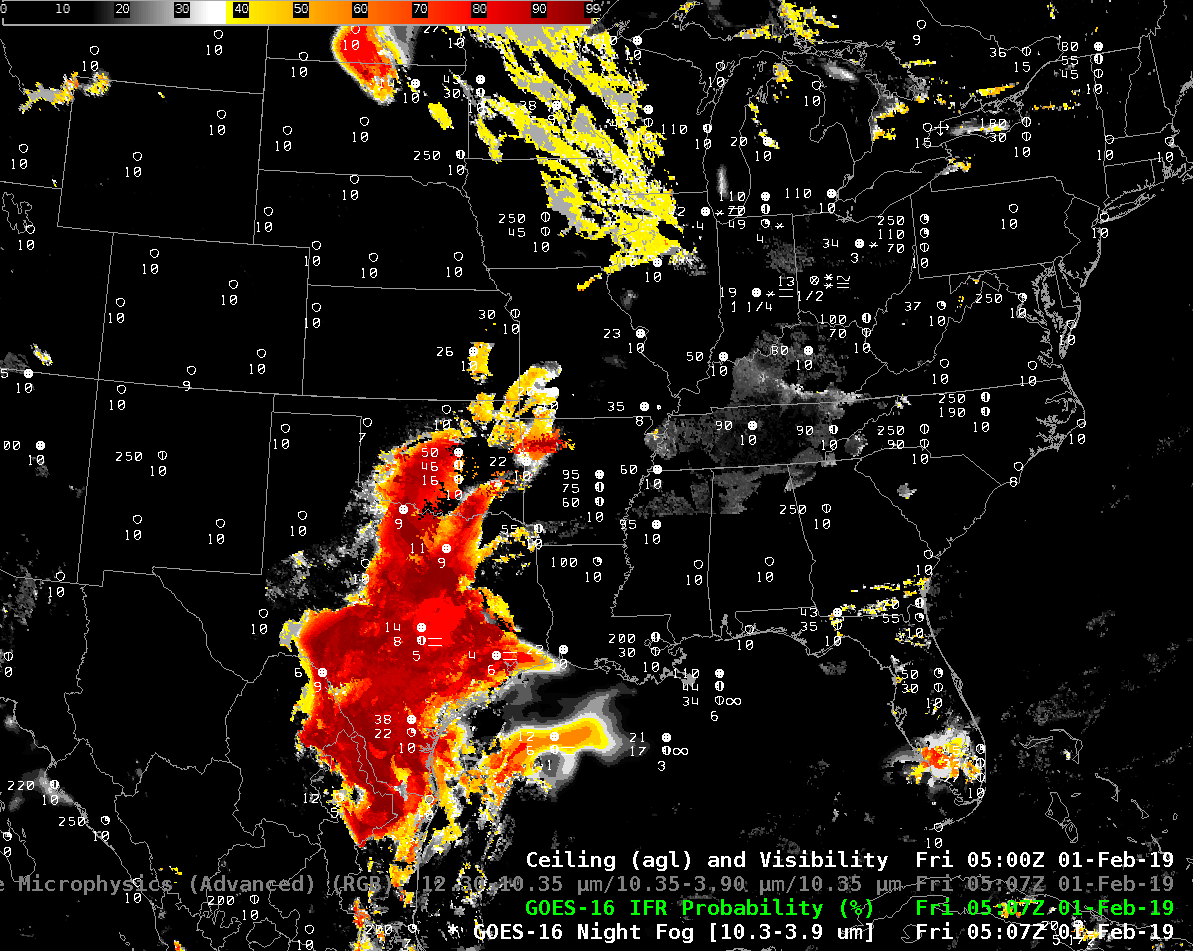
GOES-R IFR Probability field, 0507 UTC on 1 February, along with surface reports of ceilings and visibility (Click to enlarge)

GOES-R IFR Probability field, 0507 UTC on 1 February, along with surface reports of ceilings and visibility zoomed in over the southern Plains (Click to enlarge)

Night Fog Brightness Temperature Difference (10.3 µm – 3.9 µm) and Nighttime Microphysics RGB at 1007 UTC on 1 February 2019, and surface observations of ceilings and visibilities (Click to enlarge)
The same relationships occur at 1007 UTC; the Night Fog Brightness Temperature Difference and Nighttime Microphysics RGB overpredict the regions of low clouds/fog; IFR Probability’s use of Rapid Refresh Data allows it to screen out regions where fog is not present, but stratus clouds are, and also add in regions where cirrus clouds prevent the detection of low clouds, but Rapid Refresh data suggests low-level saturation is present (such as over the Gulf of Mexico south of Louisiana).
The IFR Probability field is accurately outlining the region of IFR conditions.
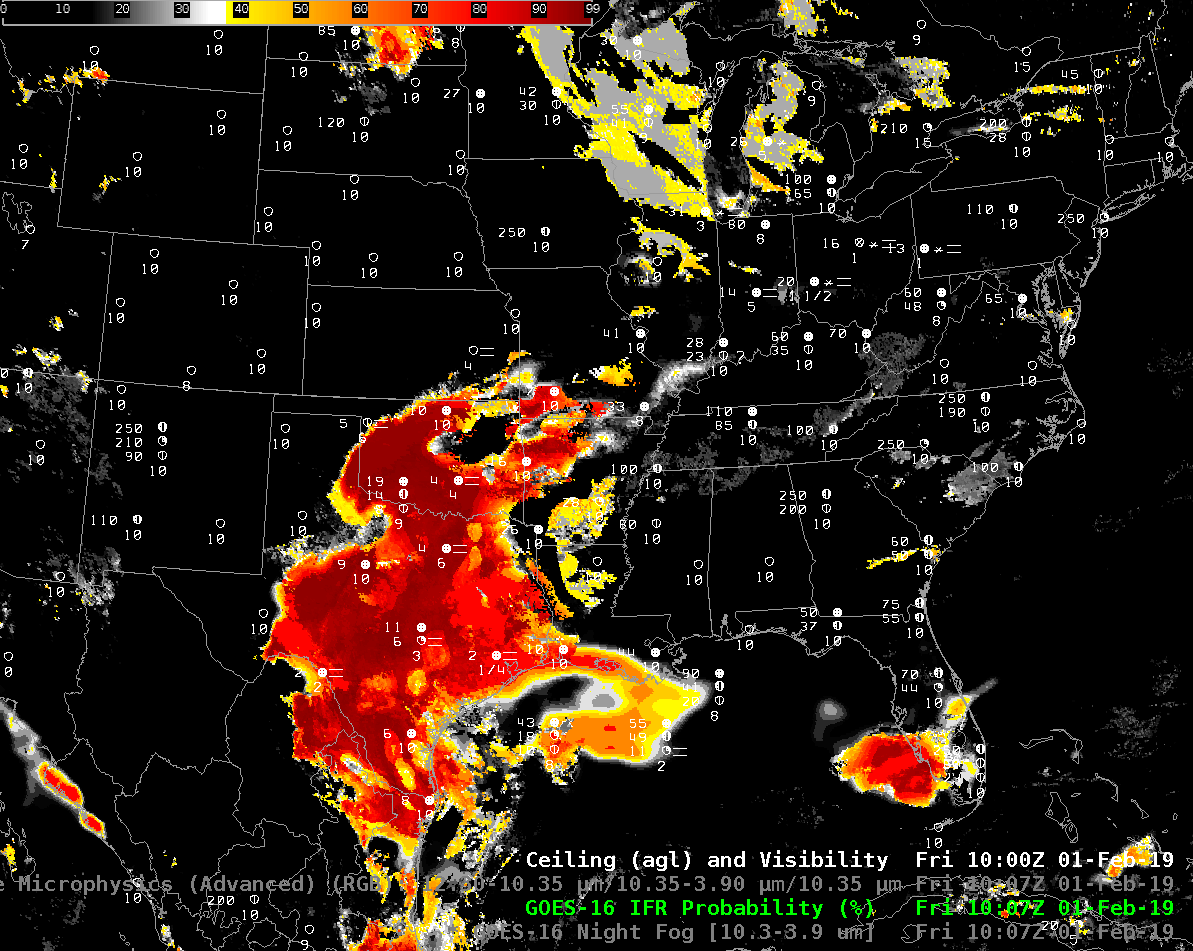
GOES-R IFR Probability field, 1007 UTC on 1 February, along with surface reports of ceilings and visibility (Click to enlarge)
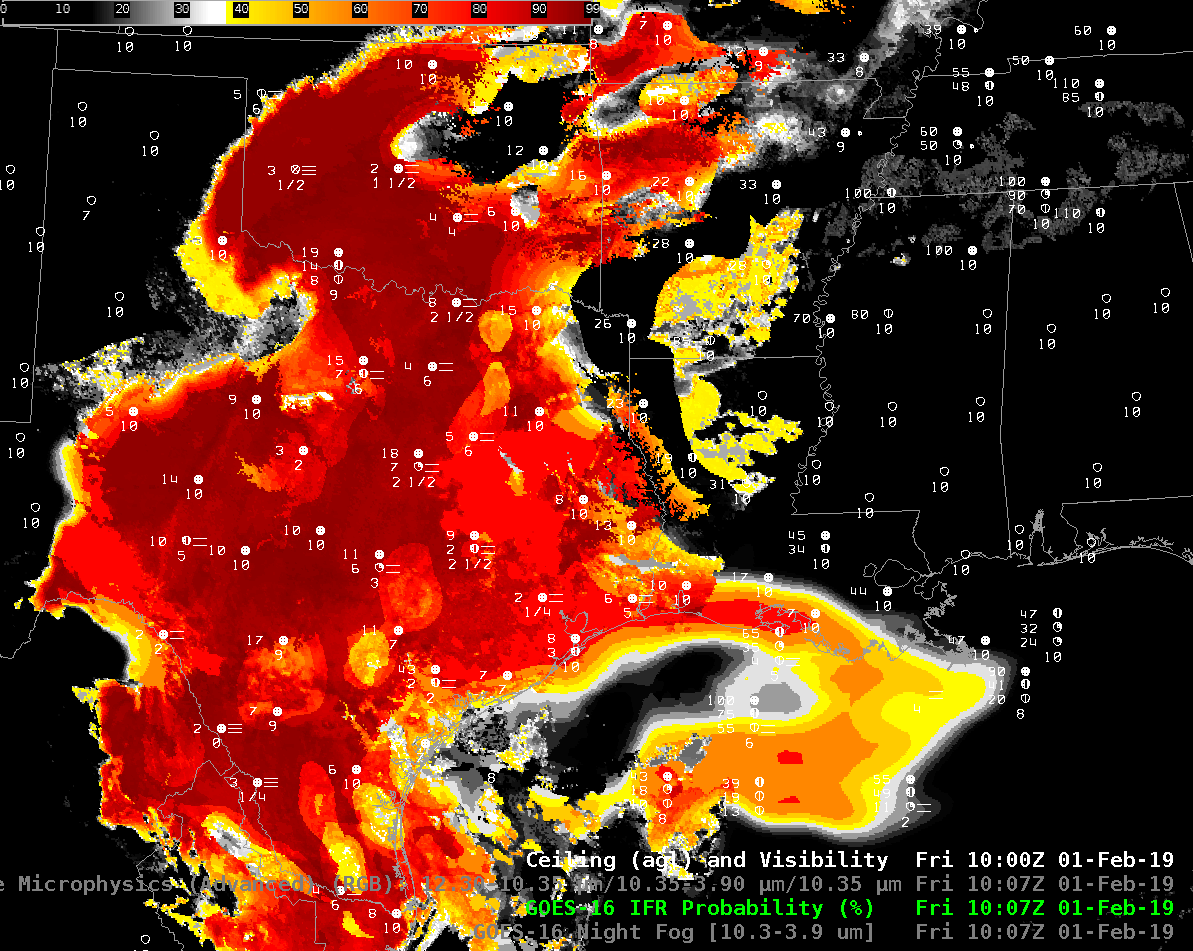
GOES-R IFR Probability field, 1007 UTC on 1 February, along with surface reports of ceilings and visibility zoomed in over the southern Plains (Click to enlarge)