
Night Fog Brightness Temperature Difference (10.3 µm – 3.9 µm). 1152 UTC on 11 October (Click to enlarge)
Consider the Night Fog Brightness Temperature Difference product, above. The enhancement is such that blue regions show where 10.3 µm brightness temperatures are warmer than brightness temperatures at 3.9 µm. At night, this occurs because cloud water droplets do not emit as much 3.9 µm radiation as a blackbody; the conversion of the sensed radiation to a brightness temperature assumes blackbody emissions have occurred, however, and as a result, the 3.9 µm brightness temperature is cool. Cloud water droplets do emit as a blackbody at 10.3 µm, so the brightness temperature over cloud water droplets is warmer than the it is at 3.9 µm. Blue, then, signifies stratus clouds in this enhancement. Can you tell where the fog is? Do you think IFR conditions are occurring wherever the Brightness Temperature Difference field is blue? How about under the extensive cirrus shield, associated with former Hurricane Michael, that is over the southeastern fifth of the image?
The Advanced NIght time Microphysics RGB for the same time, below, uses as one of its inputs (the ‘green channel’ in the RGB) the Night Fog Brightness Temperature Difference (Click here for a toggle between the two to reinforce that statement).
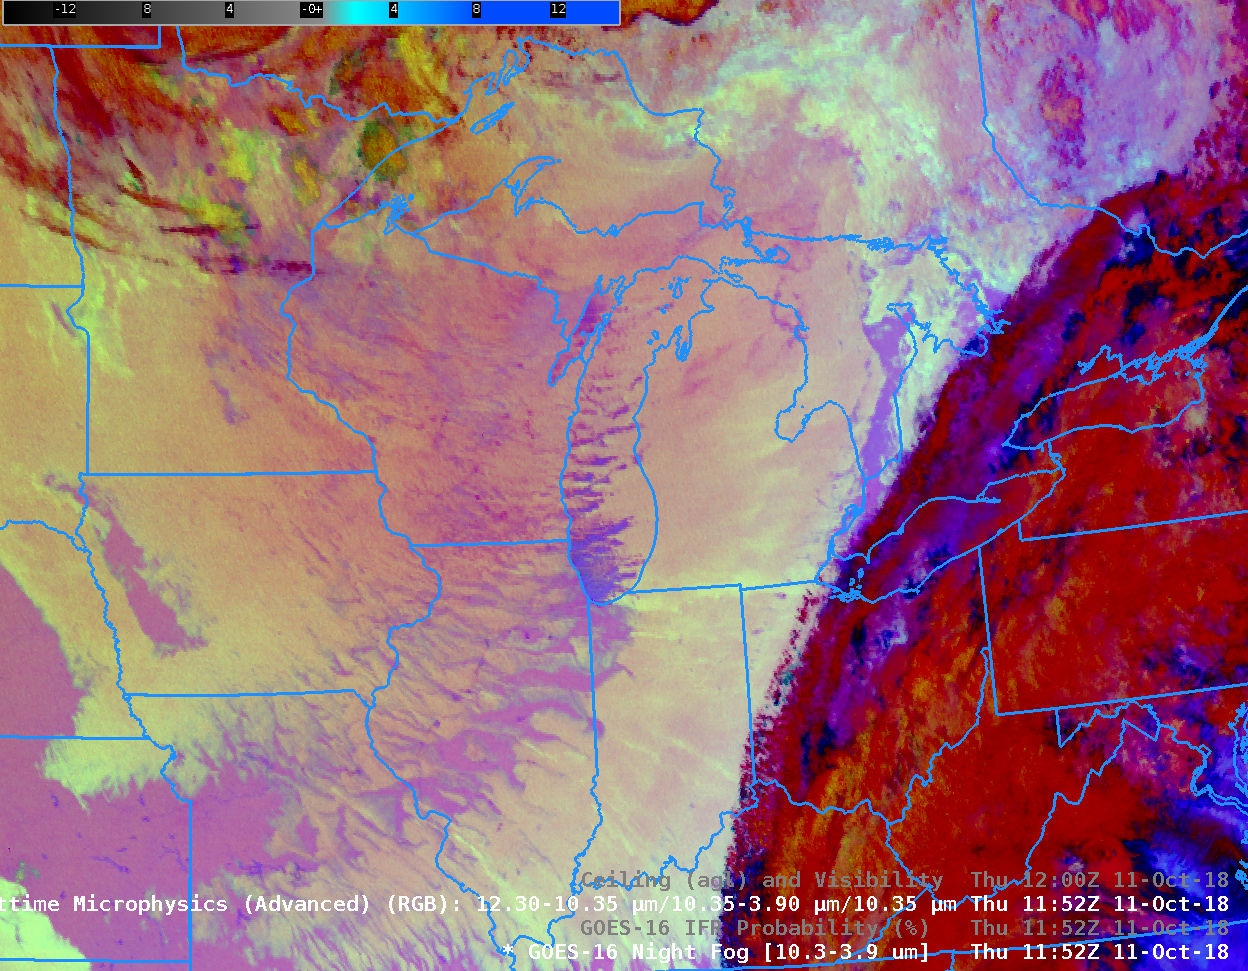
Night Time Microphysics RGB at 1152 UTC on 11 October (Click to enlarge)
GOES-R IFR Probability fields, below, for the same time are useful because Rapid Refresh model data used in IFR Probability include low-level model estimates of saturation. If saturation does not exist underneath the cloud deck, then IFR Probabilities are suppressed. Don’t expect fog, then, underneath the strong signal in the Brightness Temperature Difference field over most of the Midwestern United States! In addition, the Rapid Refresh Model data defines potential fog under the big cirrus shield over the Appalachians.
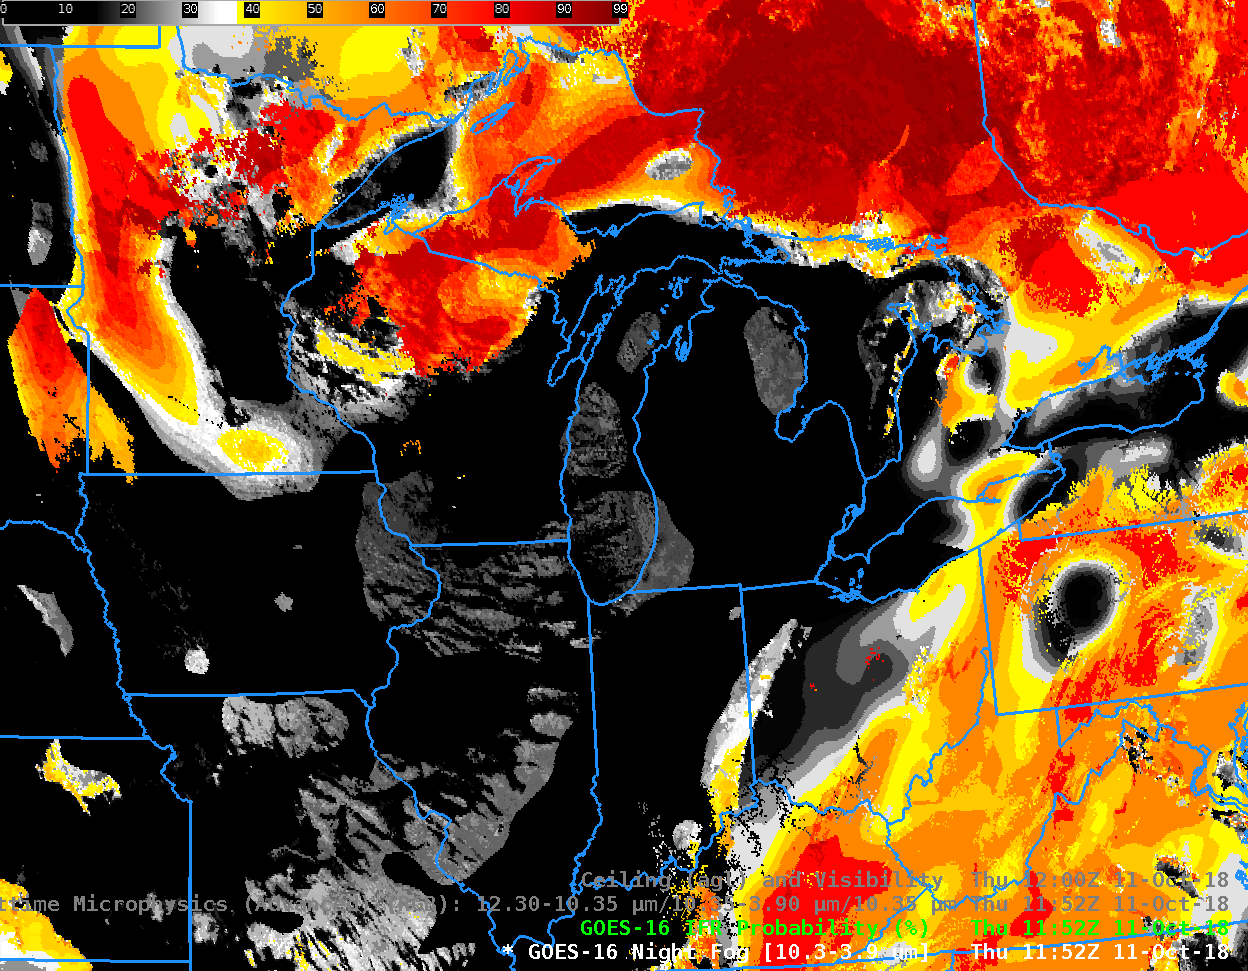
GOES-R IFR Probability fields at 1152 UTC on 11 October (Click to enlarge)
Click here for the Advanced Microphyics RGB with observations of ceilings and visibility. Here are the observations over the Brightness Temperature Difference. Observations plotted on top of IFR Probability are shown below.
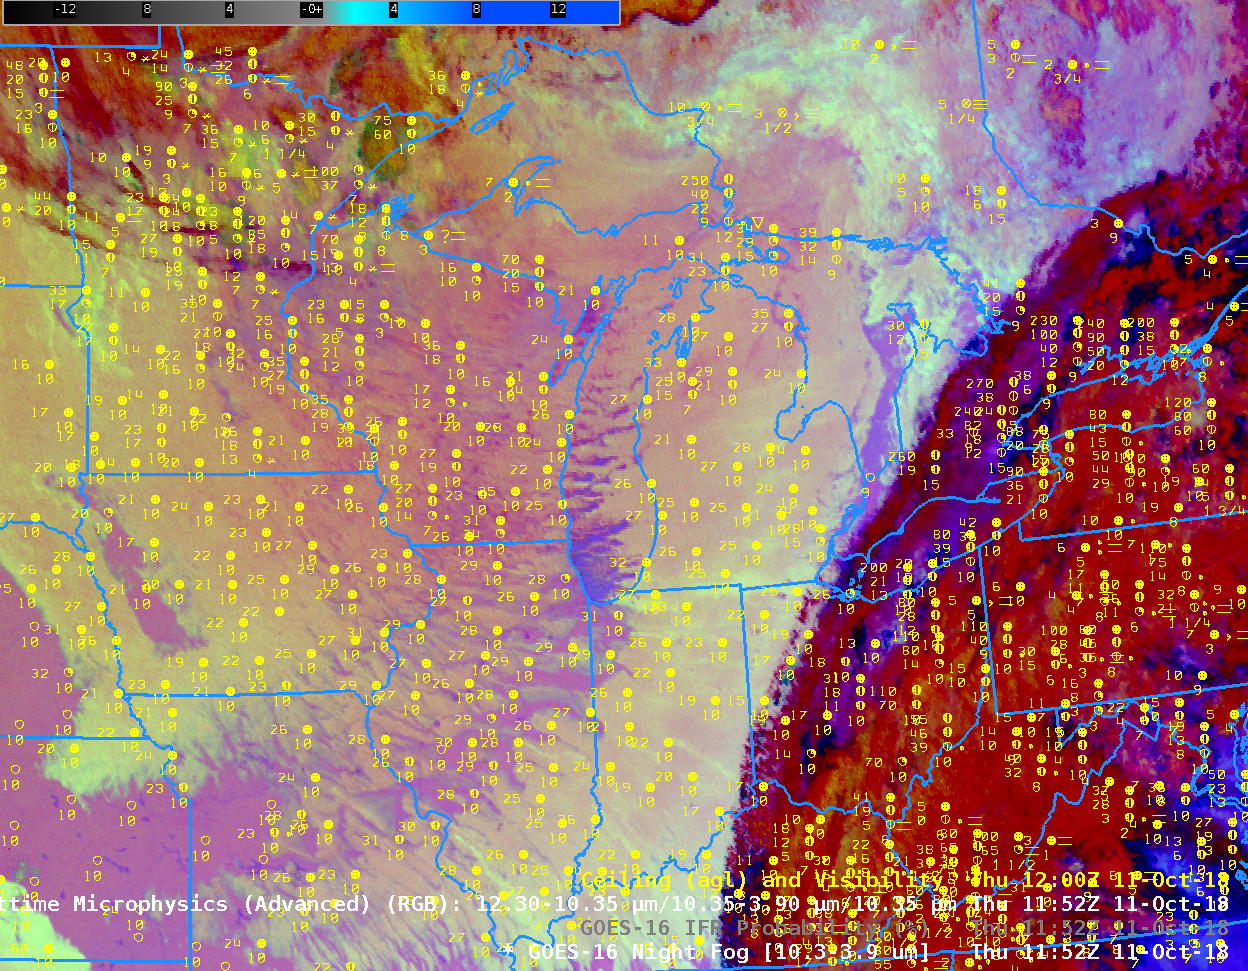
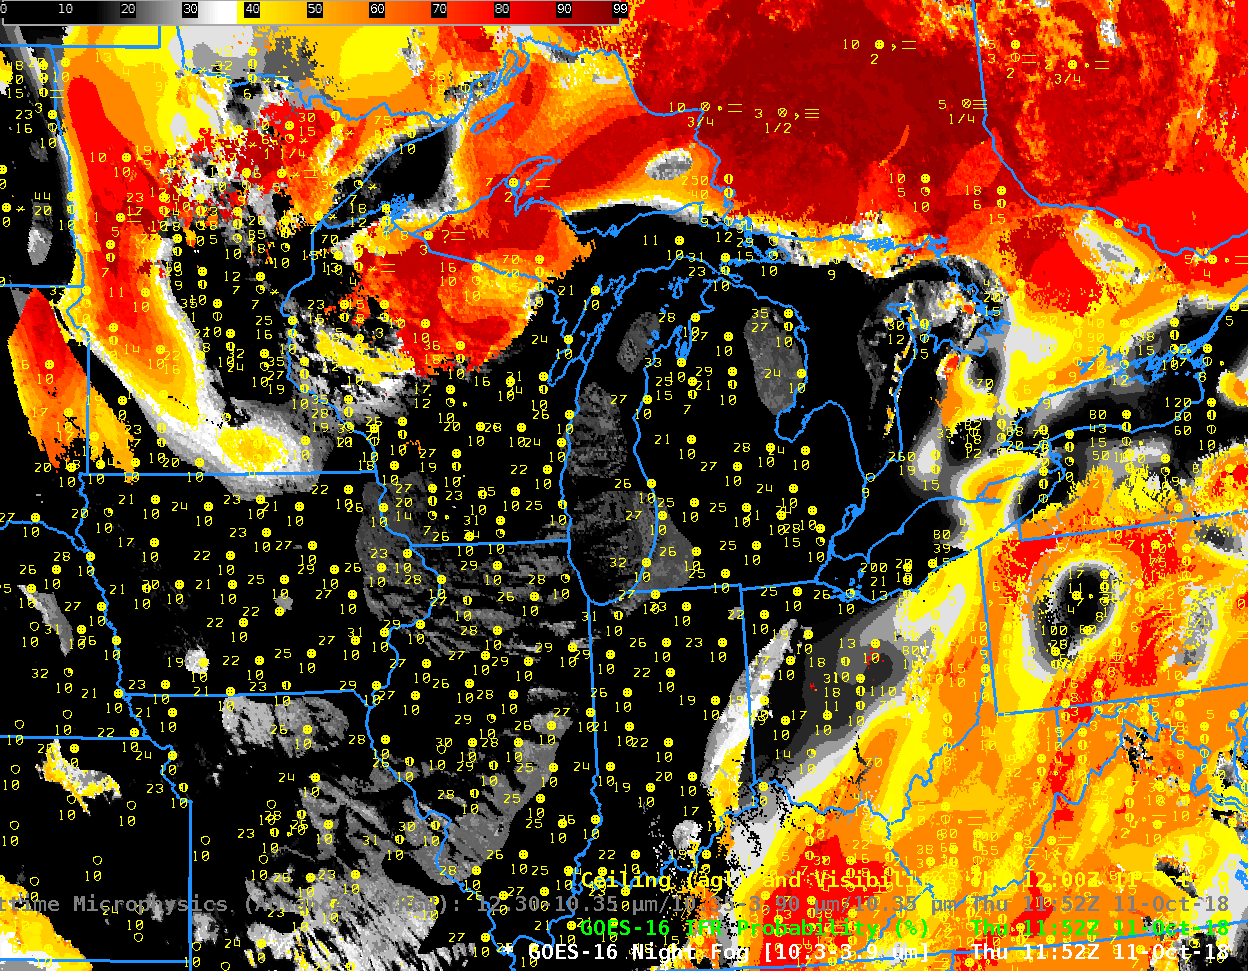
GOES-R IFR Probability fields at 1152 UTC on 11 October along with surface observations of ceilings and visibilities (Click to enlarge)