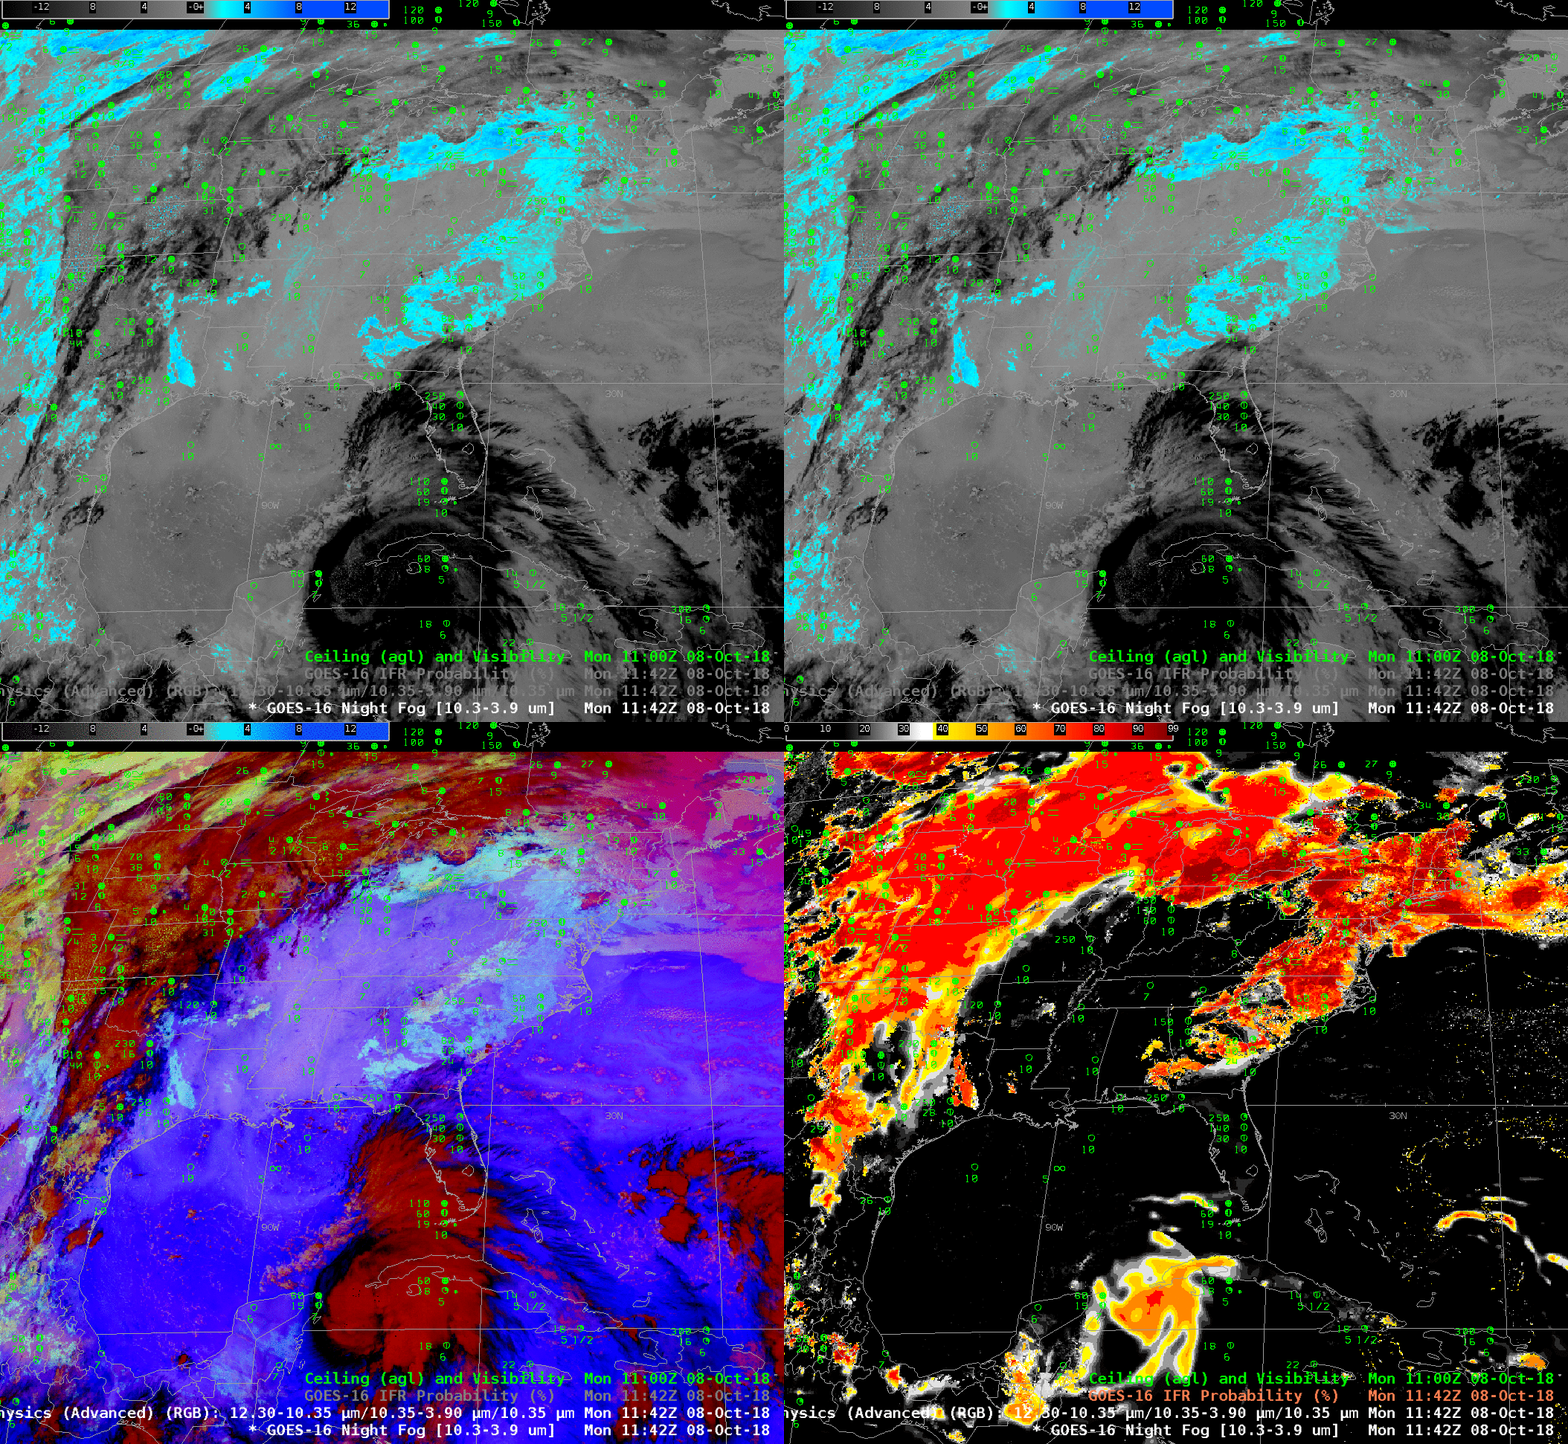
GOES-16 Night Fog Brightness Temperature Difference (10.3 µm – 3.9 µm), Advanced Night Time Microphysics RGB, and GOES-16 IFR Probability fieds at 1142 UTC on 8 October 2018 (Click to enlarge)
Fog and low stratus were widespread on 8 October over the Plains, in particular over Iowa and Minnesota. What satellite tools exist to highlight such regions of lowered ceilings and reduced visibility?
When IFR conditions — fog and low stratus — occur with extratropical cyclones that generate multiple cloud layers, satellite detection of low clouds is difficult because higher clouds get in the way of the near-surface view. The animation above steps through the Night Fog Brightness Temperature Difference (10.3 µm – 3.9 µm; low clouds in the default enhancement are cyan), the Nighttime Microphysics Red-Green_blue (RGB) composite (low clouds in the RGB are cyan to yellow, depending on the temperature) and the GOES-R IFR Probability field (Probabilities for IFR conditions are highest in orange/red regions) for 1142 UTC on 8 October 2018, when low ceilings were widespread over the Plains and East Coast. Abundant high clouds rendered the Night Fog Brightness Temperature difference product (and, by extenstion, the Night Time Microphysics RGB, because the RGB uses the Night Fog Brightness Temperature Difference as its ‘Green’ Component) ineffective in outlining potential regions of low clouds. In contrast, the IFR Probability field was able to highlight low clouds under the high clouds because it fuses satellite data (ineffective at this time) with Rapid Refresh model estimates of low-level saturation.
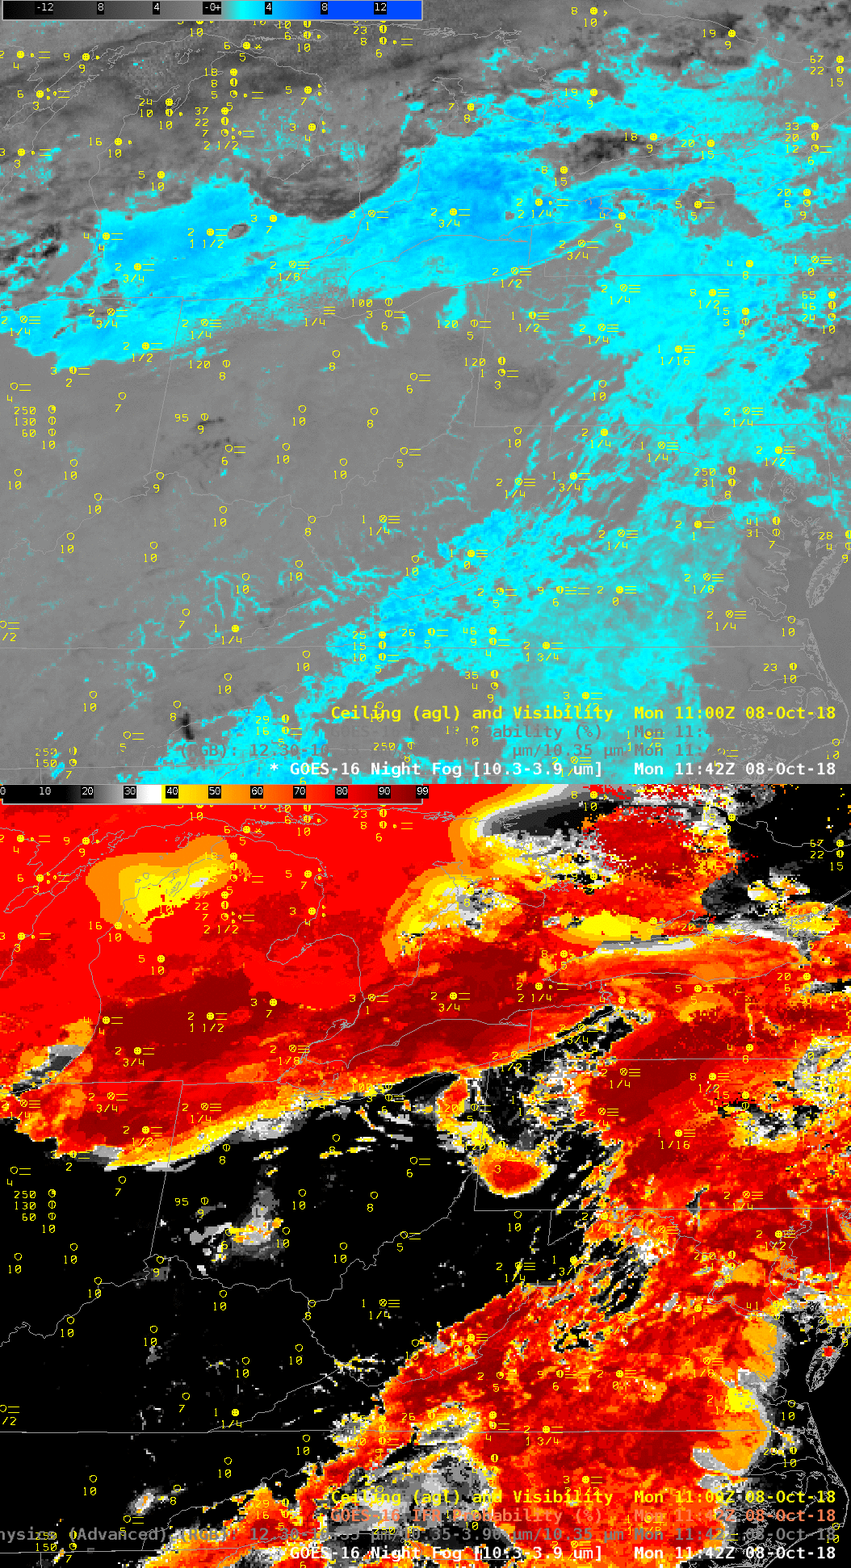
There are regions — southern Lake Erie, for example — where the lack of high clouds allows the Brightness Temperature Difference field, and the Nighttime Microphysics RGB to operate with success in identifying low clouds.
The toggle below shows the Night Fog Brightness Temperature Difference and the IFR Probabiity fields over the eastern portion of the country. Very small-scale (in the horizontal) features, such as river fog, are a challenge for IFR probability because the Rapid Refresh horizontal resolution of 13 km may not resolve river valleys.

