Monthly Archives: May 2017

Dense Fog under high clouds in the Deep South

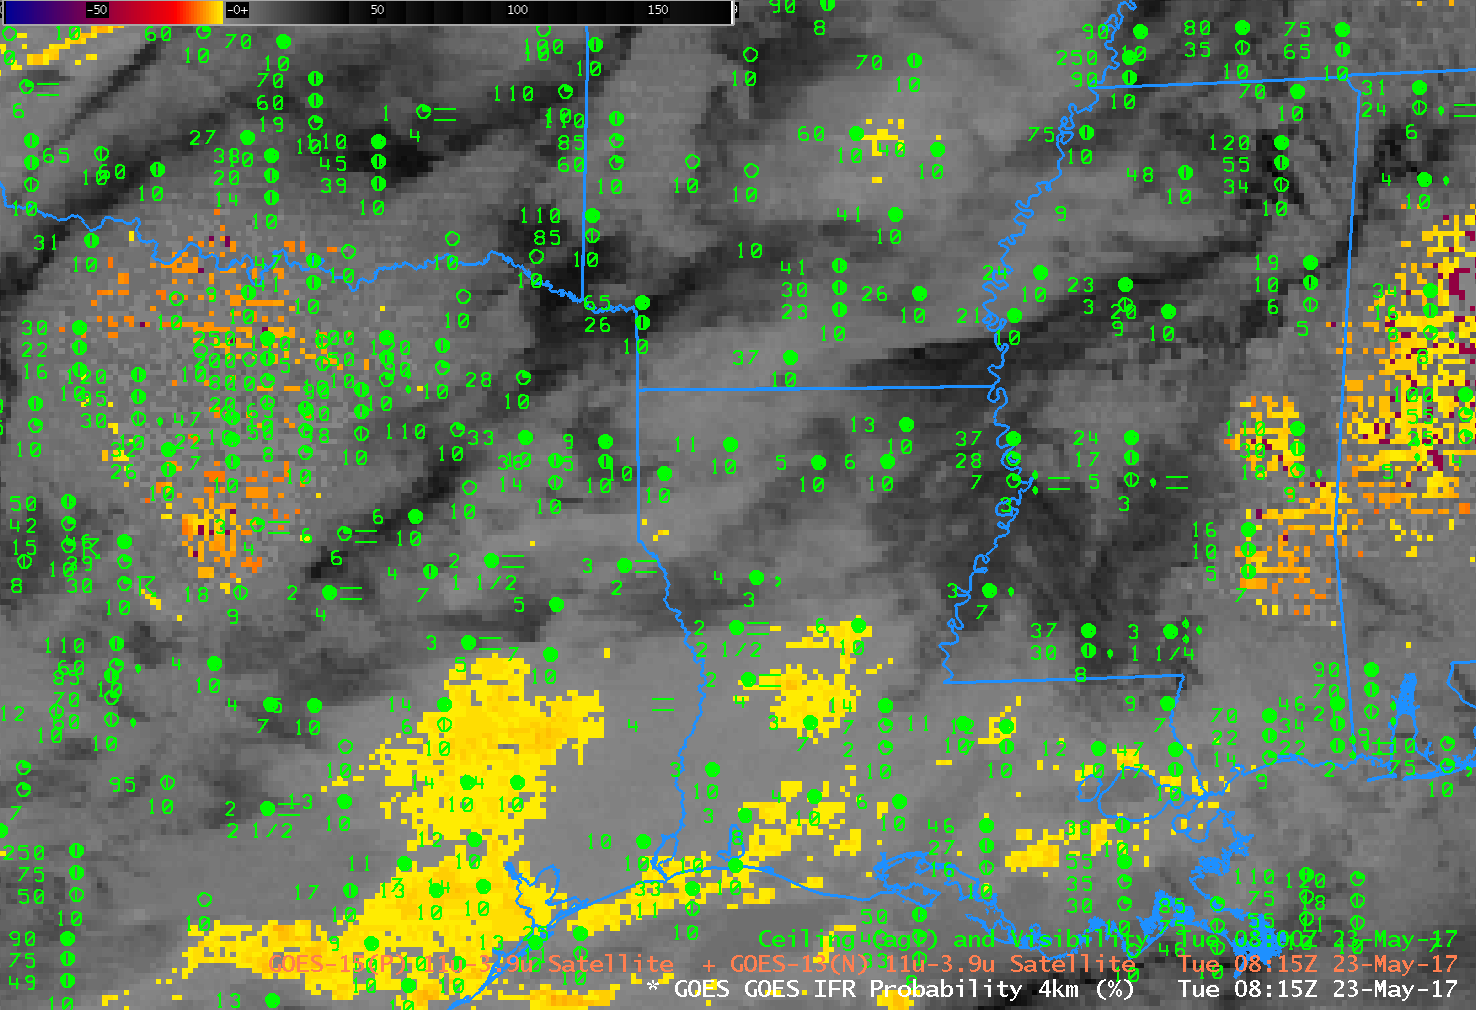
GOES-13 Brightness Temperature Difference (3.9 µm – 10.7 µm) Values at 0815 UTC on 23 May 2017 (Click to enlarge)

Note: GOES-R IFR Probabilities are computed using Legacy GOES (GOES-13 and GOES-15) and Rapid Refresh model information; GOES-16 data will be incorporated into the IFR Probability algorithm in late 2017

The legacy method of detecting fog/low clouds from satellite is the Brightness Temperature Difference product that compares computed brightness temperatures at 3.9 µm and at 10.7 µm. At night, because clouds composed of water droplets do not emit 3.9 µm radiation as a blackbody, the inferred 3.9 µm brightness temperature is colder than the brightness temperature computed using 10.7 µm radiation. In the image above, the brightness temperature difference has been color-enhanced so that clouds composed of water droplets are orange — this region is mostly confined to southeast Texas. Widespread cirrus and mid-level clouds are blocking the satellite view of low clouds. IFR and near-IFR conditions are widespread over east Texas, Louisiana and Mississippi. The GOES-R IFR Probability field, below, from the same time, suggests IFR conditions are likely over the region where IFR conditions are observed.

This is a case where the model information that is included in this fused product (that includes both satellite observations where possible and model predictions) fills in regions where cirrus and mid-level clouds obstruct the satellite’s view of low clouds.. As a situational awareness tool, GOES-R IFR Probability can give a more informed representation of where restricted visibilities and ceilings might be occurring.

IFR Conditions continued into early morning as noted in this screenshot from the Aviation Weather Center.

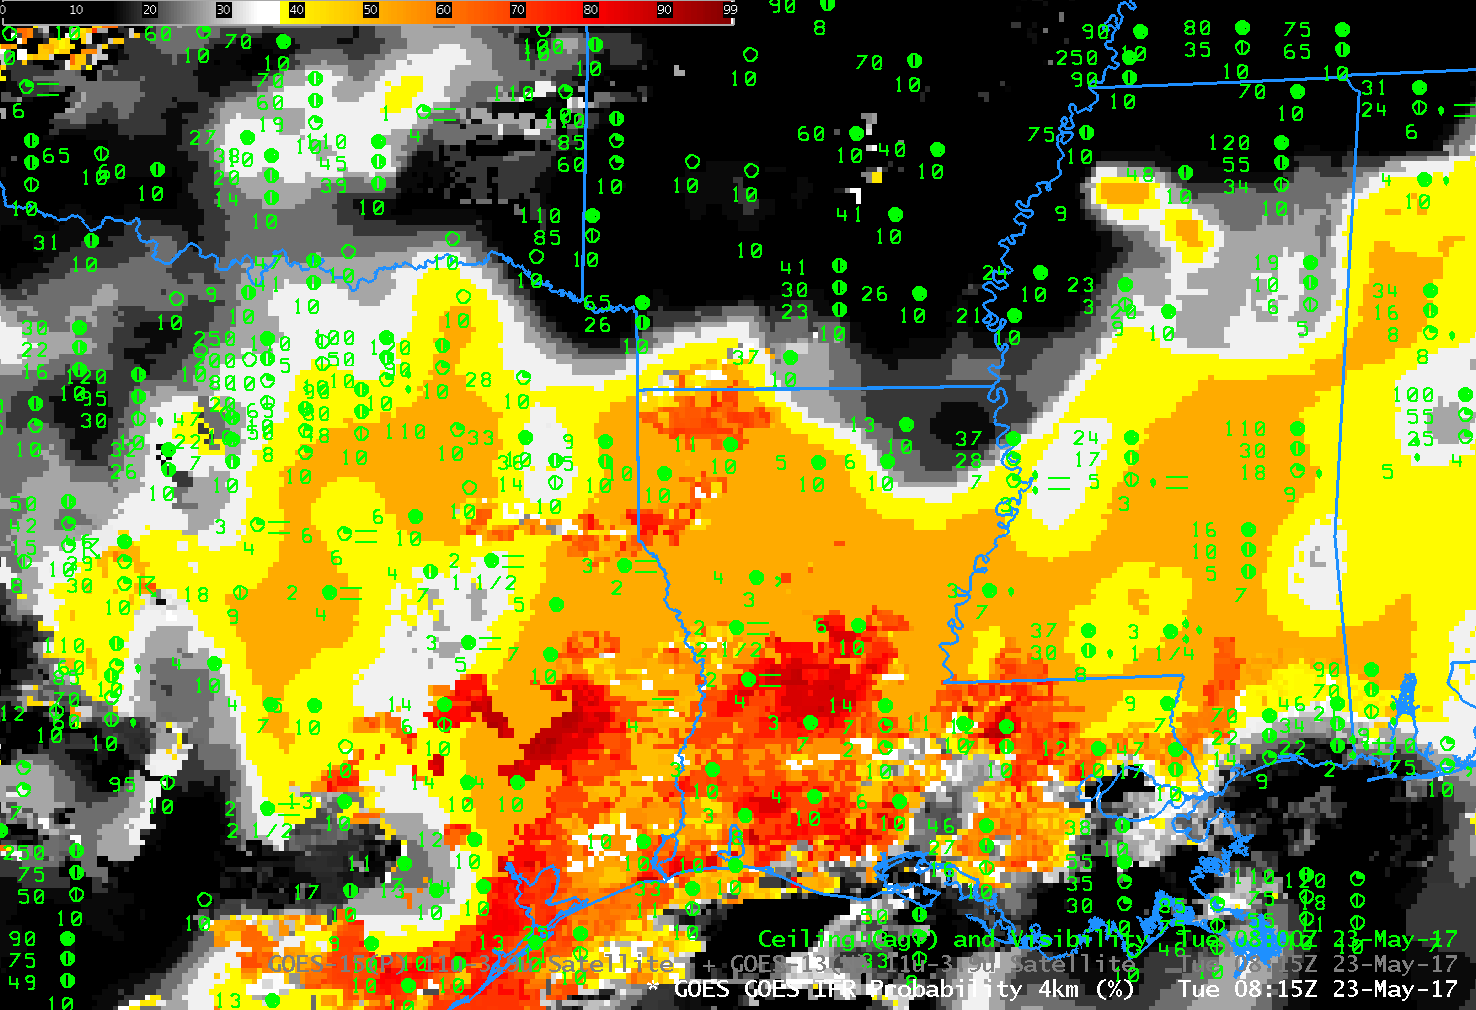
GOES-R IFR Probability fields, 0815 UTC on 23 May 2017 (Click to enlarge)

IFR Conditions under multiple cloud decks in the Upper Midwest

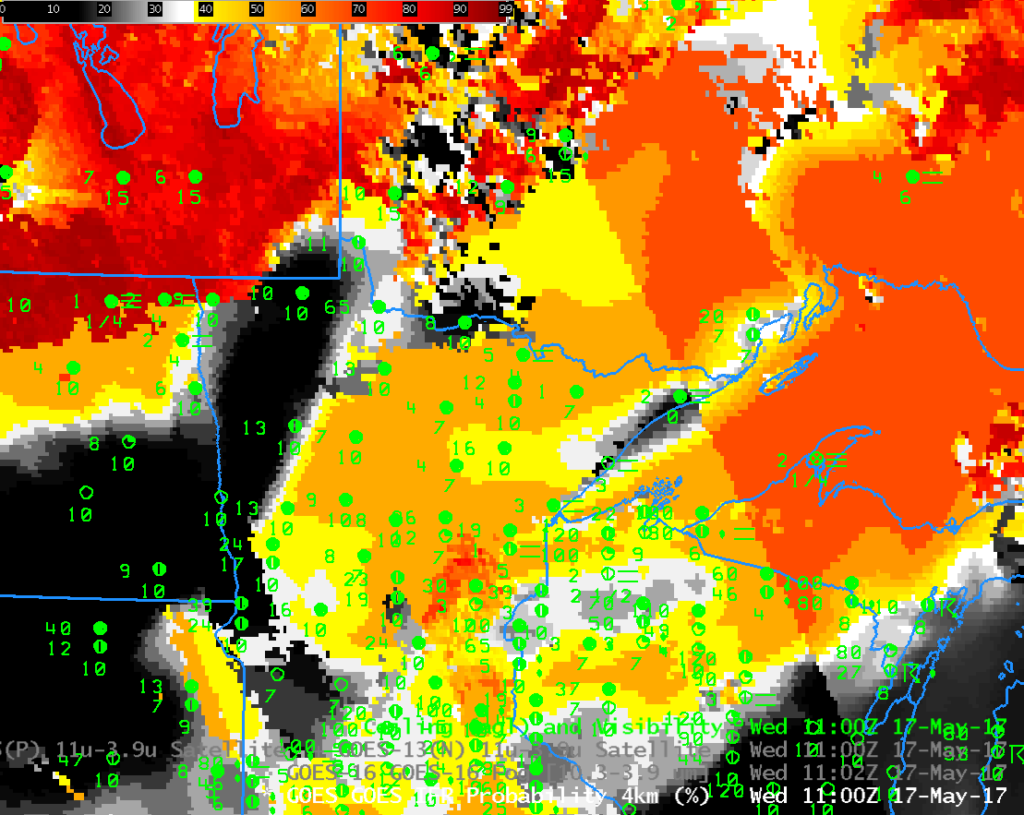
GOES-R IFR Probability Field, along with observations of surface visibility and ceiling heights, 1100 UTC on 17 May 2017 (Click to enlarge)

Note: GOES-R IFR Probabilities are computed using Legacy GOES (GOES-13 and GOES-15) and Rapid Refresh model information; GOES-16 data will be incorporated into the IFR Probability algorithm in late 2017

The GOES-16 data posted on this page are preliminary, non-operational data and are undergoing testing

A morning screenshot from the Aviation Weather Center website shows a wide region of IFR and Low IFR Conditions reported over the Upper Midwest, from eastern North Dakota eastward to Lake Superior. The GOES-R IFR Probability field, above, from 1100 UTC on 17 May 2017, shows high probabilities over that region.

Over much of Minnesota and Michigan, the character of the IFR Probability field is flat.  This is typical of IFR Probability when high clouds prevent satellite data from being used as a statistical predictor for IFR Conditions.  If high clouds are present, the satellite cannot detect the presence of low clouds, and the chief predictor of IFR conditions will therefore be model data that typically does not vary strongly from gridpoint to gridpoint when IFR conditions are present.  The pronounced boundary apparent in the IFR Probability field that extends nortwestward from Green Bay in Wisconsin is the boundary between night-time predictors (to the west) and daytime predictors (to the east).

GOES-R IFR Probability values are largest in the region of IFR conditions over North Dakota.  In this region, high clouds are not present and the satellite is able to detect low clouds, and that information is part of the computation of IFR Probabilities.  Note also the region in east-central Minnesota where satellite data are also being used in the computation of IFR Probabilities;  the resultant field there is pixelated.

The toggle below shows the brightness temperature difference field between the shortwave and longwave infrared window channels from GOES-13 (3.9 µm and 10.7 µm) and GOES-16 (3.9 µm and 10.33 µm).  This brightness temperature difference field is used to detect stratus, and by inference fog, because stratus cloud tops composed of water droplets emit radiation around 10.3-10.7 µm as a blackbody, but do not emit 3.9 µm radiation as a blackbody.  Satellite detection of radiation, and computation of the inferred temperature of the emitting surface, assumes blackbody emissions.  Consequently, the brightness temperature computed using detected 3.9 µm radiation is colder than that computed using 10.7 µm (or 10.33 µm) radiation.

Both satellites capture the region of low stratus/fog over North Dakota, and the superior spatial resolution of GOES-16 is apparent. Note, however, that neither satellite can detect low clouds associated with dense fog in regions of higher clouds — over Michigan’s Keewenaw Peninsula, for example, or along the shore of Lake Superior in Minnesota. This is an unavoidable shortcoming of satellite-only-based detection of low clouds/fog.

GOES-13 (3.9 µm – 10.7 µm) and GOES-16 (10.33 µm – 3.9 µm) Brightness Temperature Difference fields, 1100 UTC on 17 May 2017 (Click to enlarge)

Dense Fog from the Ohio Valley to North Carolina

Note: GOES-R IFR Probabilities are computed using Legacy GOES (GOES-13 and GOES-15) and Rapid Refresh model information; GOES-16 data will be incorporated into the IFR Probability algorithm in late 2017.

The weather.gov website on Wednesday morning 10 May 2017 showed two dense fog advisories, one near Cincinnati, OH and one near Greensboro, NC. The aviation weather website showed an IFR Sigmet in between the two regions of dense fog. The fog formed along a stationary front that sat over the region.

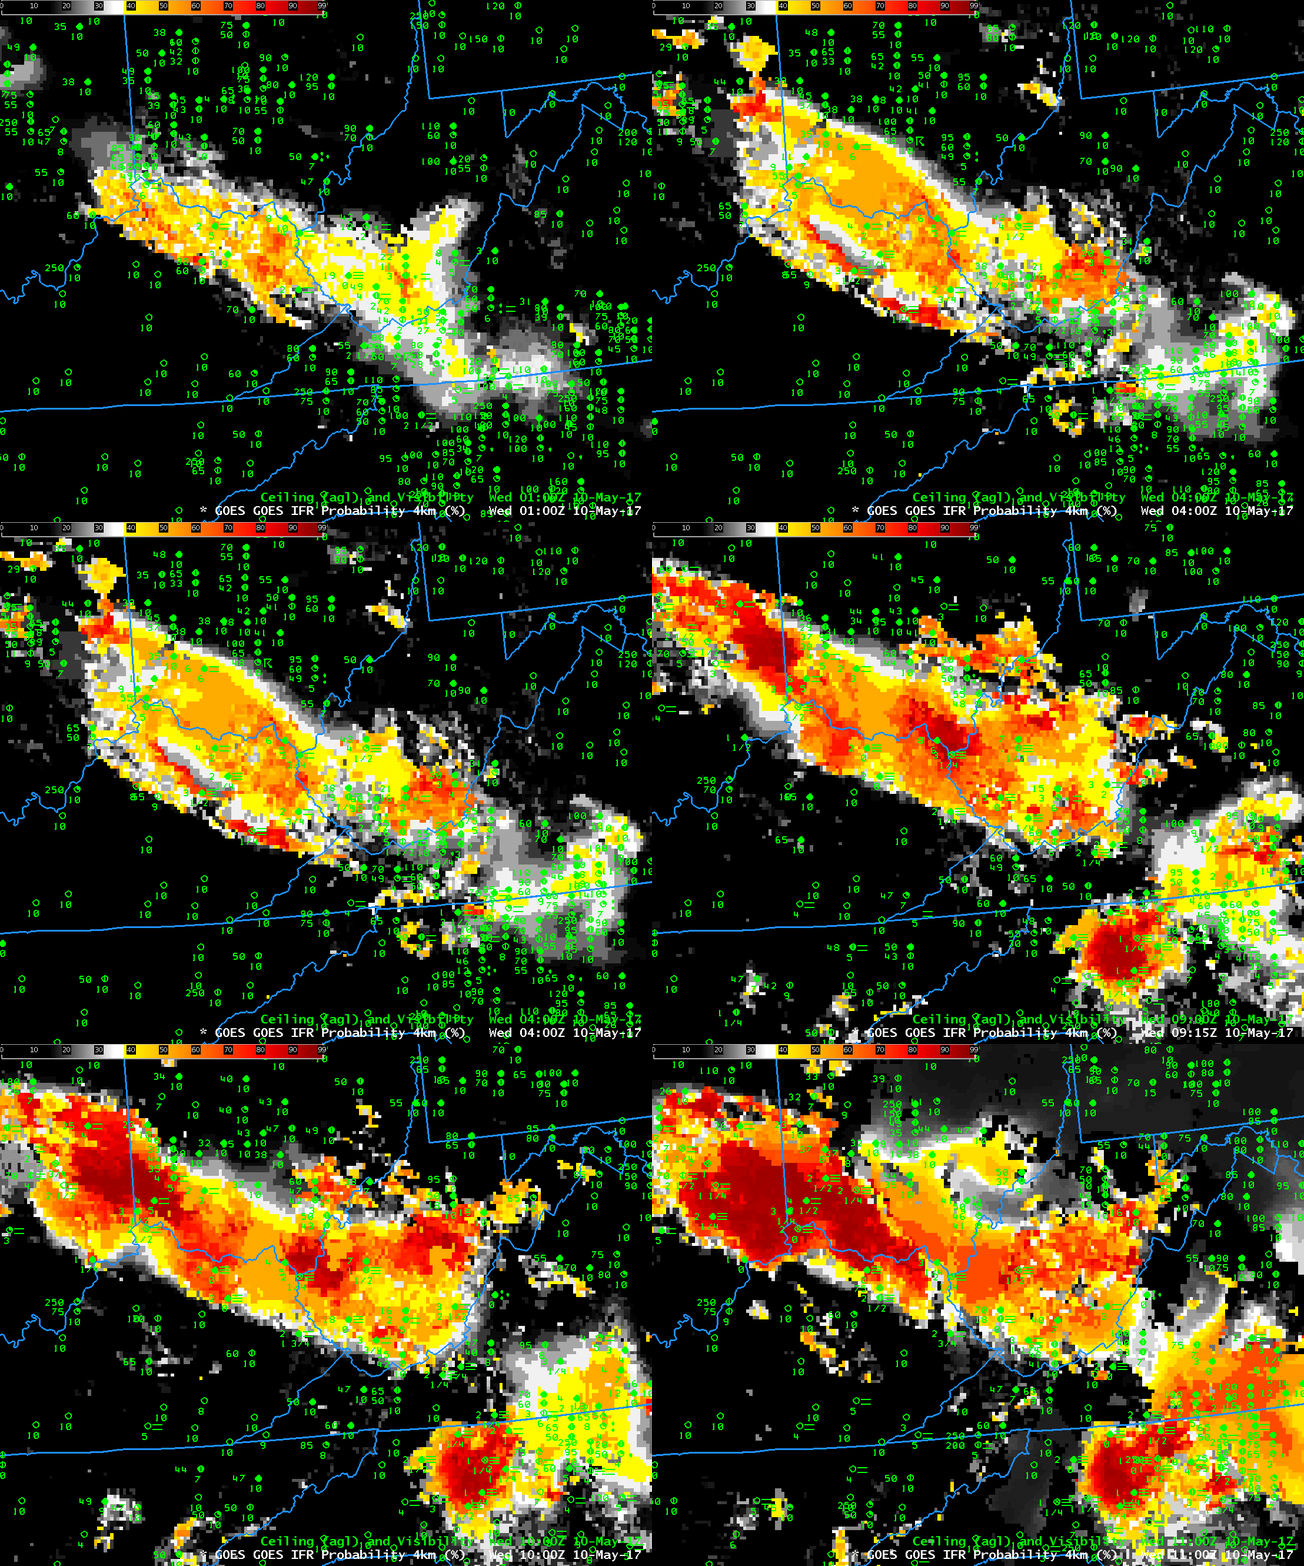
How well did GOES-R IFR Probabilities and GOES-13 Brightness Temperature Difference fields capture this event? The animation of GOES-R IFR Probability, below, computed using data from GOES-13 and the Rapid Refresh Model, shows enhanced probabilities early in the evening that increased with time. The orientation of the field — from west-northwest to east-southeast — aligns well with the regions of developing fog.

GOES-R IFR Probability fields, 0100, 0400 and 0700 – 1100 UTC on 10 May 2017 (Click to enlarge)

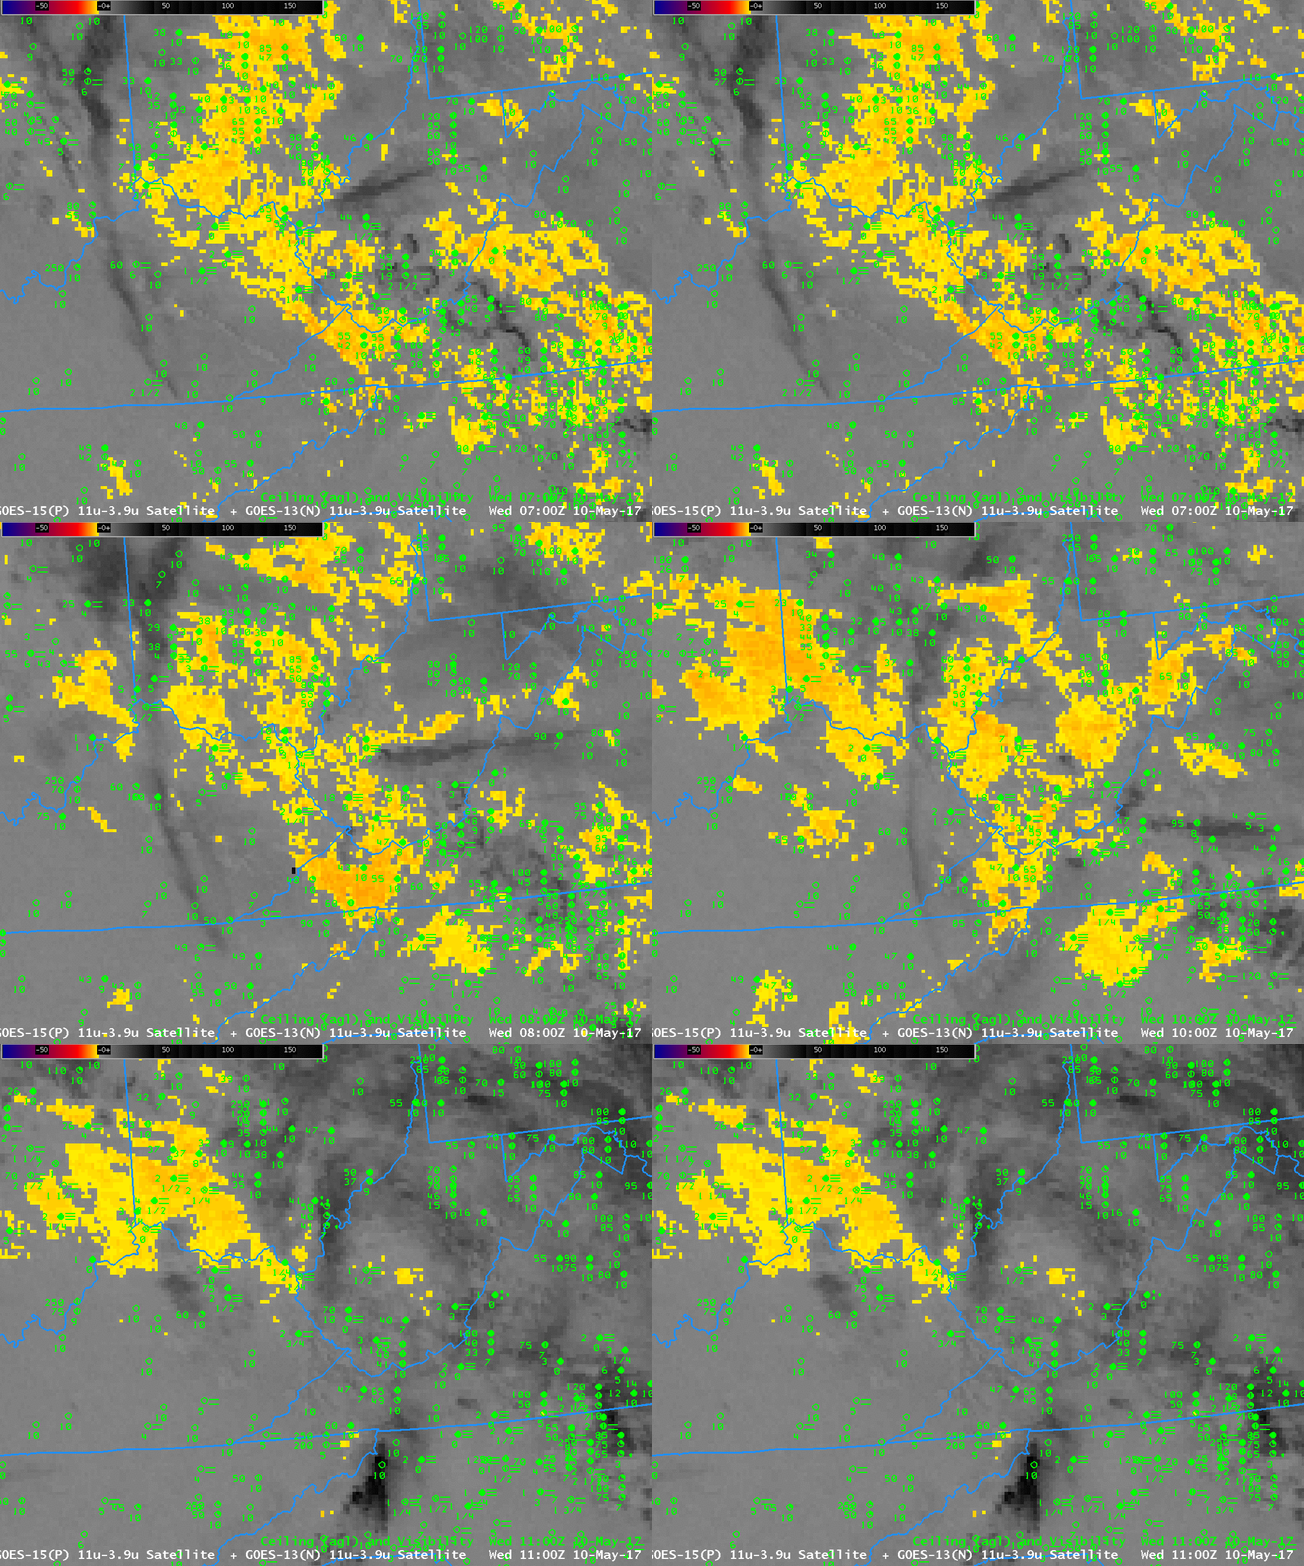
The brightness temperature difference field, below, did not perform as well in outlining the region of low ceilings/reduced visibilities because of the presence of high clouds that interfered with the ability to detect low clouds. Consequently, the highest brightness temperature differences (3.9 µm – 10.7 µm) do not align so well with the regions of developing fog. Note also that at the end of the animation — 1100 UTC — increasing amounts of reflected solar 3.9 µm radiation is changing the character of the field from negative to positive. In contrast, the IFR Probability fields (above) maintain a consistent signal through sunrise.

GOES-13 Brightness Temperature Difference fields (3.9 µm – 10.7 µm), 0700-1100 UTC on 10 May 2017 (Click to enlarge)

IFR Probability and Low IFR Probability in the Pacific Northwest

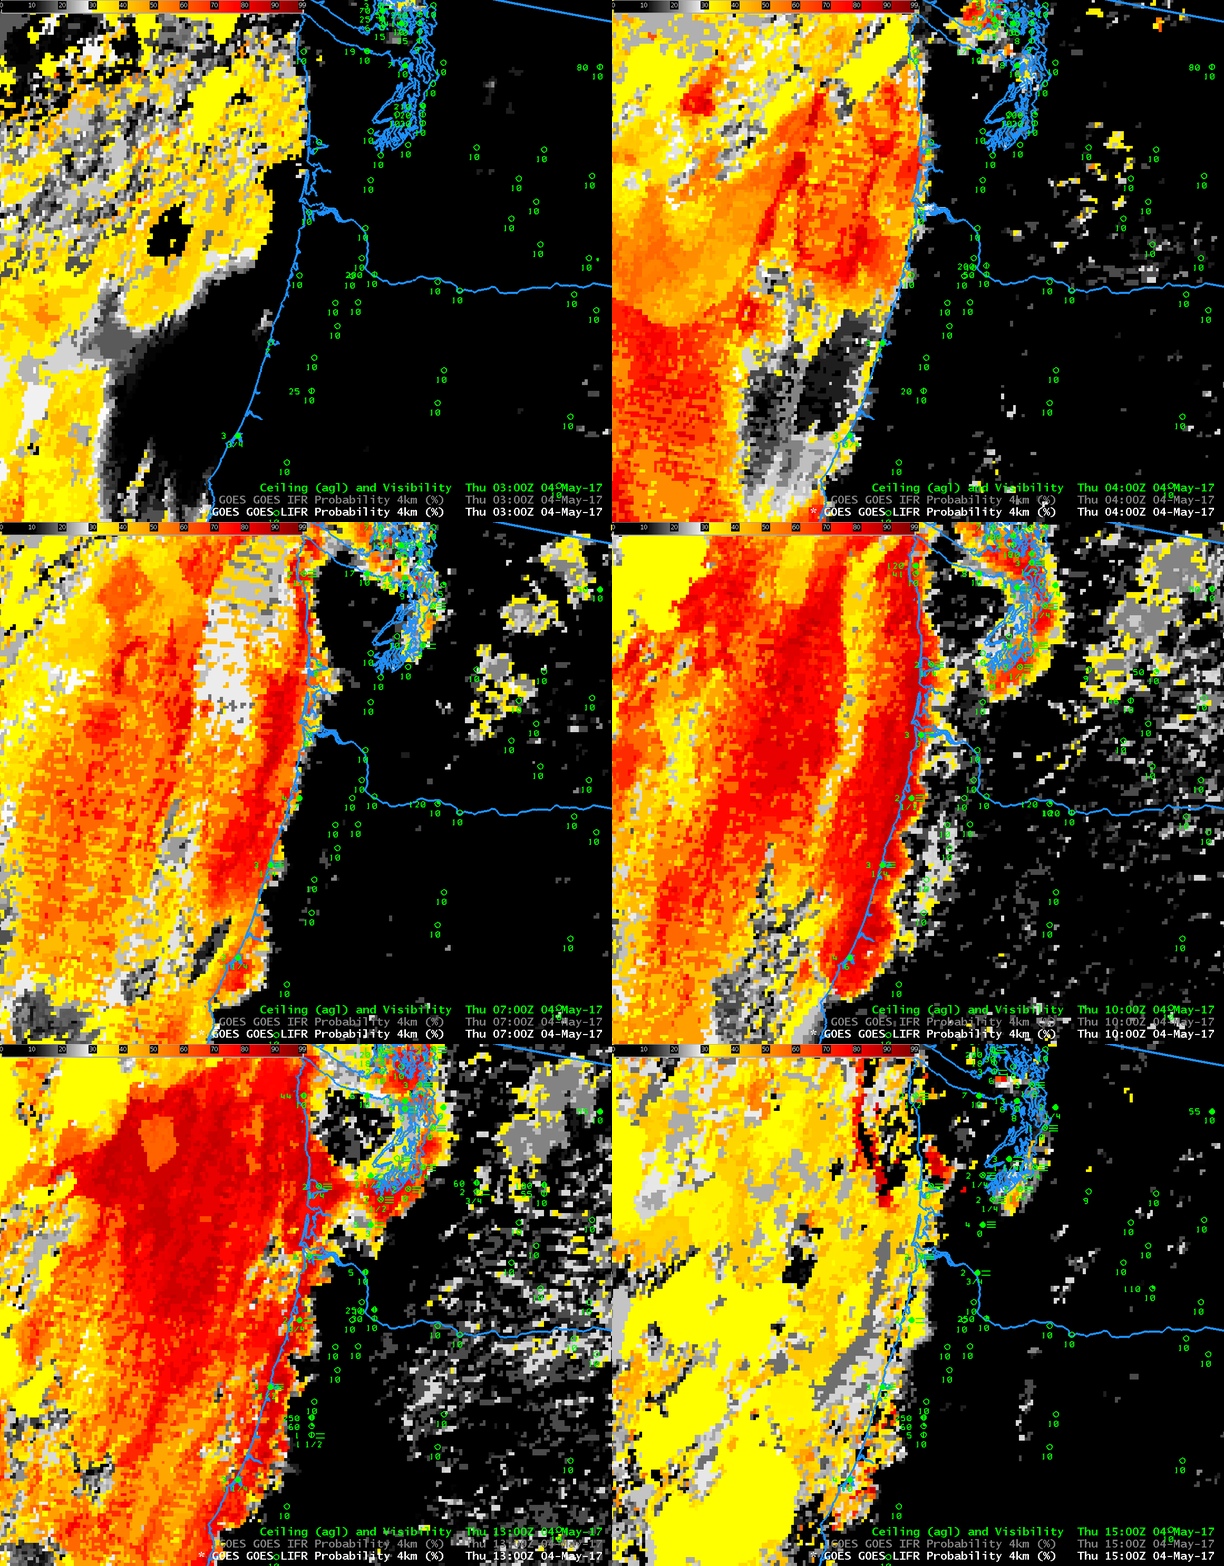
GOES-R IFR Probability fields, hourly from 0300 through 1500 UTC on 4 May 2017 (Click to enlarge)

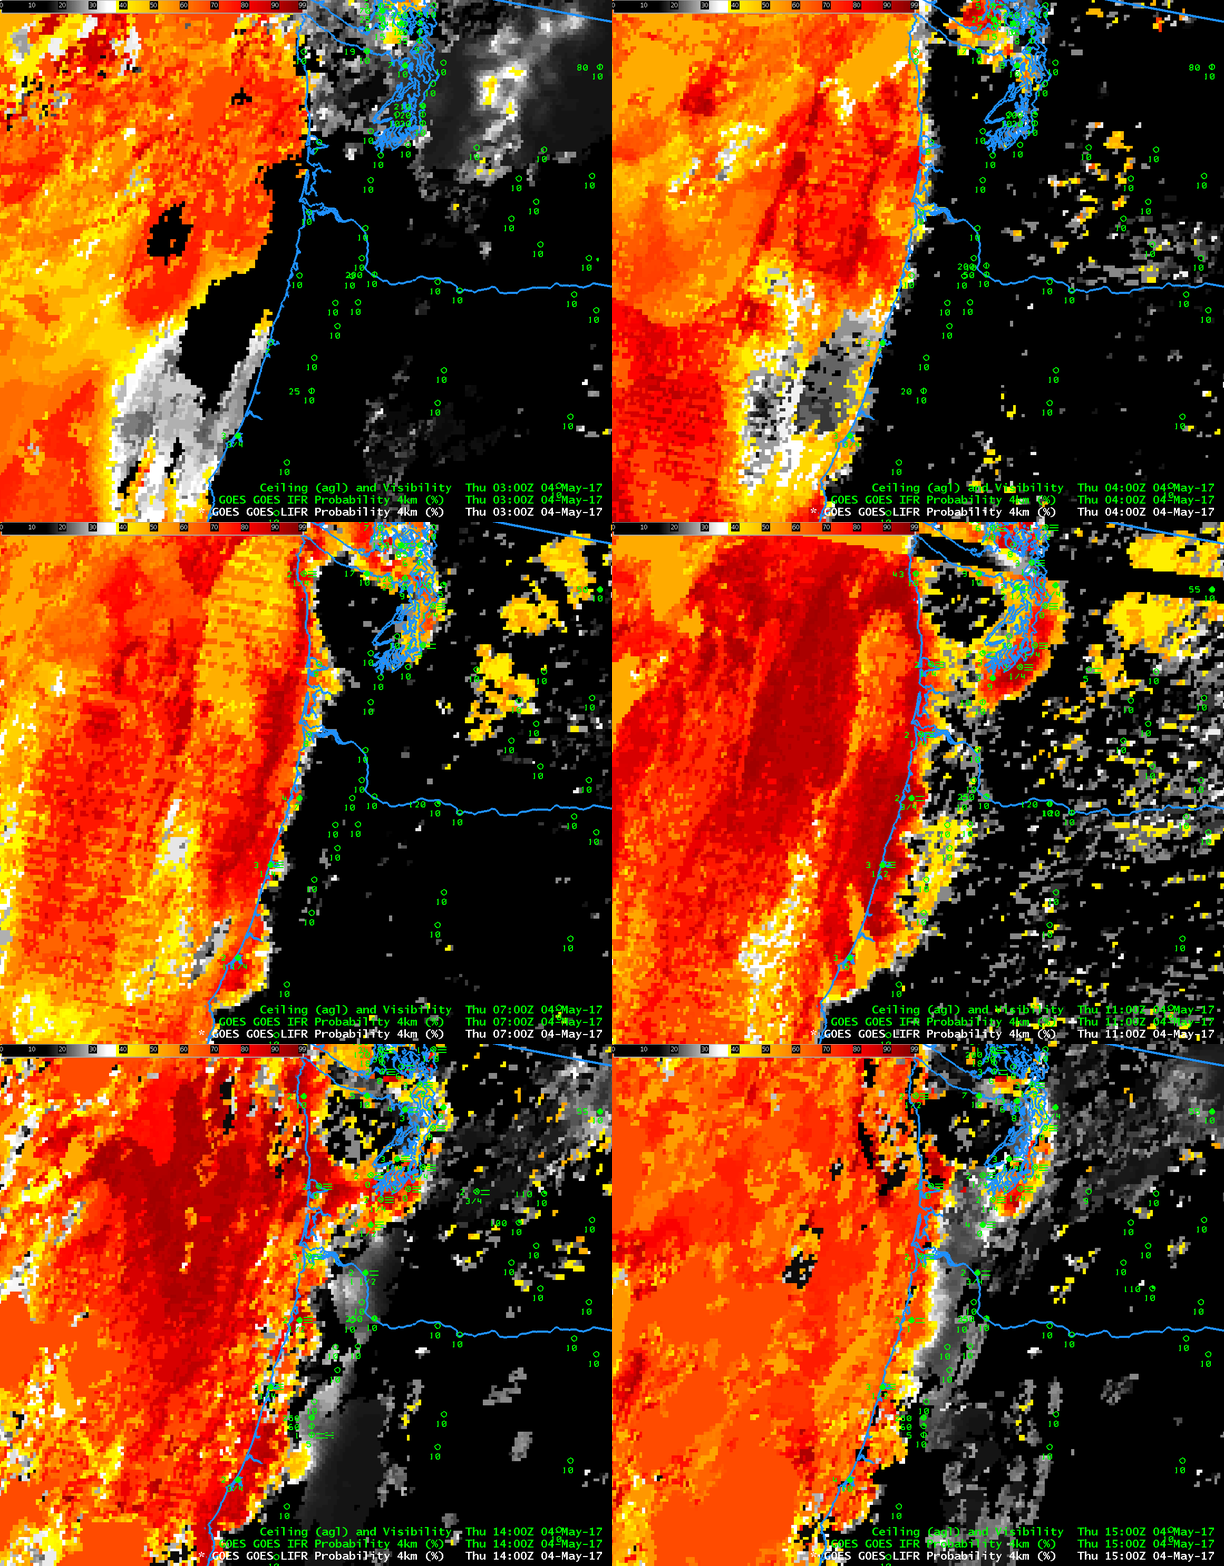
GOES-R Low IFR Probability fields, hourly from 0300 through 1500 UTC on 4 May 2017 (Click to enlarge)

Note: GOES-R IFR Probabilities are computed using Legacy GOES (GOES-13 and GOES-15) and Rapid Refresh model information; GOES-16 data will be incorporated into the IFR Probability algorithm in late 2017.

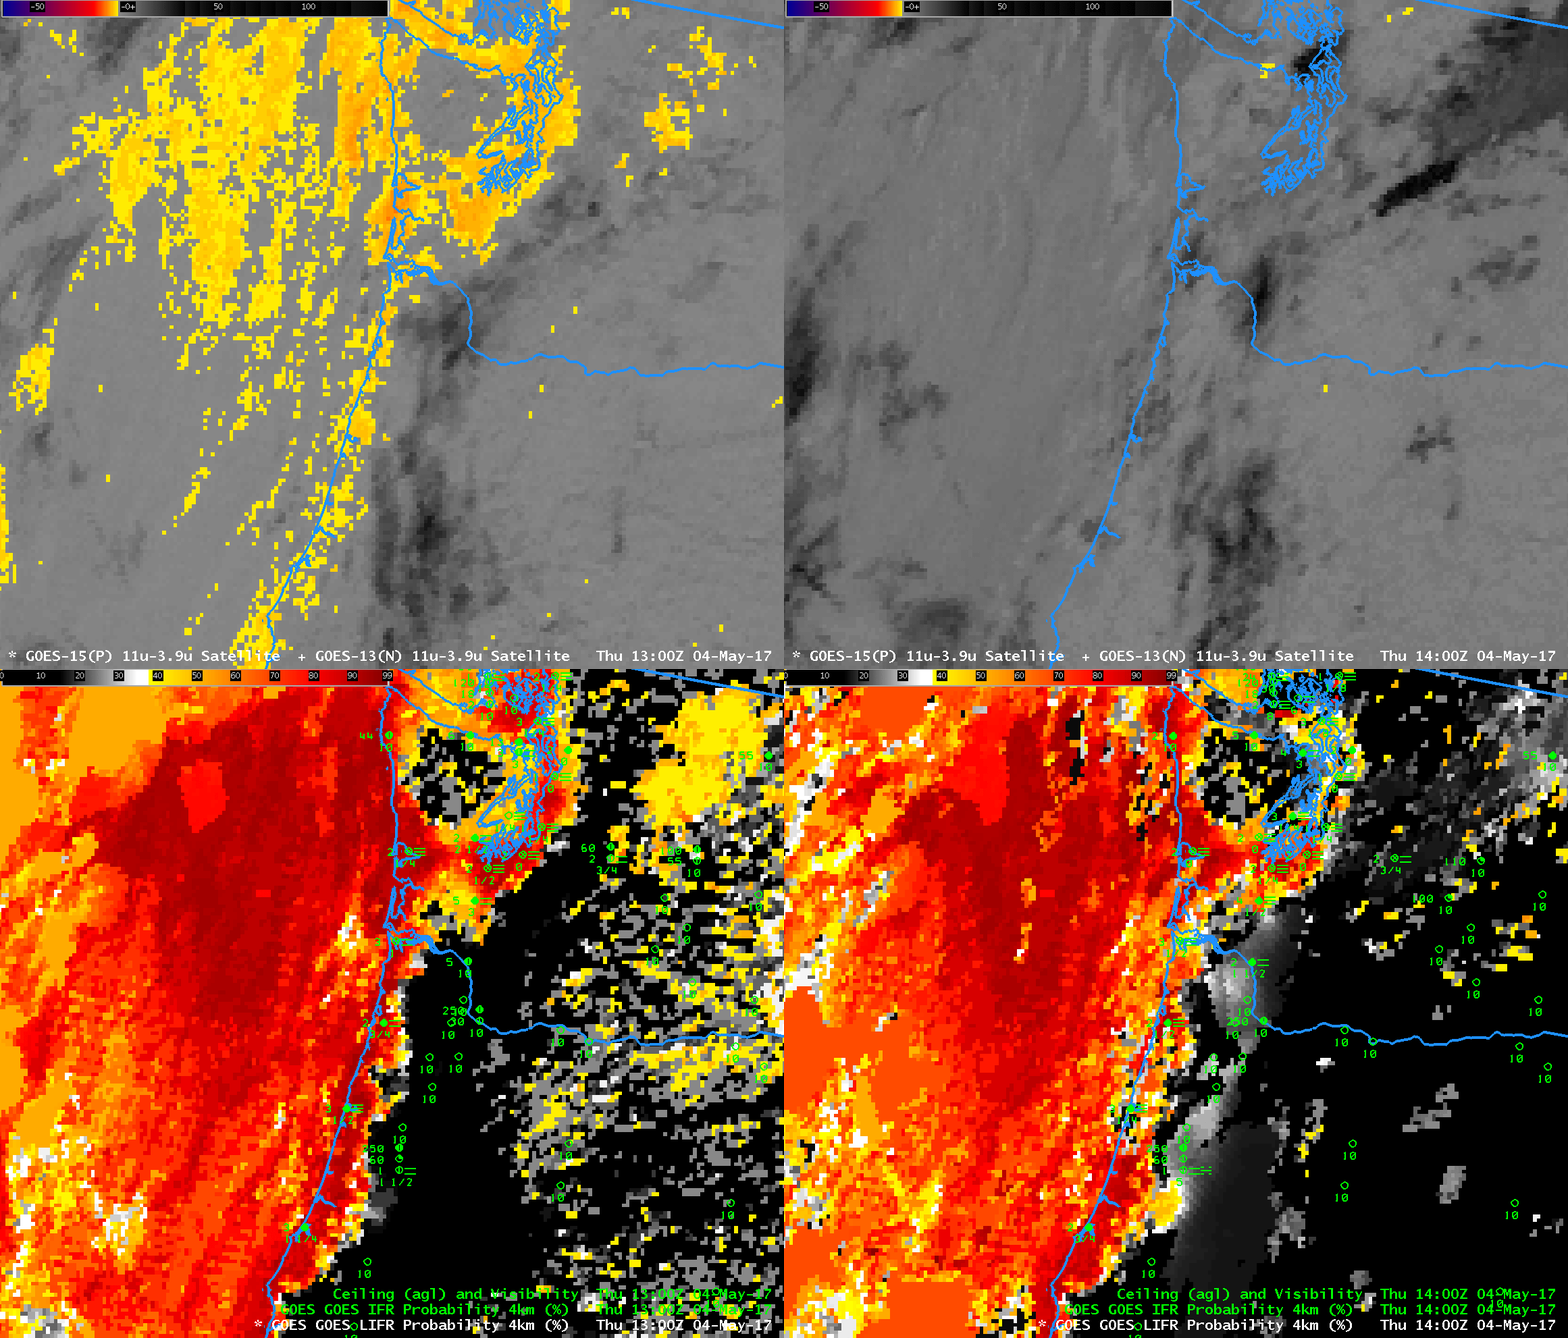
Dense fog with IFR and Low IFR Conditions occurred along the Oregon and Washington Coasts early on 4 May 2017. The animations above show the evolution of IFR Probability and Low IFR Probability. Note that IFR Conditions/Low IFR Conditions mostly occurred where Probabilities were high, with a few exceptions (KSMP, Stampede Pass, WA; KKLS, Kelso WA at 1400 UTC). Both IFR and Low IFR Probabilities show a general areal increased between 0800 and 0900; this can be traced to a big increase in the brightness temperature difference that occurred between 0845 and 0900 UTC (shown here) that is likely due to stray light intruding into the satellite detectors. (Brightness Temperature Difference values decreased after 0900 UTC — note that the Brightness Temperature Difference enhancement has color starting when ‘counts’ in the image reach -6).

Low IFR Probabilities do a particularly good job above of outlining the regions of visibility and ceiling restrictions along the coasts of Oregon and of Puget Sound.  Note also that a strip of missing satellite data exists at 1100 UTC over northern Washington.  When satellite data are missing completely, IFR Probabilities are not computed.

A difficulty in using Brightness Temperature Difference fields is shown below. The 1300 and 1400 UTC Brightness Temperature Difference fields show an apparent decrease in low clouds detected as the sun rises (in reality, the amount of reflected 3.9 radiation is increasing as the Sun rises). Fog persists through sunrise as shown in the observations; IFR Probabilities (and Low IFR Probabilities) maintain a signal throughout sunrise.

GOES-15 Brightness Temperature Difference (3.9 µm – 10.7 µm) at 1300 and 1400 UTC on 4 May 2017 followed by GOES-R IFR Probability fields at 1300 and 1400 UTC on 4 May 2017 (Click to enlarge)