Monthly Archives: August 2016

Fog over northeast Colorado backs into Denver International

GOES_R_IFRP_31August2016-50

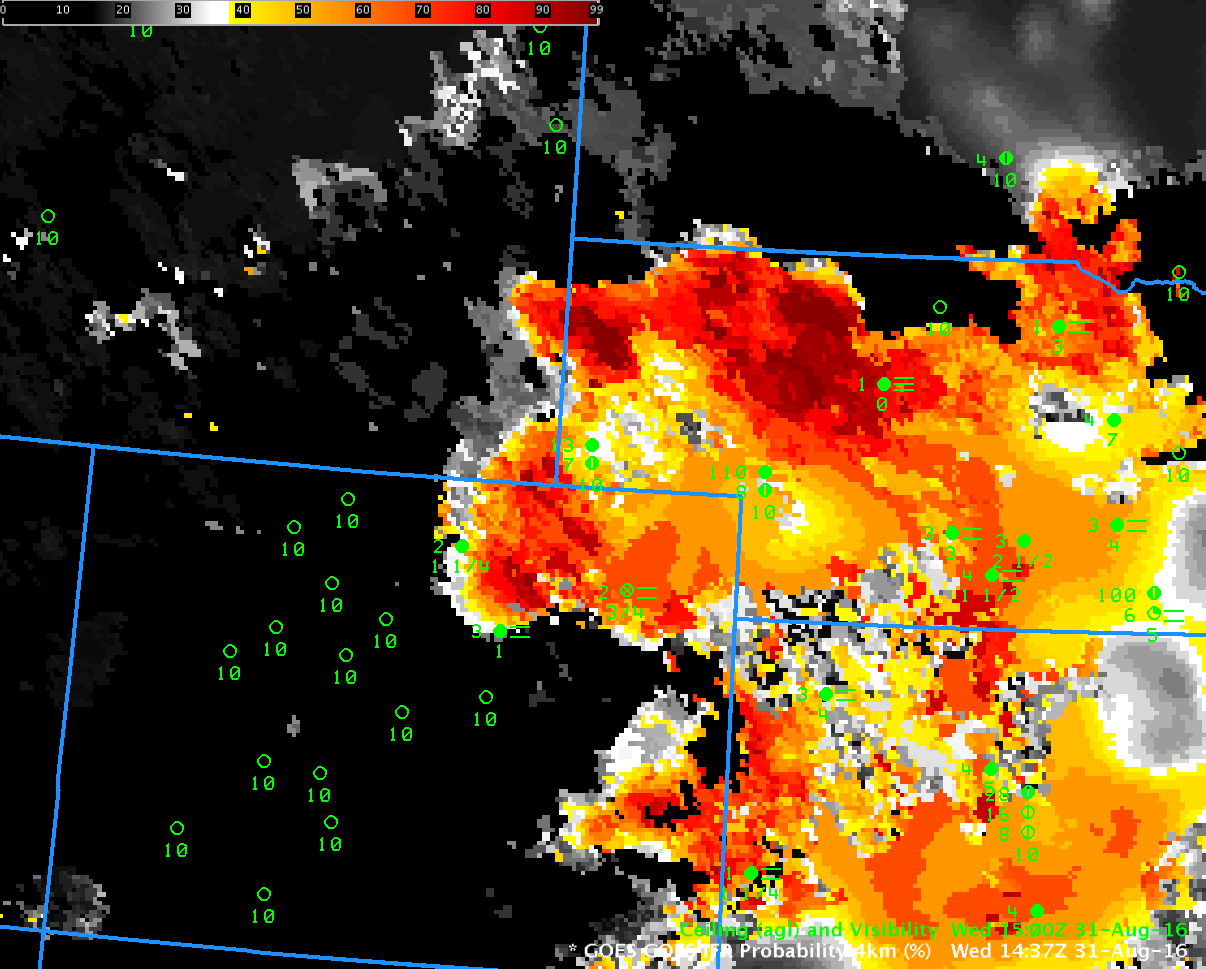
GOES-R IFR Probability Fields, 1437 UTC on 31 August 2016, with surface observations of ceilings and visibilities (Click to enlarge)

GOES-R IFR Probability Fields over Colorado and Nebraska on the morning of 31 August 2016 show high IFR Probabilities in close proximity to Denver International Airport (DIA), which airport was reporting IFR conditions starting at 1237 UTC. Webcams to the southwest and northeast of the airport shortly after 1500 UTC confirm that the IFR conditions’ edge was very near the airport.

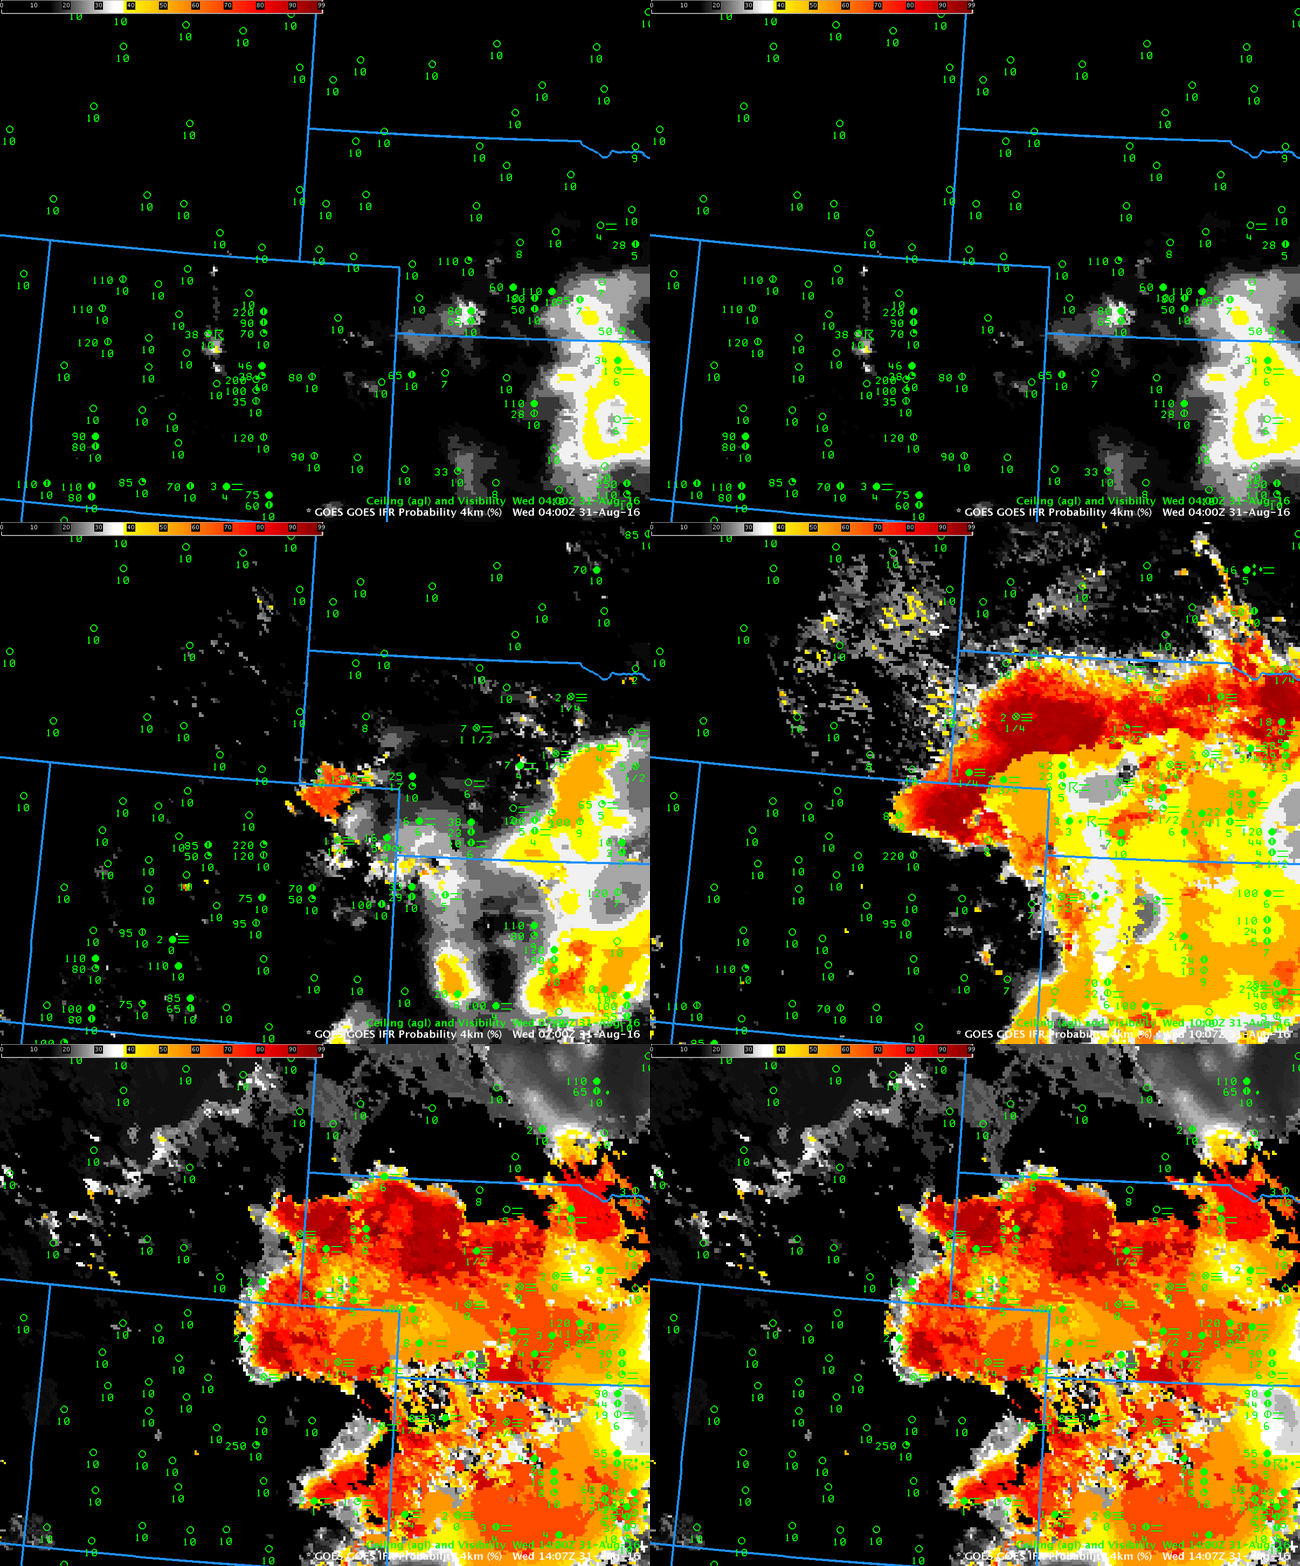
The hourly animation of GOES-R IFR Probability fields, below, shows the evolution of the field. Its motion could be used in a prognostic manner.

GOES_R_IFRP_31August2016anim_0400_1400

GOES-R IFR Probability fields, ~hourly from 0400 through 1400 UTC on 31 August 2016 (Click to enlarge). Surface observations of ceilings and visibility are also plotted.

A similar event occurred on 22 September, see below from Mike Eckert and Amanda Terborg.09222016-den_fog

Fog under High Clouds

FourPanel_1045UTC_18August2016

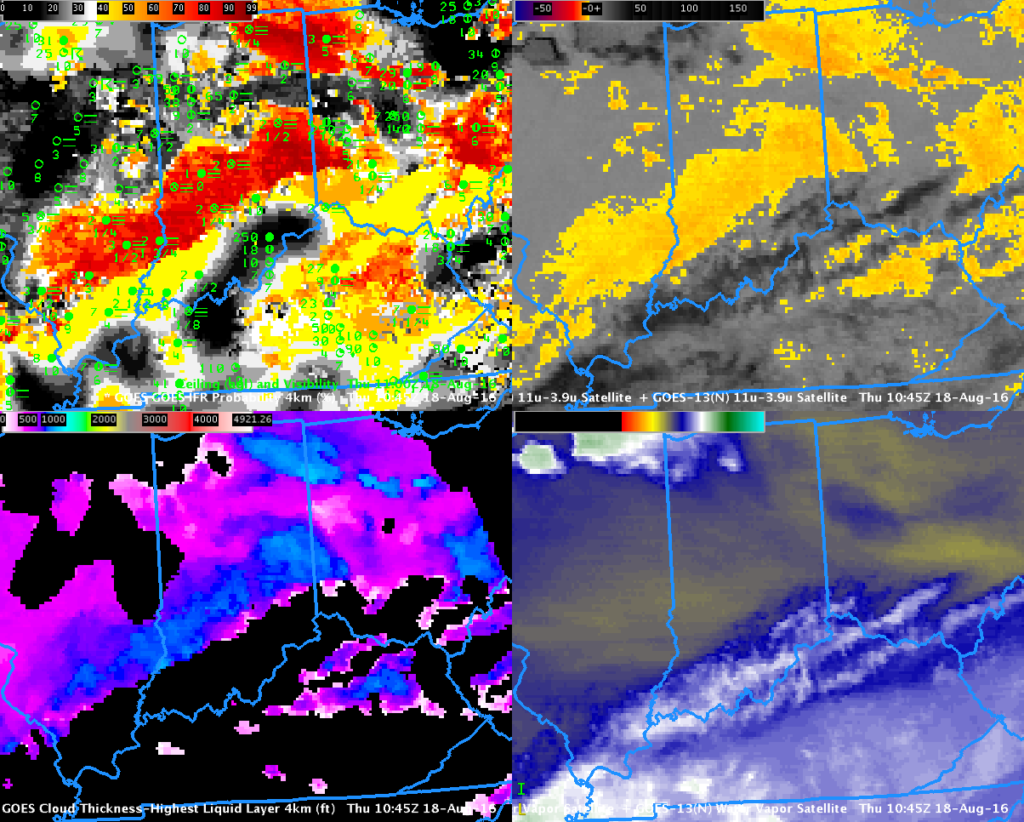
GOES-R IFR Probability Fields (Upper left), GOES-East Brightness Temperature Difference (3.9 – 10.7) (Upper Right), GOES-R Cloud Thickness (Lower Left) and GOES-East Water Vapor imagery (Lower Right), all at 1045 UTC on 18 August 2016. Surface observations of ceilings and visibilities at 1100 UTC are included in the upper right (Click to enlarge)

Dense Fog developed over southern Indiana on the morning of August 18 (and advisories were hoisted).  The single image above demonstrates an advantage of GOES-R IFR Probability fields in determining the areal extent of fog:  the traditional method of night-time fog detection from satellite fails in regions where cirrus clouds obscure the view of low clouds.  That was the case over the Ohio River Valley where IFR conditions were occurring.  GOES-R IFR Probability fields have a signal where high clouds exist in regions where Rapid Refresh model output shows low-level saturation, as over southwestern Indiana.  Because satellite data cannot be used there to compute IFR Probabilities, the magnitude of the probability is smaller.  Tailor your interpretation of the IFR Values based on the presence of high clouds.  The presence of high clouds changes the character of the IFR Probability field, from a pixelated field where satellite data are present to a flatter field where only model data can be used.

GOES-R Cloud Thickness can be used to estimate fog dissipation time (using this scatterplot, where the thickness values are from the last pre-sunrise scene).  That field, however, is only produced where the satellite has an unimpeded view of the low clouds (therefore, where cirrus clouds are present, as over the Ohio River Valley, Cloud Thickness is not produced).   Note the line parallel to the terminator over eastern Ohio:  GOES-R Cloud Thickness is not produced during twilight times around sunrise or sunset.  This 1045 UTC image is the final one over Indiana before sunrise.  Maximum thickness values are just over 1000 feet over southwest Indiana, suggesting a dissipation time of about three hours, that is, around 1345 UTC.

Changes in Model Fields show up in IFR Probability

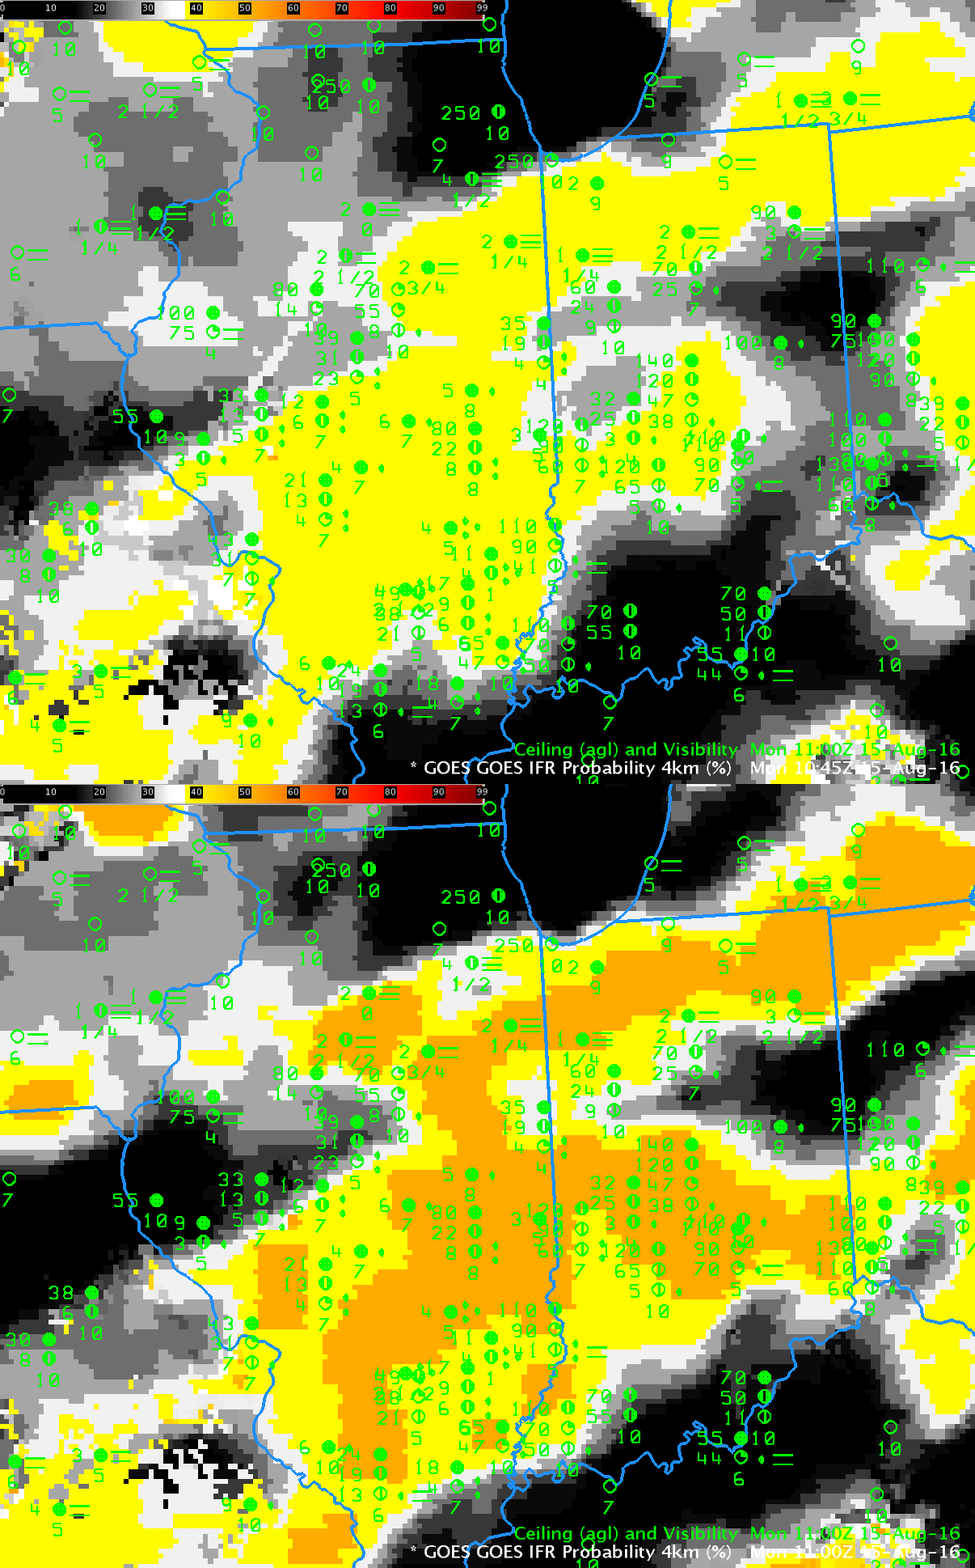
GOES-R_IFR_1045_1100UTC_15August2016toggle

When GOES-R IFR Probability fields are governed solely by Rapid Refresh model output because of thick cloudiness (as was the case over Illinois on 15 August 2016), there can be changes in the field at the top of the hour that are related to changes in the Rapid Refresh model output — that is, changes in which hour Rapid Refresh Model is used.  The toggle above shows the IFR Probability fields at 1045 UTC and 1100 UTC on 15 August.  Both fields are characterized by smooth values that come with IFR Probability that is driven by Rapid Refresh model output, output that is smooth and not pixelated like satellite data.  It’s pretty noticeable, however, that values increase (from ~39% to ~52%) in those 15 minutes.  Why?

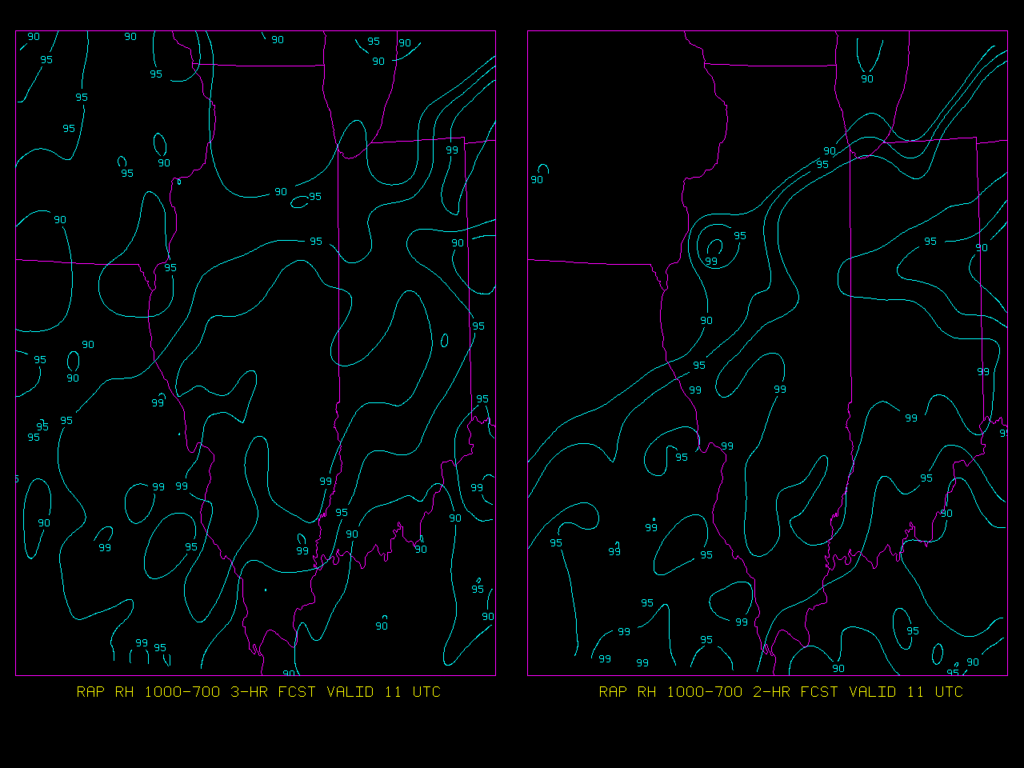
The image below shows Rapid Refresh Model Predictions of 1000-700 mb Relative Humidity at 1100 UTC from the 0800 UTC model run (that is, a 3-hour forecast, left) and from the 0900 UTC model run (that is, a 2-hour forecast, right).  Relative Humidity Values from the 0800 UTC Run (interpolated to 1045) are used in the computation of IFR Probabilities at 1045 UTC;  values from the 0900 UTC Run are used in the computation of IFR Probabilities at 1100 UTC.  It’s not this relative humidity field (value from 1000-700 hPa) precisely that is used, but rather maximum values in the vertical.  Certainly there are changes in the predicted low-level relative humidity field at 1100 UTC between the sequential model runs;  it’s more likely that saturation is occurring in the later model run, and that greater likelihood of saturation is reflected in the change of IFR Probability from 1045 UTC (when 0800 UTC Rapid Refresh Model fields are used) to 1100 UTC (when 0900 UTC Rapid Refresh Model fields are used).

RAP_RH_11UTC_15AUG2016

Rapid Refresh model predictions of 1000-700 mb Relative Humidity; 3-hour forecast from the 0800 UTC Rapid Refresh Model (left) and 2-hour forecast from the 0900 UTC Rapid Refresh Model (Right), both from 15 August 2016 (Click to enlarge)

IFR Probabilities and SRSO-R Visible Imagery over Nebraska

GOES_R_IFRP_09August_06_14anim

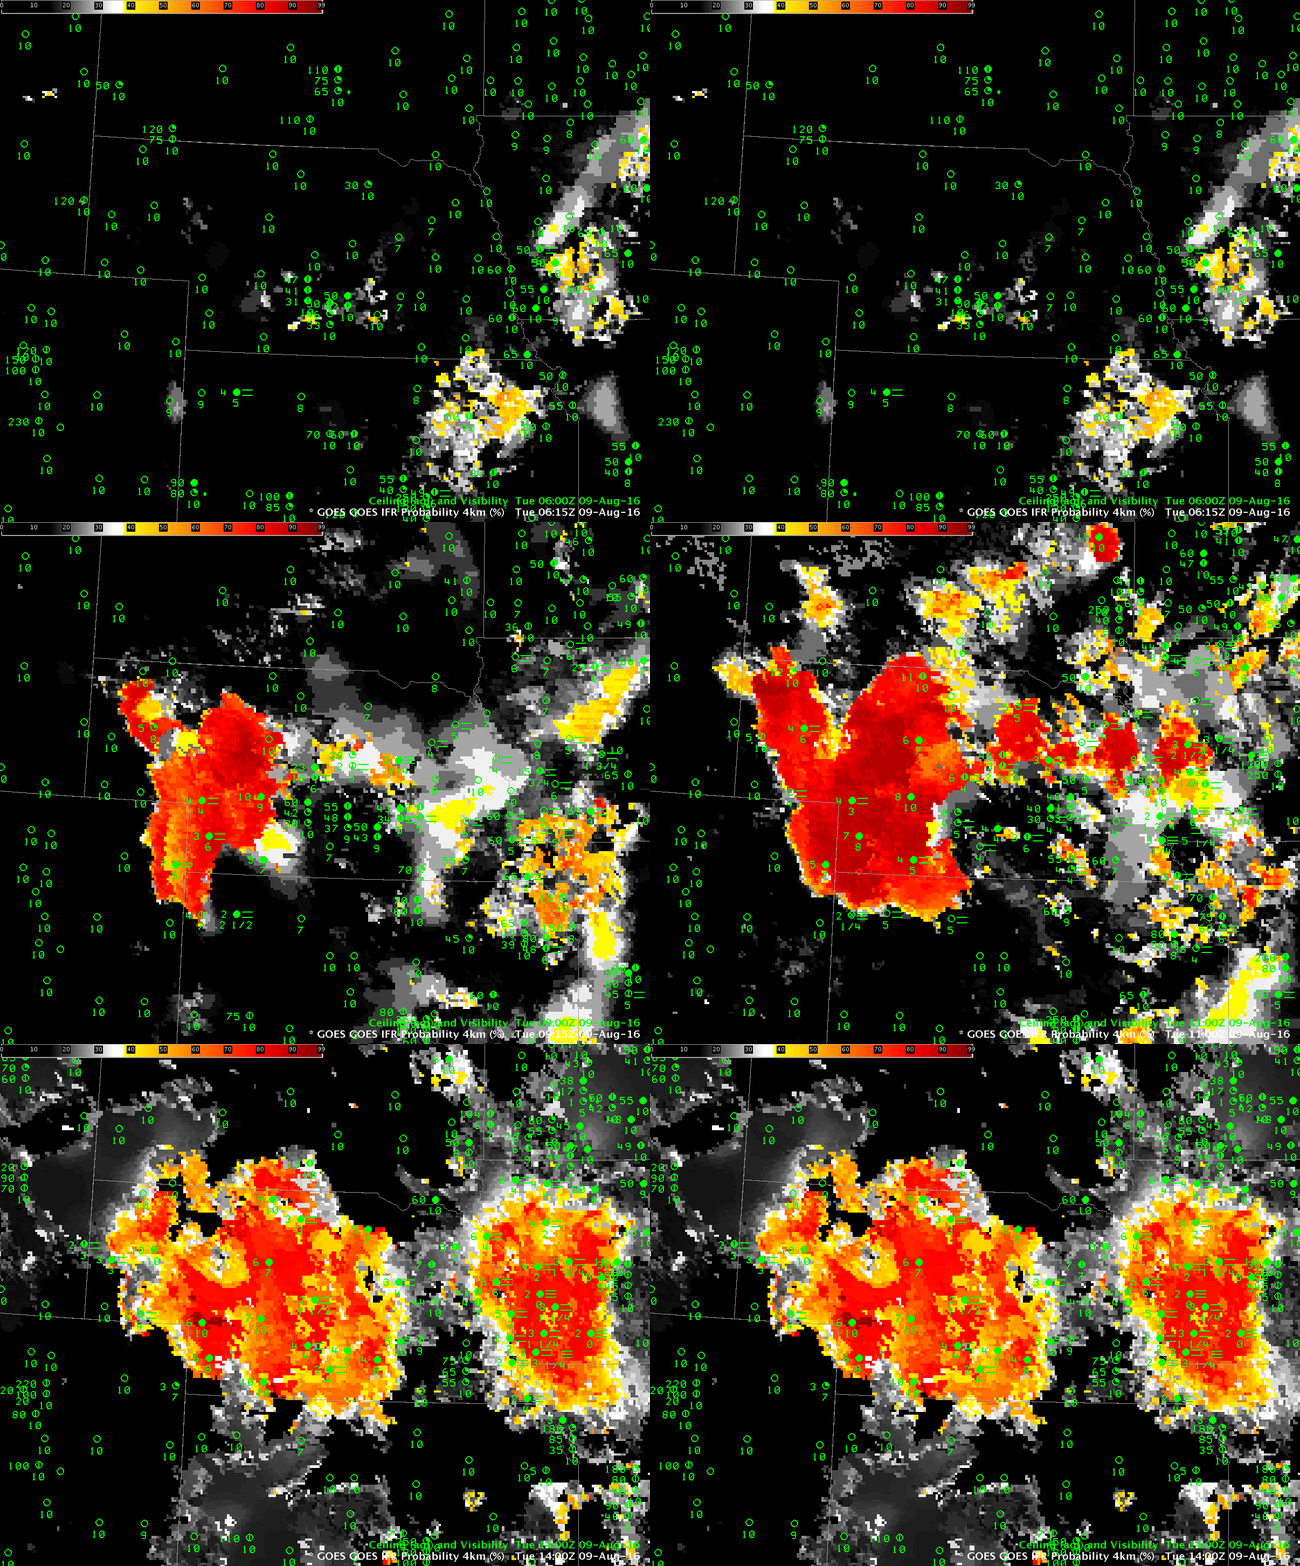
GOES-R IFR Probability, hourly from 0600 through 1400 UTC on 9 August 2016 [Click to enlarge]

GOES-R IFR Probabilities show the development of IFR-producing stratus and fog over central and western Nebraska between midnight and dawn on 9 August 2016. The character of the field suggests that satellite data and Rapid Refresh Model output are both contributing to IFR Probability fields; IFR Probability fields will look far flatter in appearance (just one color) when model fields only are used.

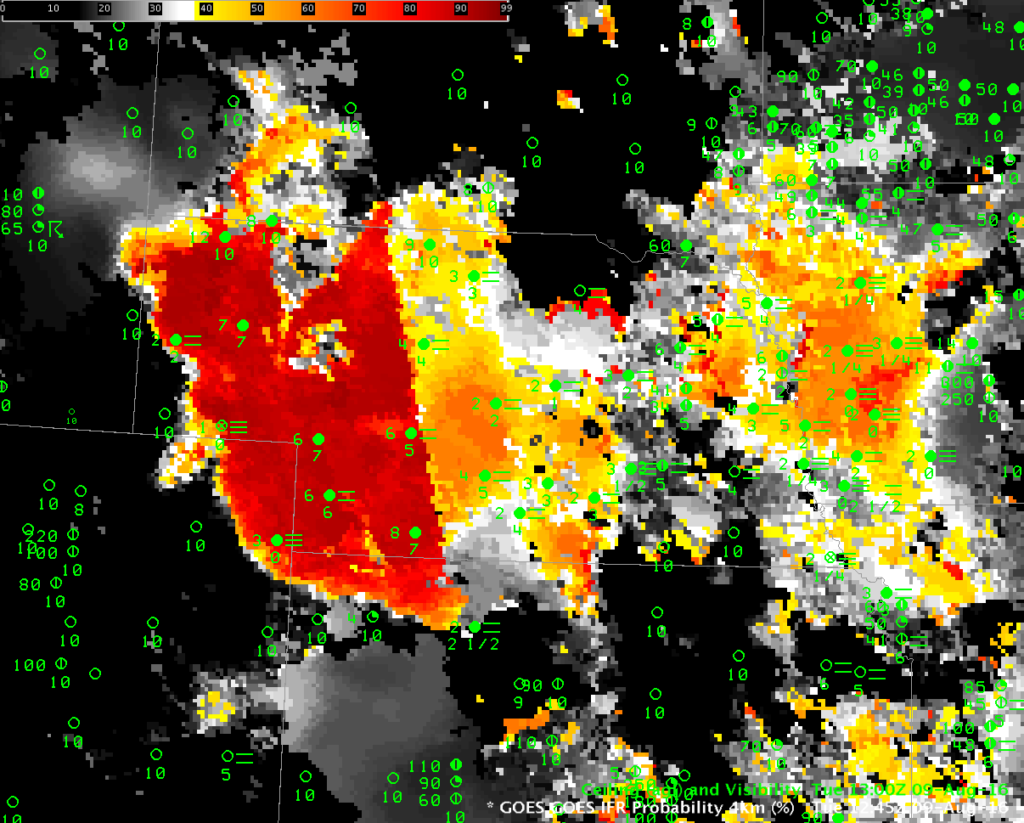
When the Sun rises, the predictors that are used to compute IFR Probabilities change, and that change is evident in the 1245 UTC image below.  Night-time predictors are being used to the west of the obvious boundary through central Nebraska, and day-time predictors are being used to the east.  It’s more common for IFR Probability values to increase when Day-Time predictors are used, but on 9 August values decreased.  (You can see from the animation above that the IFR Probability values subsequently rebounded)
GOES_R_IFRP_09August-34

GOES-R IFR Probability at 1245 UTC on 9 August 2016 [Click to enlarge]

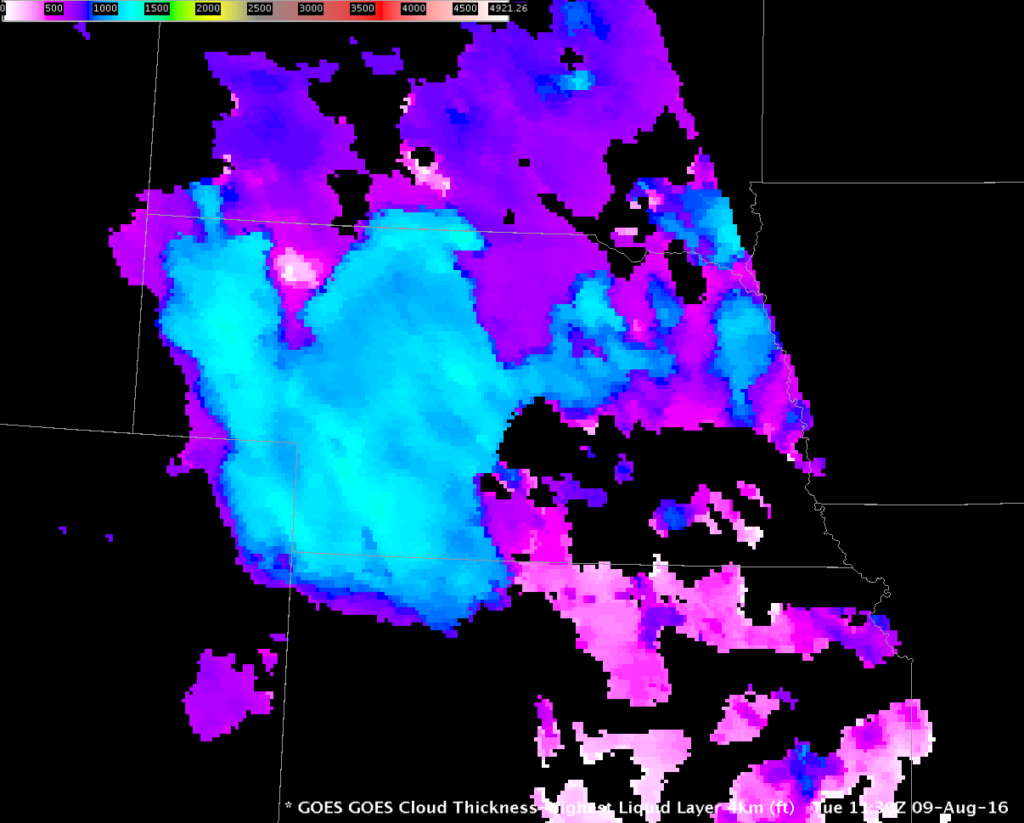
GOES-R Cloud Thickness can be used to estimate when fog/low stratus will dissipate (using this scatterplot).   The image below shows the last Cloud Thickness before twilight conditions (during twilight conditions, GOES-R Cloud Thickness is not computed — over Nebraska at this time of year, that’s generally about 2 hours starting around 1145 UTC).  The largest values are around 1280 feet, which corresponds to a dissipation time of more than four hours, meaning the fog/low clouds should persist to at least 1530 UTC!
GOES_R_CloudThickness_1130UTC_09August2016

GOES-R Cloud Thickness just before Twilight Conditions over Nebraska, 1130 UTC on 9 August [Click to enlarge]

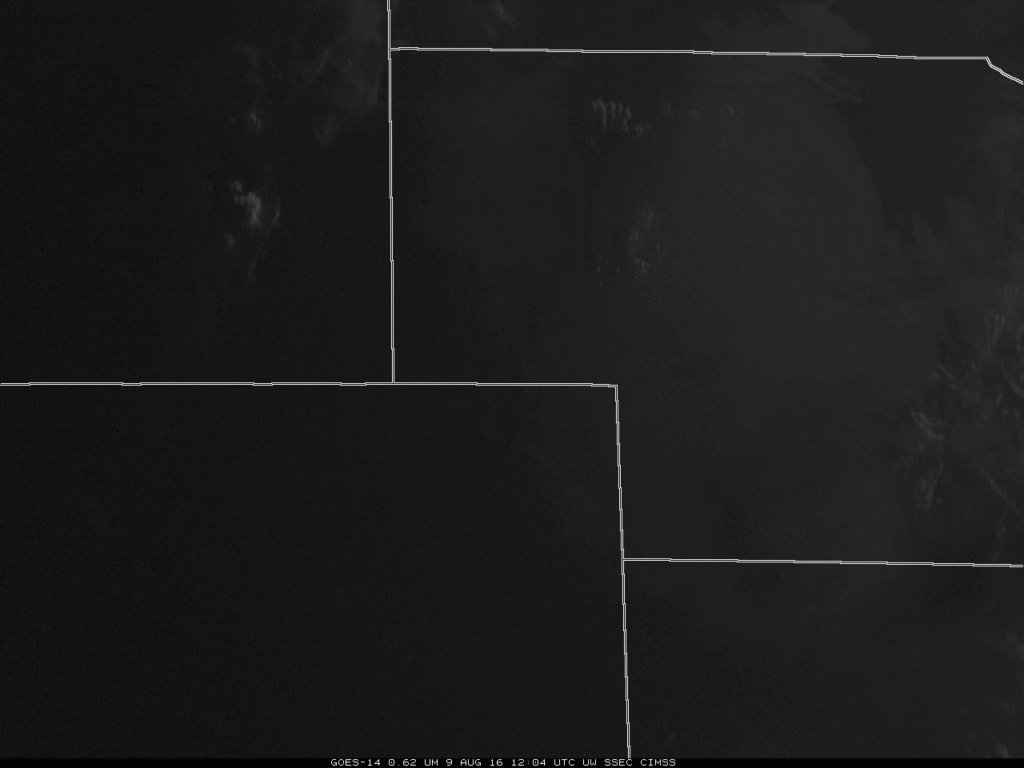
GOES-14 was observing Nebraska at 1-minute intervals on 9 August, as part of GOES-14’s SRSO-R. The animation from dawn (~1204) through 1610 UTC is below. Fog Dissipation is mostly complete by 1600 UTC.
GOES14_09AUG_VIS_1204_1610_anim

GOES-14 Visible Imagery (0.62 µm) from 1204-1610 UTC [Click to view very large animation]
IFR Probability and Aviation

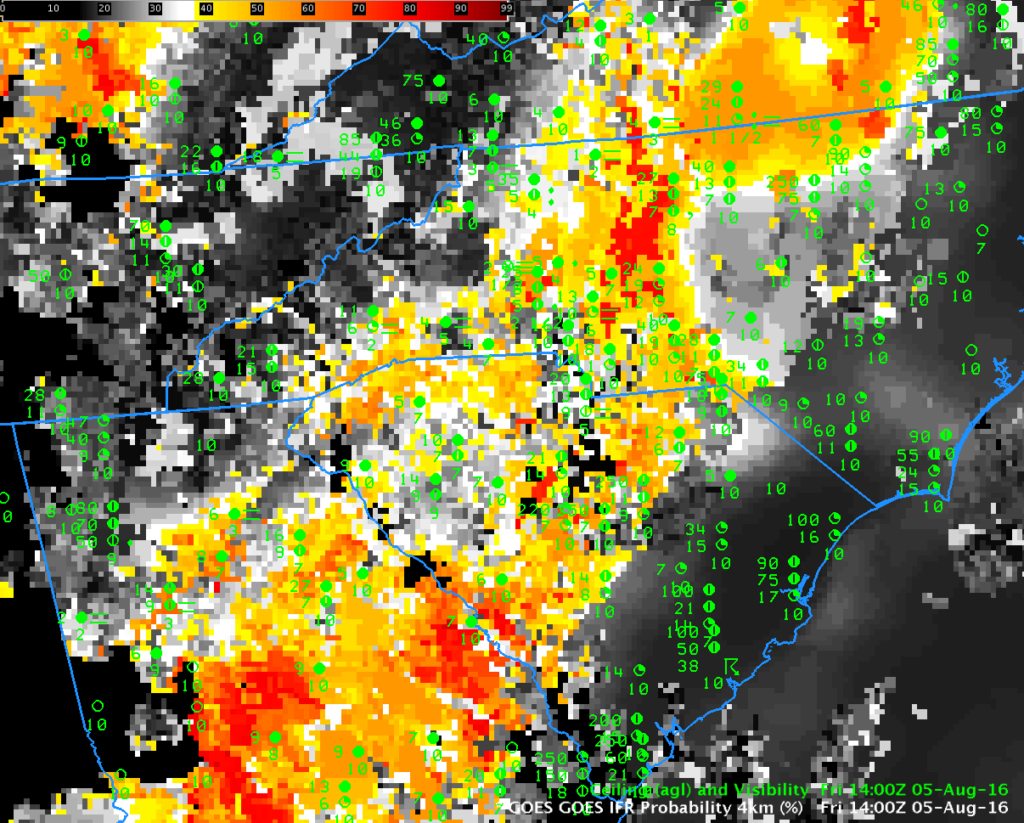
GOES_IFR_P_1400_5August2016

GOES-R IFR Probability, 1400 UTC on 5 August 2016, along with surface reports of ceilings and visibilities (Click to enlarge)

GOES-R IFR Probability describes regions where IFR Conditions are likely. For example, the IFR Probability field above, from 1400 UTC on 5 August 2016, shows high probabilities over part of the Piedmont from Virginia southwestward into Georgia.  Observations confirm that IFR Conditions (and near-IFR conditions) exist in this region of higher probabilities.

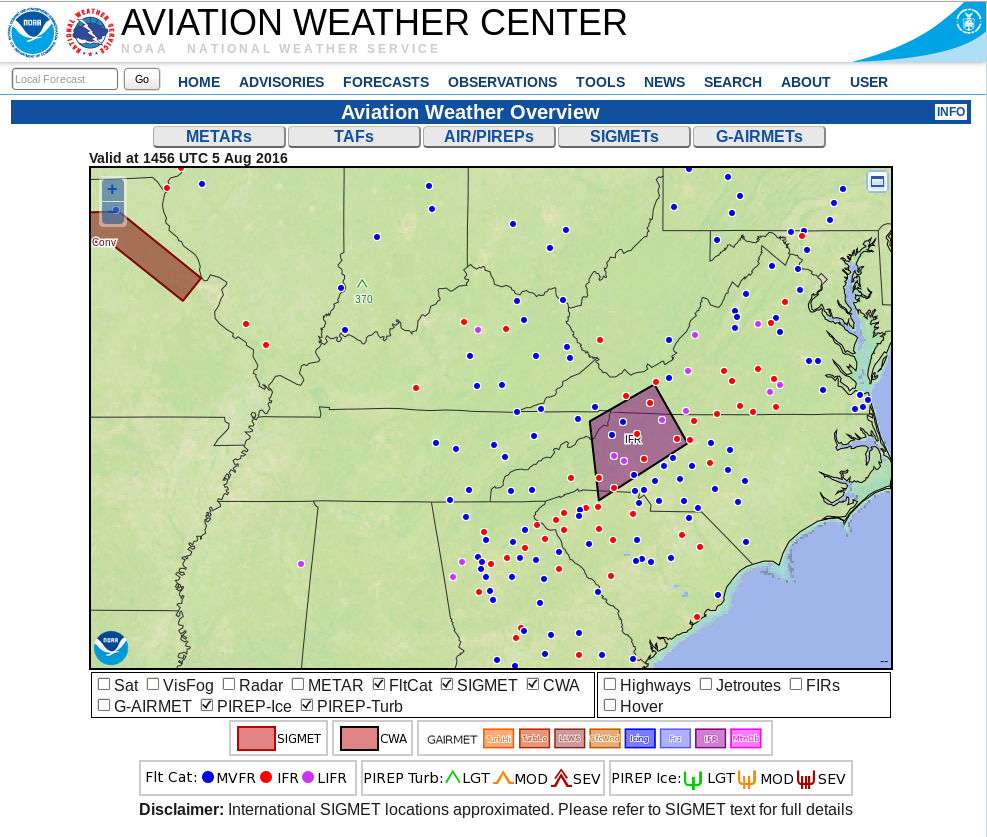
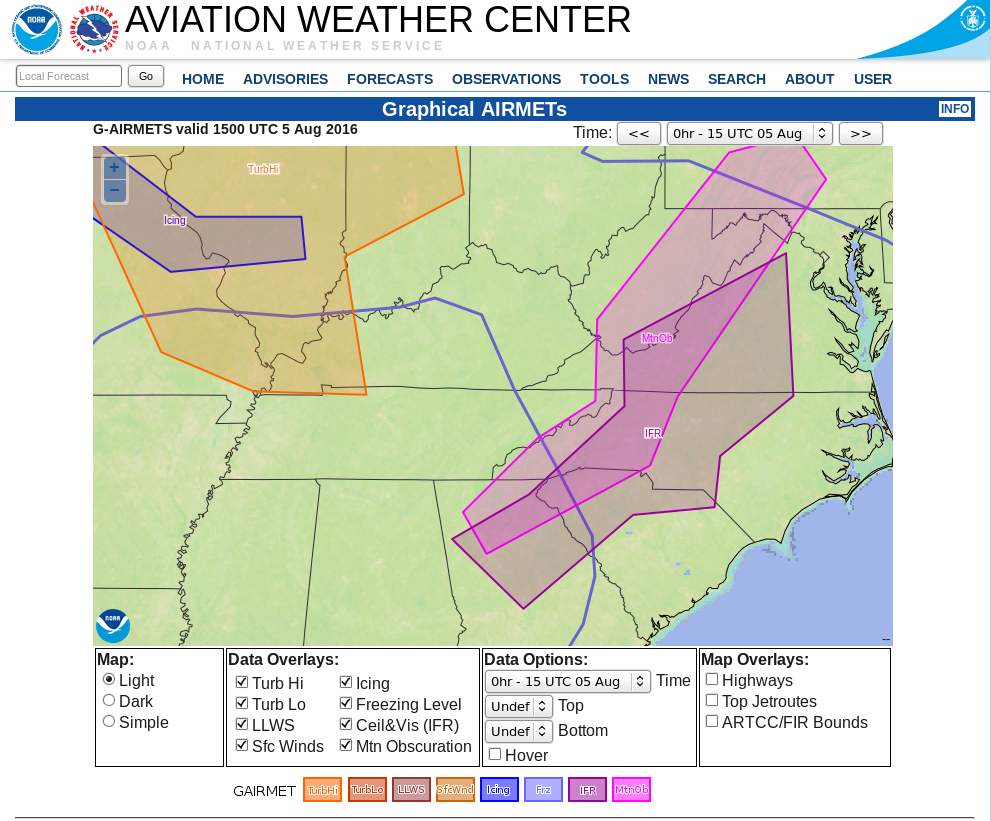
The Aviation Weather Center maintains a website with products that dovetail nicely with IFR Probability fields.  For example, the screenshot below shows stations reporting IFR Conditions (in red) and Low IFR Conditions (in magenta) ( a CWA-issued polygon on IFR conditions is included).  The overall extent of the IFR Conditions in the image above and plotted below is also roughly similar.  The G-AIRMET of IFR Conditions, bottom, also shows overlap with the IFR Probability field, as expected.

AviationScreenShot

Aviation Weather Center screenshot from 1456 UTC showing region of IFR and Low IFR Probability over the southeastern and mid-atlantic states (Click to enlarge)

AIRMETAviationScreenShot

Graphical Depiction of IFR G-AIRMET and MTN OBS (Mountaintop Obscuration) G-AIRMET at 1500 UTC on 5 August 2016 (Click to enlarge)

Maintaining a signal through sunrise

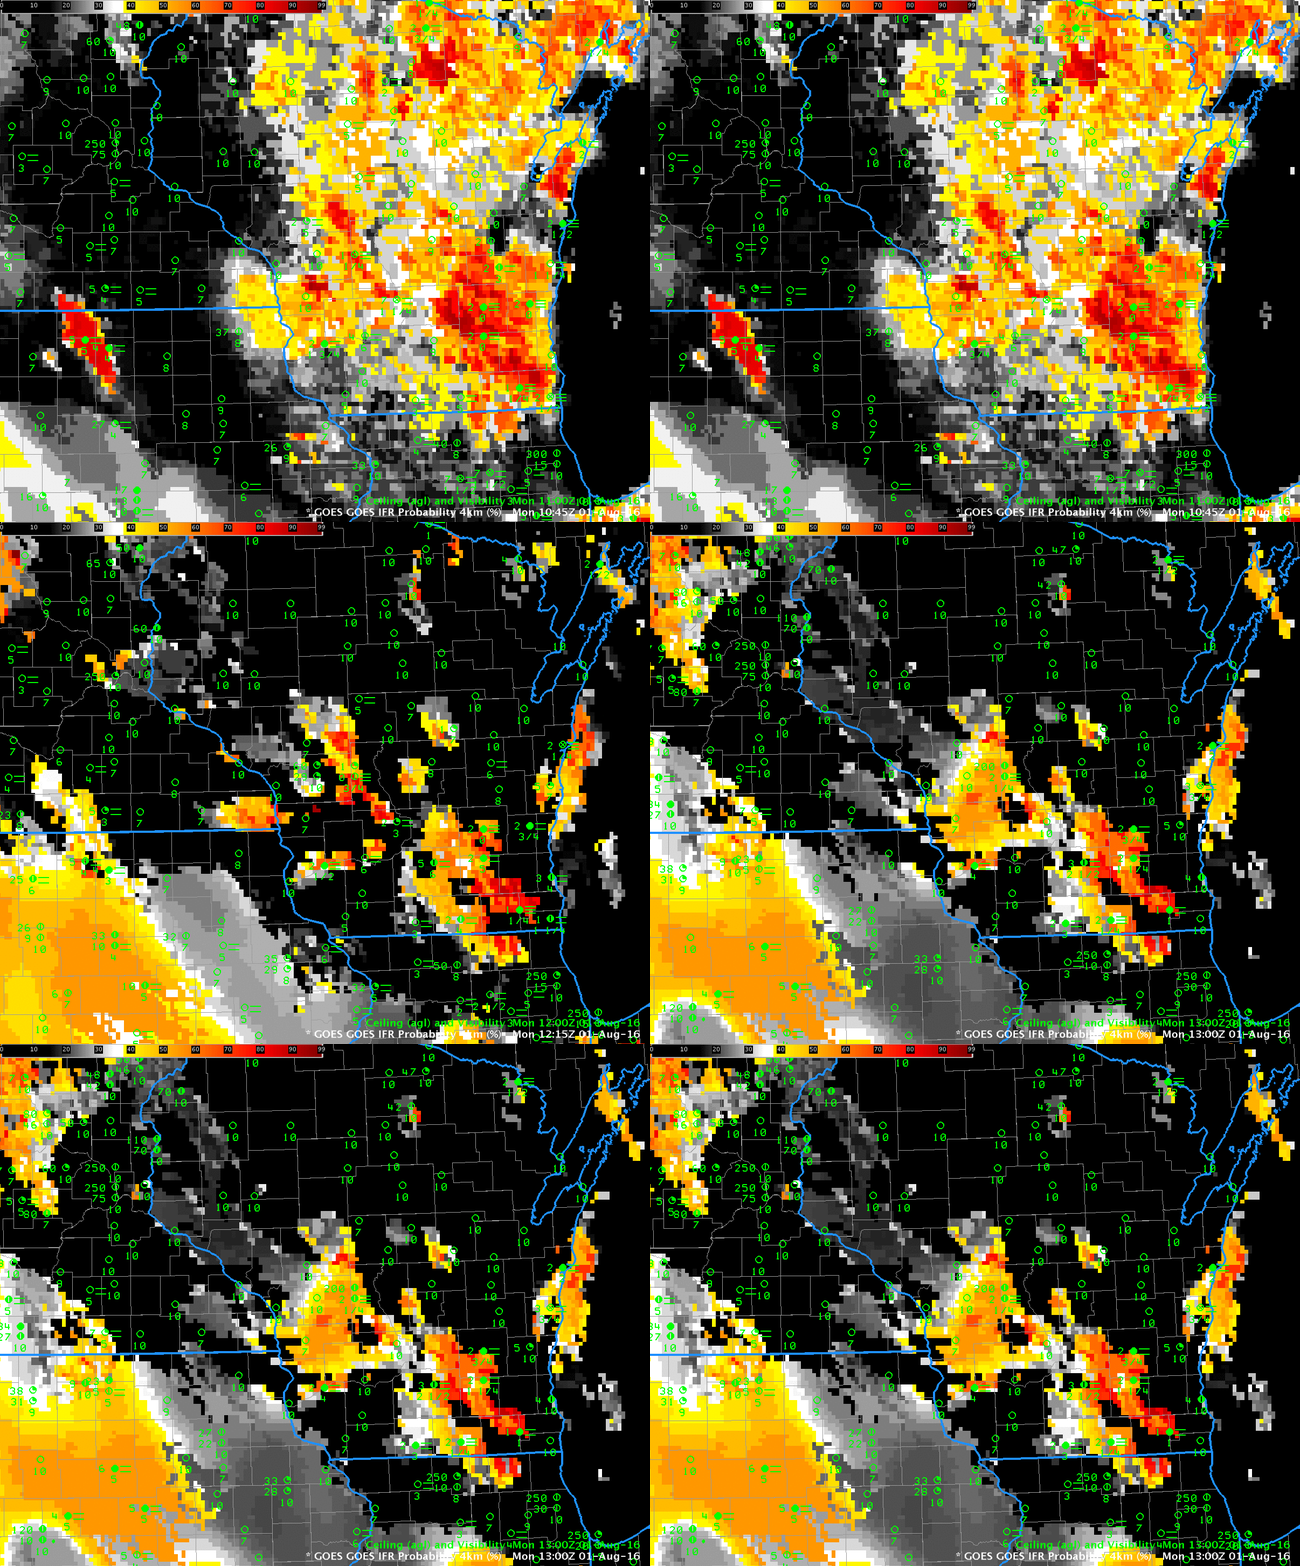
IFRProbability1045_1215_1300step

GOES-R IFR Probability fields, 1045, 1215 and 1300 UTC on 1 August 2016 (Click to enlarge)

A benefit of the GOES-R IFR Probability field is that a coherent signal is maintained through sunrise (or sunset). The traditional method of detecting fog that uses the brightness temperature difference between 10.7  µm and 3.9 µm cannot maintain a consistent signal through sunrise as the amount of reflected solar radiation with a wavelength of 3.9 µm increases, overwhelming the emissivity-driven differences between 10.7  µm and 3.9 µmbrightness temperatures that are observed at night. Consider the animation above, that shows GOES-R IFR Probability fields at 10:45 UTC, 12:15 UTC and 13:15 UTC. First: The GOES-R IFR Probability fields do a fine job of outlining where the lowest ceilings and poorest visibilities exist in this scene over Wisconsin both before sunrise and after.   The noticeable difference between the 1045 UTC and 1215 UTC fields is driven by a change in predictors that occurs as night transitions into day.

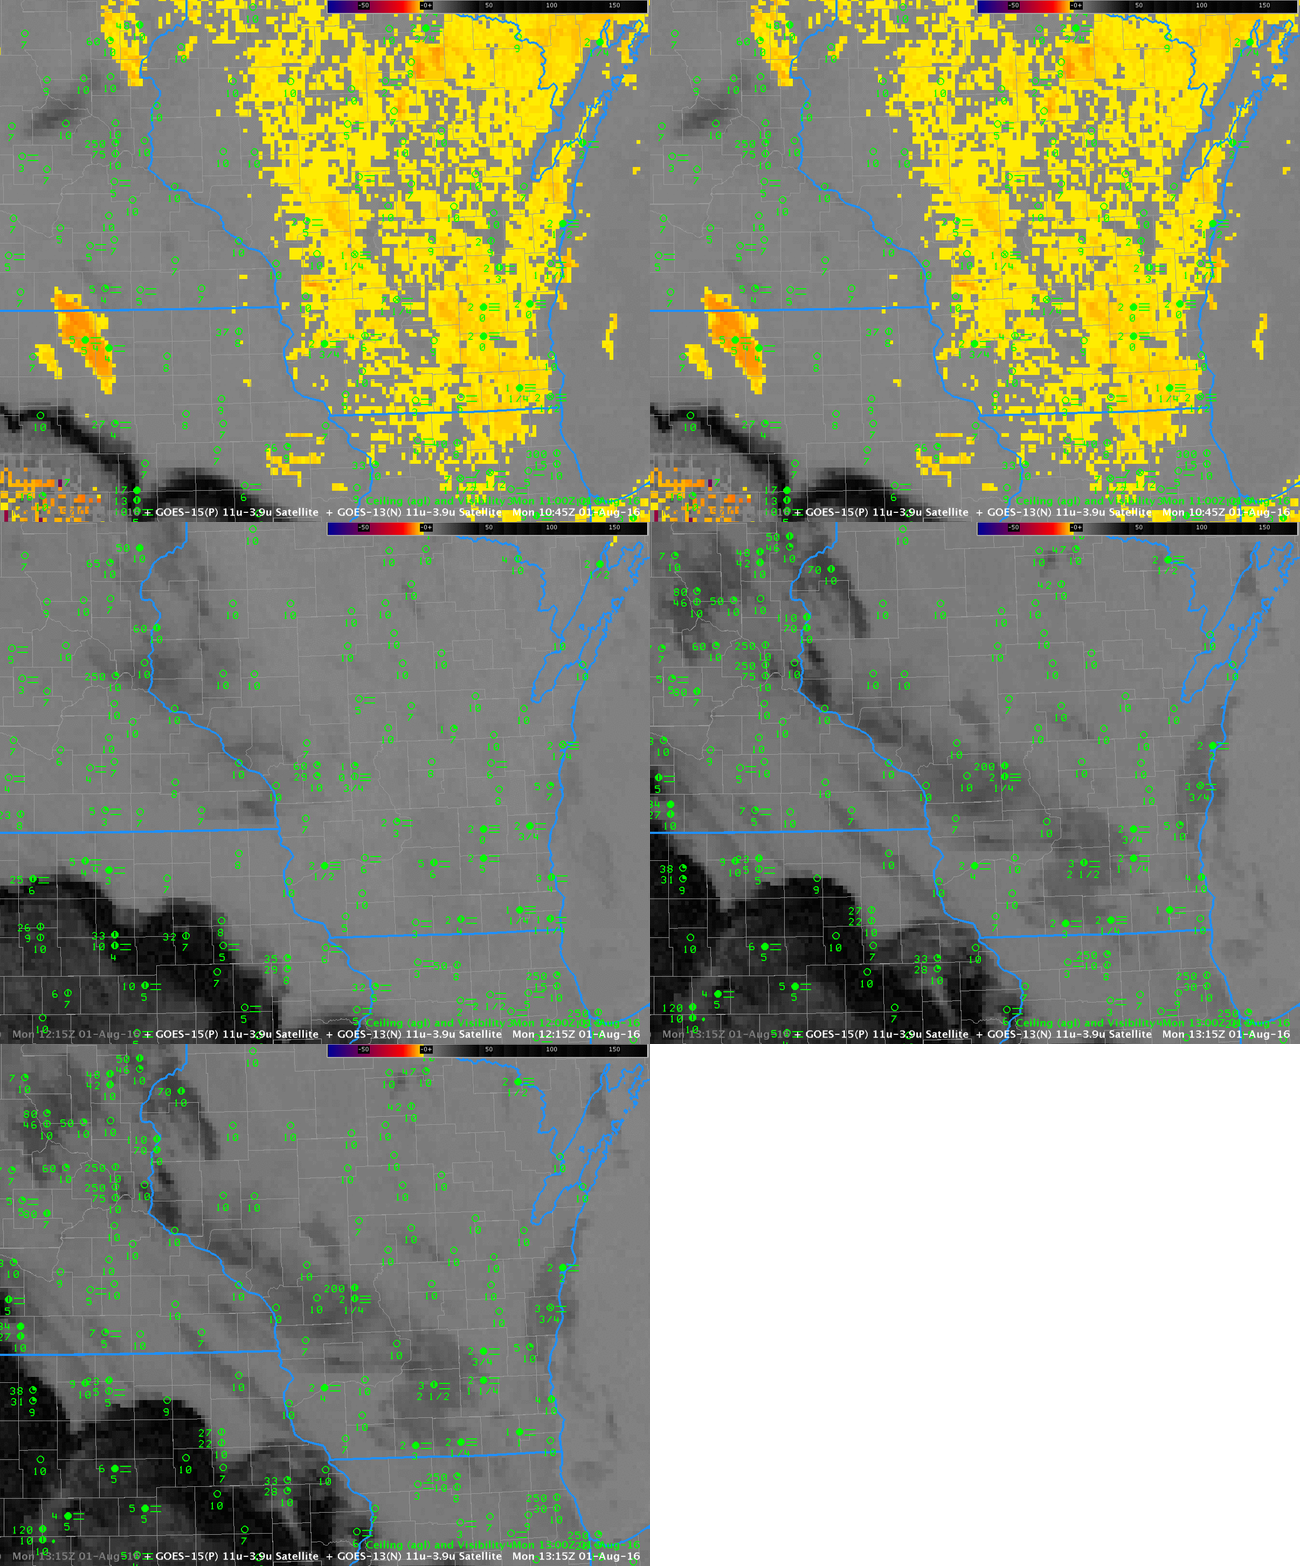
GOES-13 Brightness Temperature Difference fields (3.9 µm – 10.7 µm) are shown below. There is a strong signal at 1045 UTC, but little or no signal at 1215 UTC, before it returns (with opposite sign) at 1315 UTC.

BTD_01August2016_1045_1215_1315step

GOES-13 Brightness Temperature Difference Fields (3.9 µm – 10.7 µm) at 1045 UTC, 1215 UTC and 1315 UTC. (Click to enlarge)