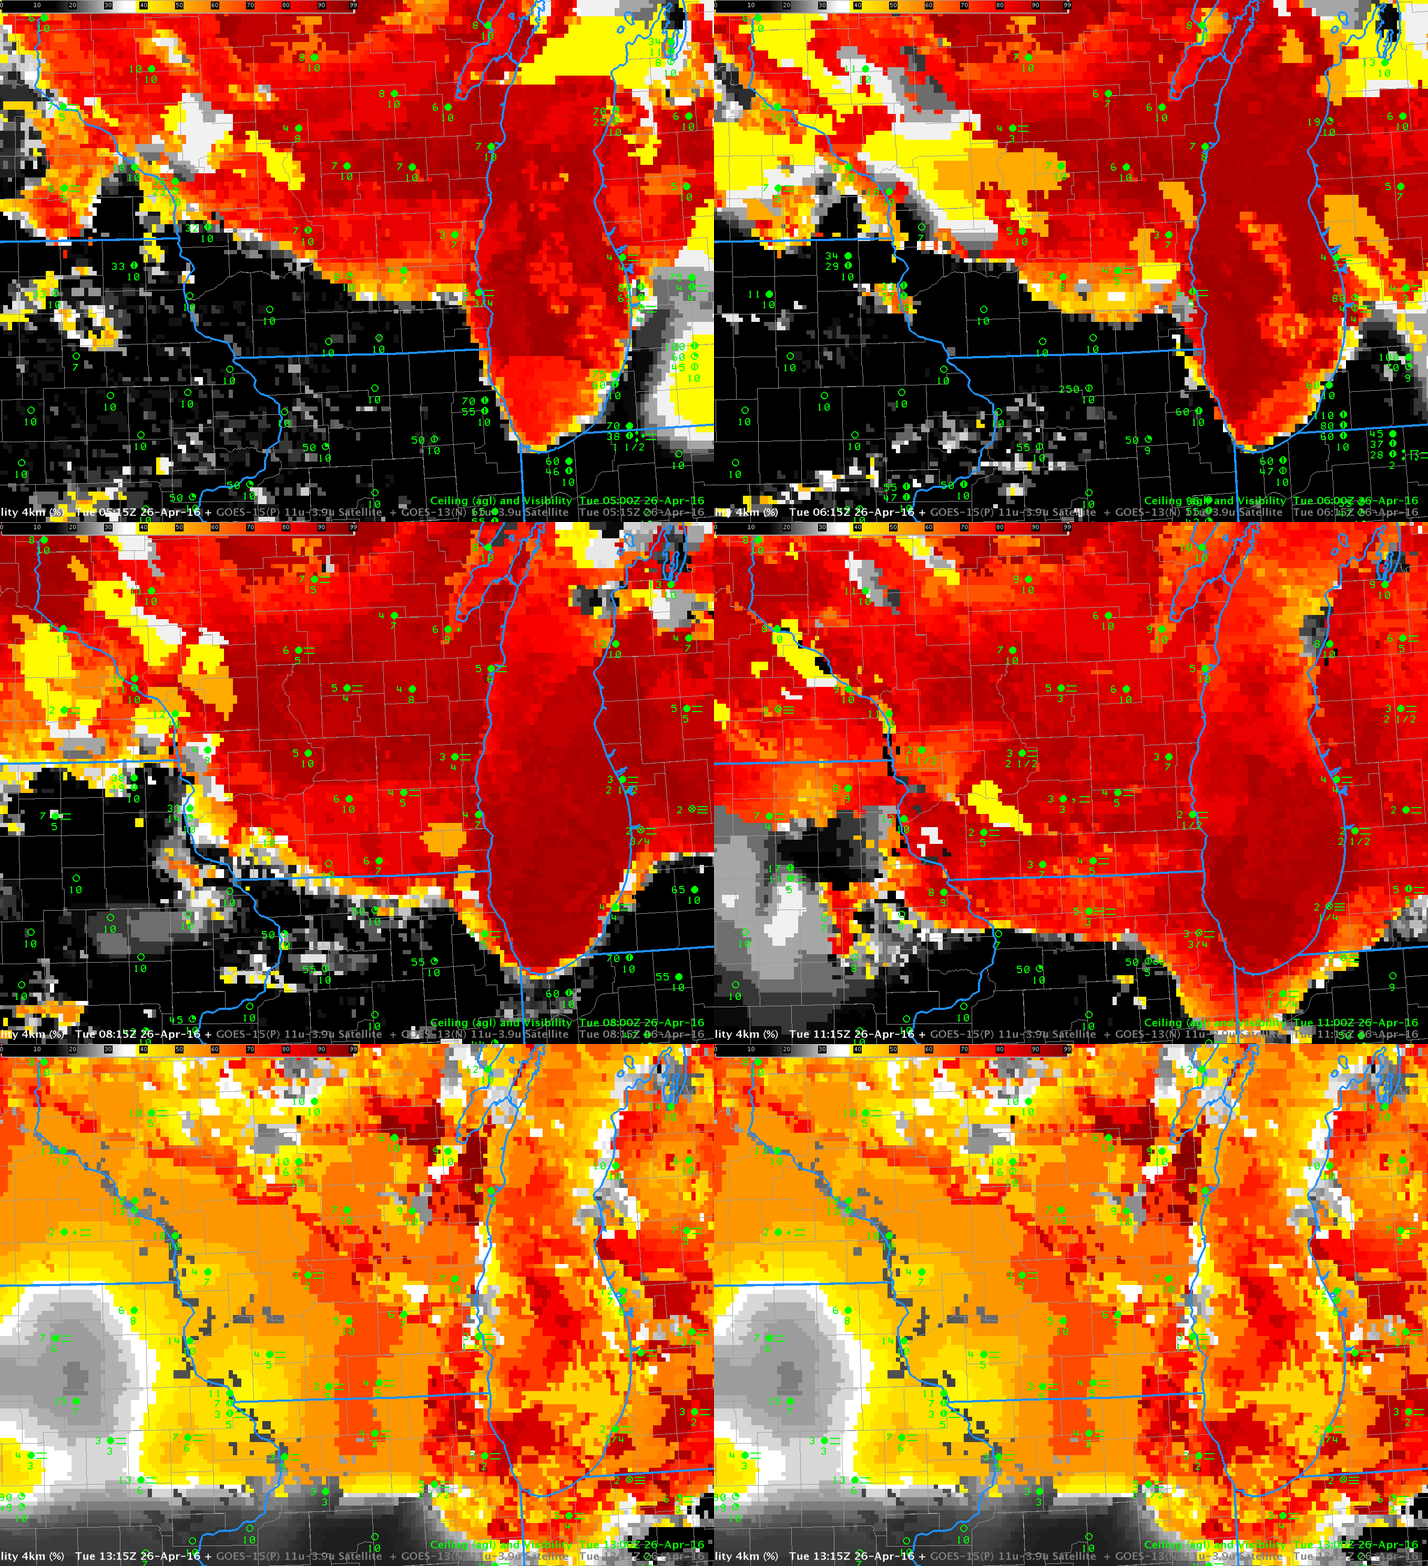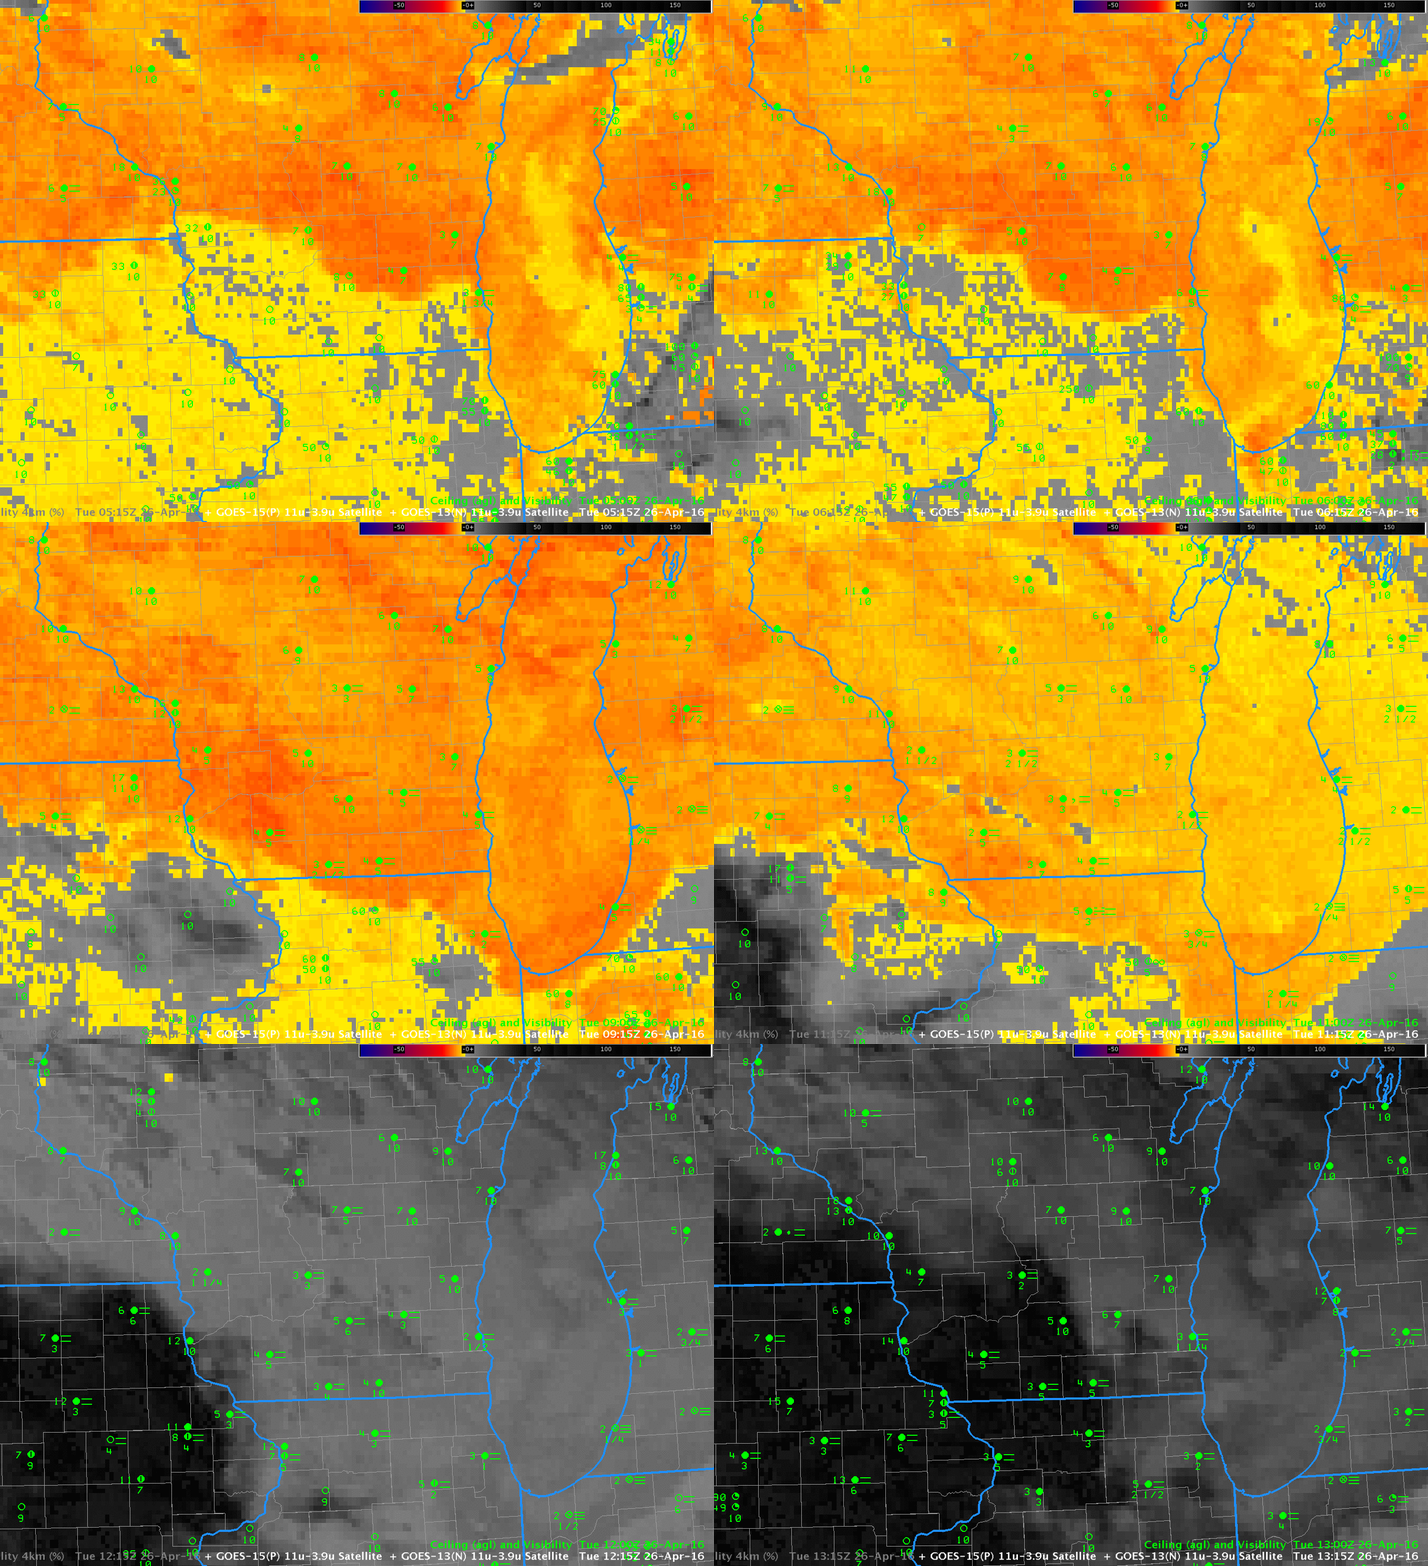
GOES-R IFR Probability, 0515-1315 UTC on 26 April, with surface observations of ceilings and visibility (Click to enlarge)
GOES-R IFR Probability fields, above, expand southwestward across the upper midwest as ceilings lower and visibilities reduce. The fields offered quick guidance on where the lowest ceilings were occurring and how the field of low clouds was evolving. After sunrise (1215 and 1315 UTC imagery), IFR Probability values increased but continued to show a coherent signal over the region of lowest ceilings and smallest visibility.
The Brightness Temperature Difference fields for the same times, below, have structures that have echoes in the IFR Probability fields. The depiction of low ceilings and visibilities associated with the largest brightness temperature difference values (the deepest orange-red in the enhancement) is lost, however, as reflected 3.9 µm radiation alters the brightness temperature difference field. By 1315 UTC, the end of the animation, only the IFR Probability field is giving useful information about the low ceilings and reduced visibilities.

