Monthly Archives: March 2016

GOES-R IFR Probability screens out mid-level stratus

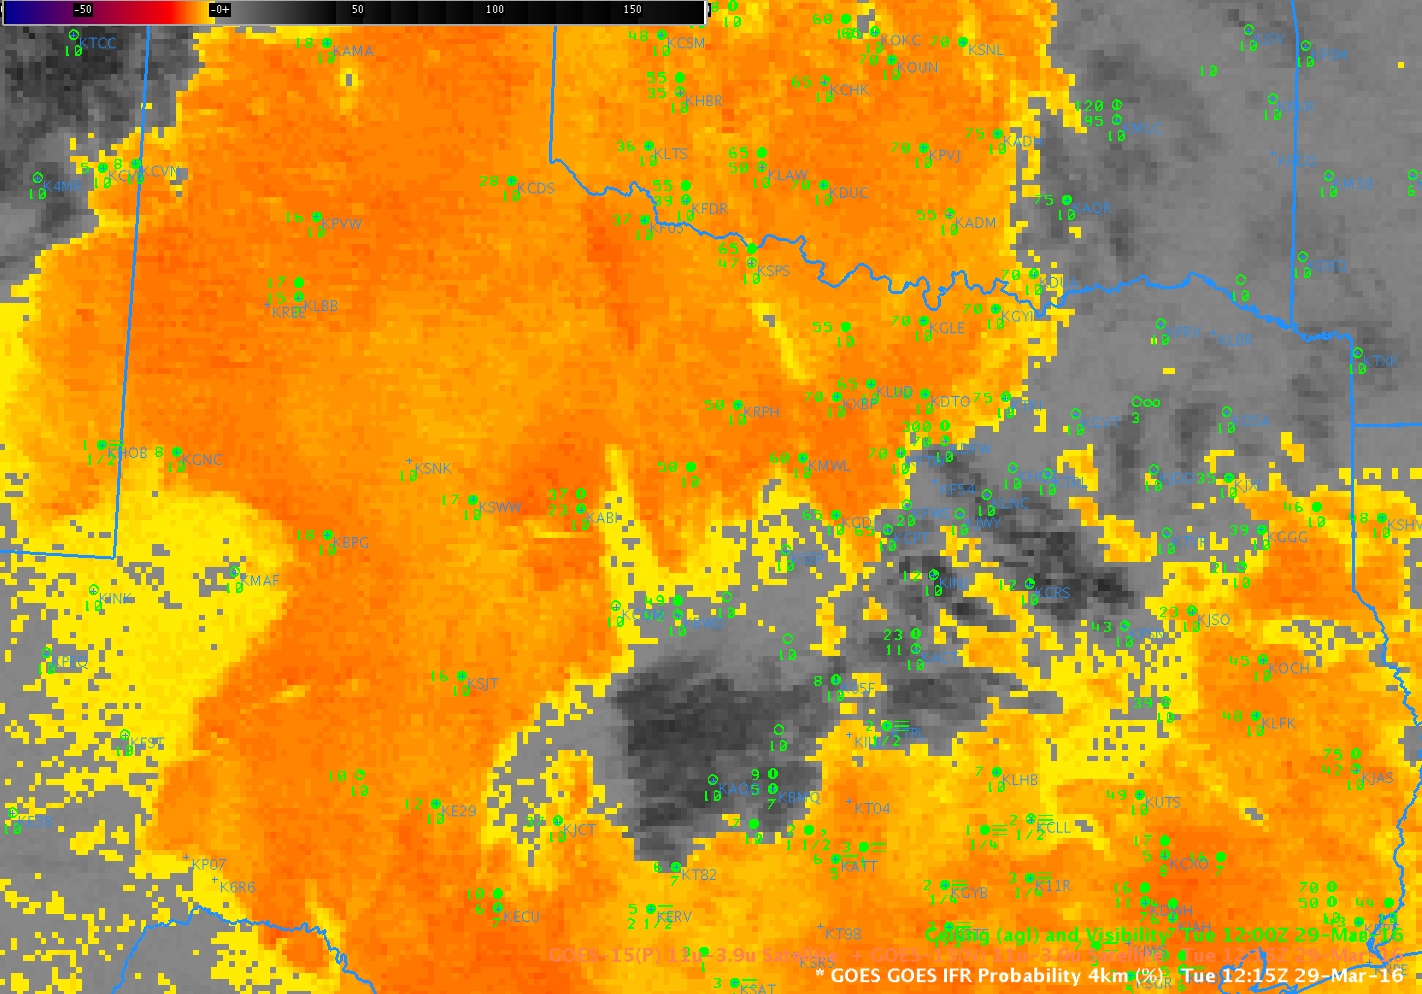
BTD_1215_29March2016

GOES-13 Brightness Temperature Difference (10.7 µm – 3.9 µm) at 1215 UTC on 29 March 2016 (Click to enlarge)

Consider the brightness temperature difference field above, from 1215 UTC on 29 March 2016. A strong signal that indicates water-based clouds extends from central Oklahoma to west Texas, and also from south Texas to west Texas. Are these water-based clouds obscuring visibilities at the surface? Over much of the region they are not. The Brightness Temperature Difference field gives information about the top of the cloud, but not the cloud base.

The GOES-R IFR Probability field for the same time, below, has screened out much of the region of mid-level stratus over Oklahoma and Texas. This can occur because IFR Probability fields include information from the Rapid Refresh Model. If that model does not indicated low-level saturation, IFR Probabilities will not be large. In the example shown, large values of IFR Probabilities are restricted to regions where IFR or near-IFR conditions are occurring.

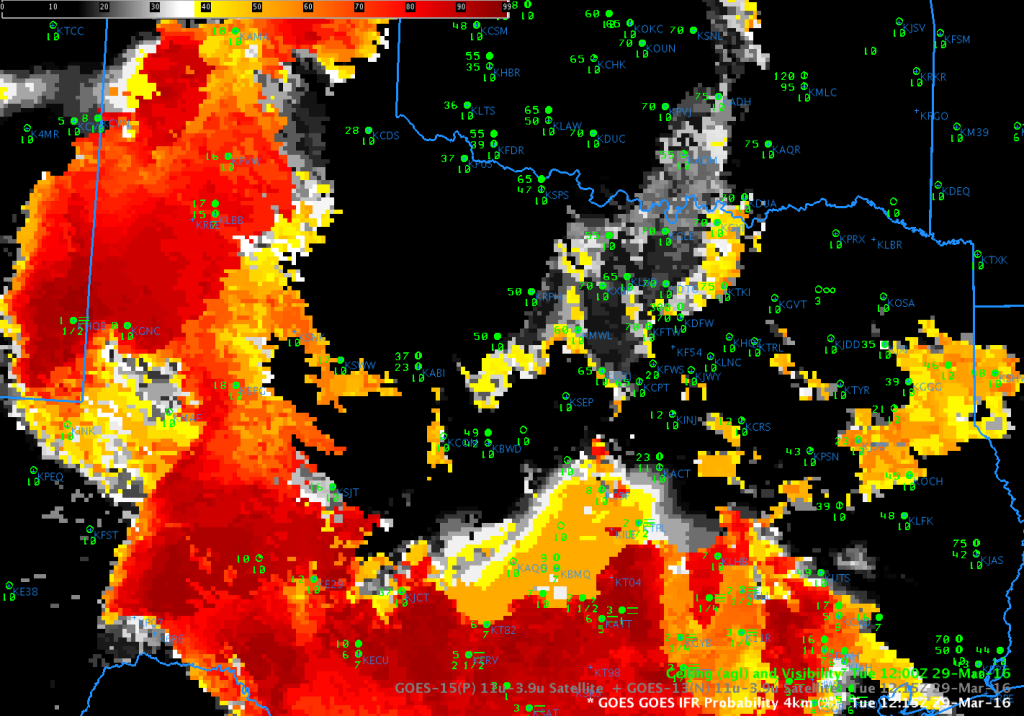
IFRP_1215_29March2016

GOES-R IFR Probability Fields at 1215 UTC on 29 March 2016 (Click to enlarge)

Coastal Stratus/Fog along the East Coast

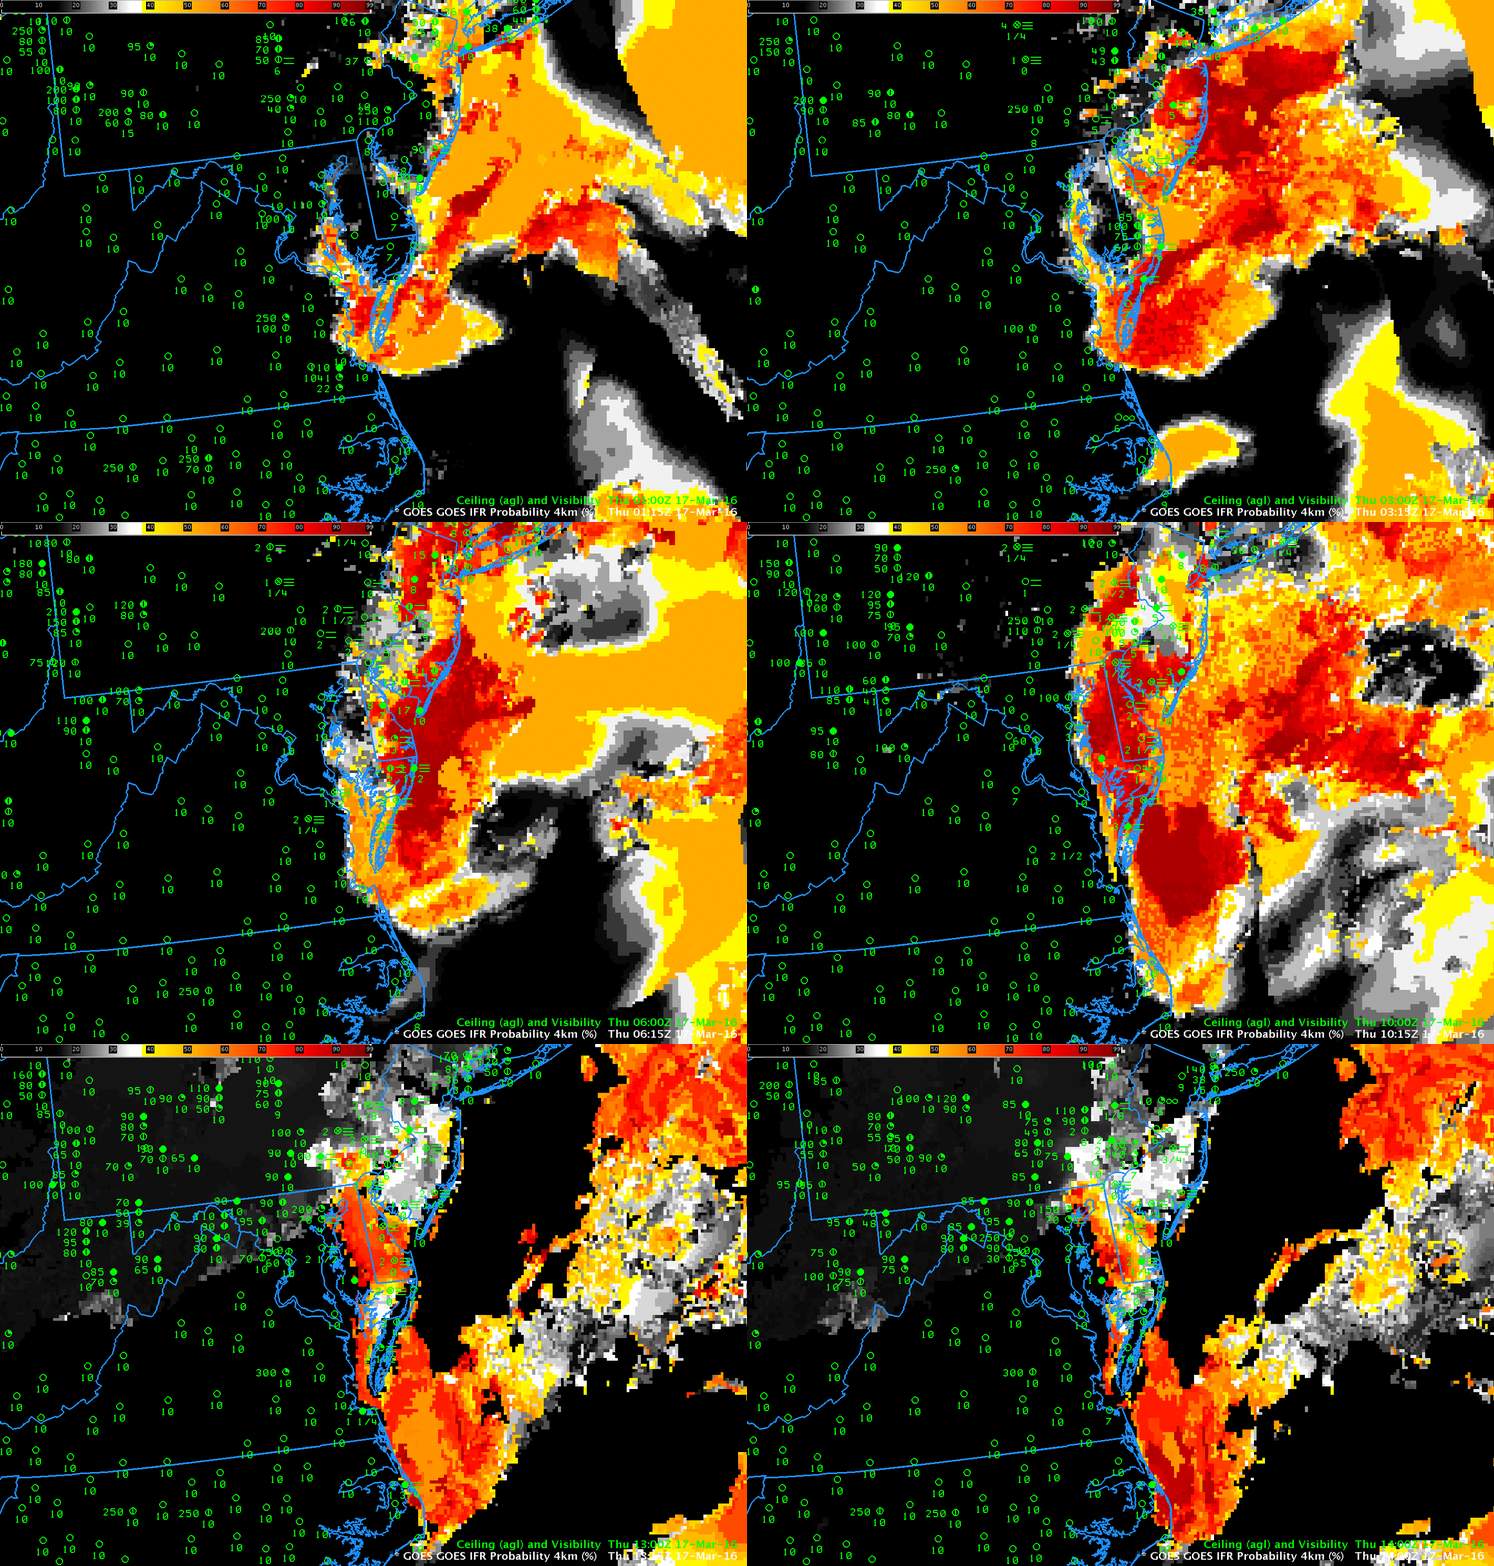
GOES_IFRP_0215_1400anim_17March2016

GOES-R IFR Probabilities, Hourly from 0215-1415 UTC 17 March 2016 (Click to enlarge)

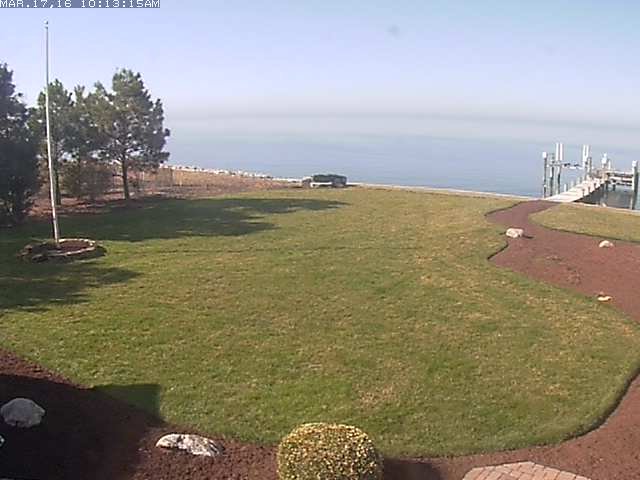
GOES-R IFR Probabilities captured the development of coastal fog over coast of the Atlantic Ocean from Long Island south to North Carolina on the morning of March 17 2016 behind a weak cold front. IFR Conditions penetrated into the Delaware and Lehigh River Valleys over Pennsylvania. In general, GOES-R IFR Probability fields captured the region of IFR conditions as it developed and expanded. Note that the IFR Probabilities remained elevated through 1400 UTC along the eastern shore of Chesapeake Bay. The 1413 UTC webcam image from Tilghman Island, below, (source), shows an offshore fogbank.

TilghmanMDViewOverBay

Widespread IFR conditions over the Upper Midwest

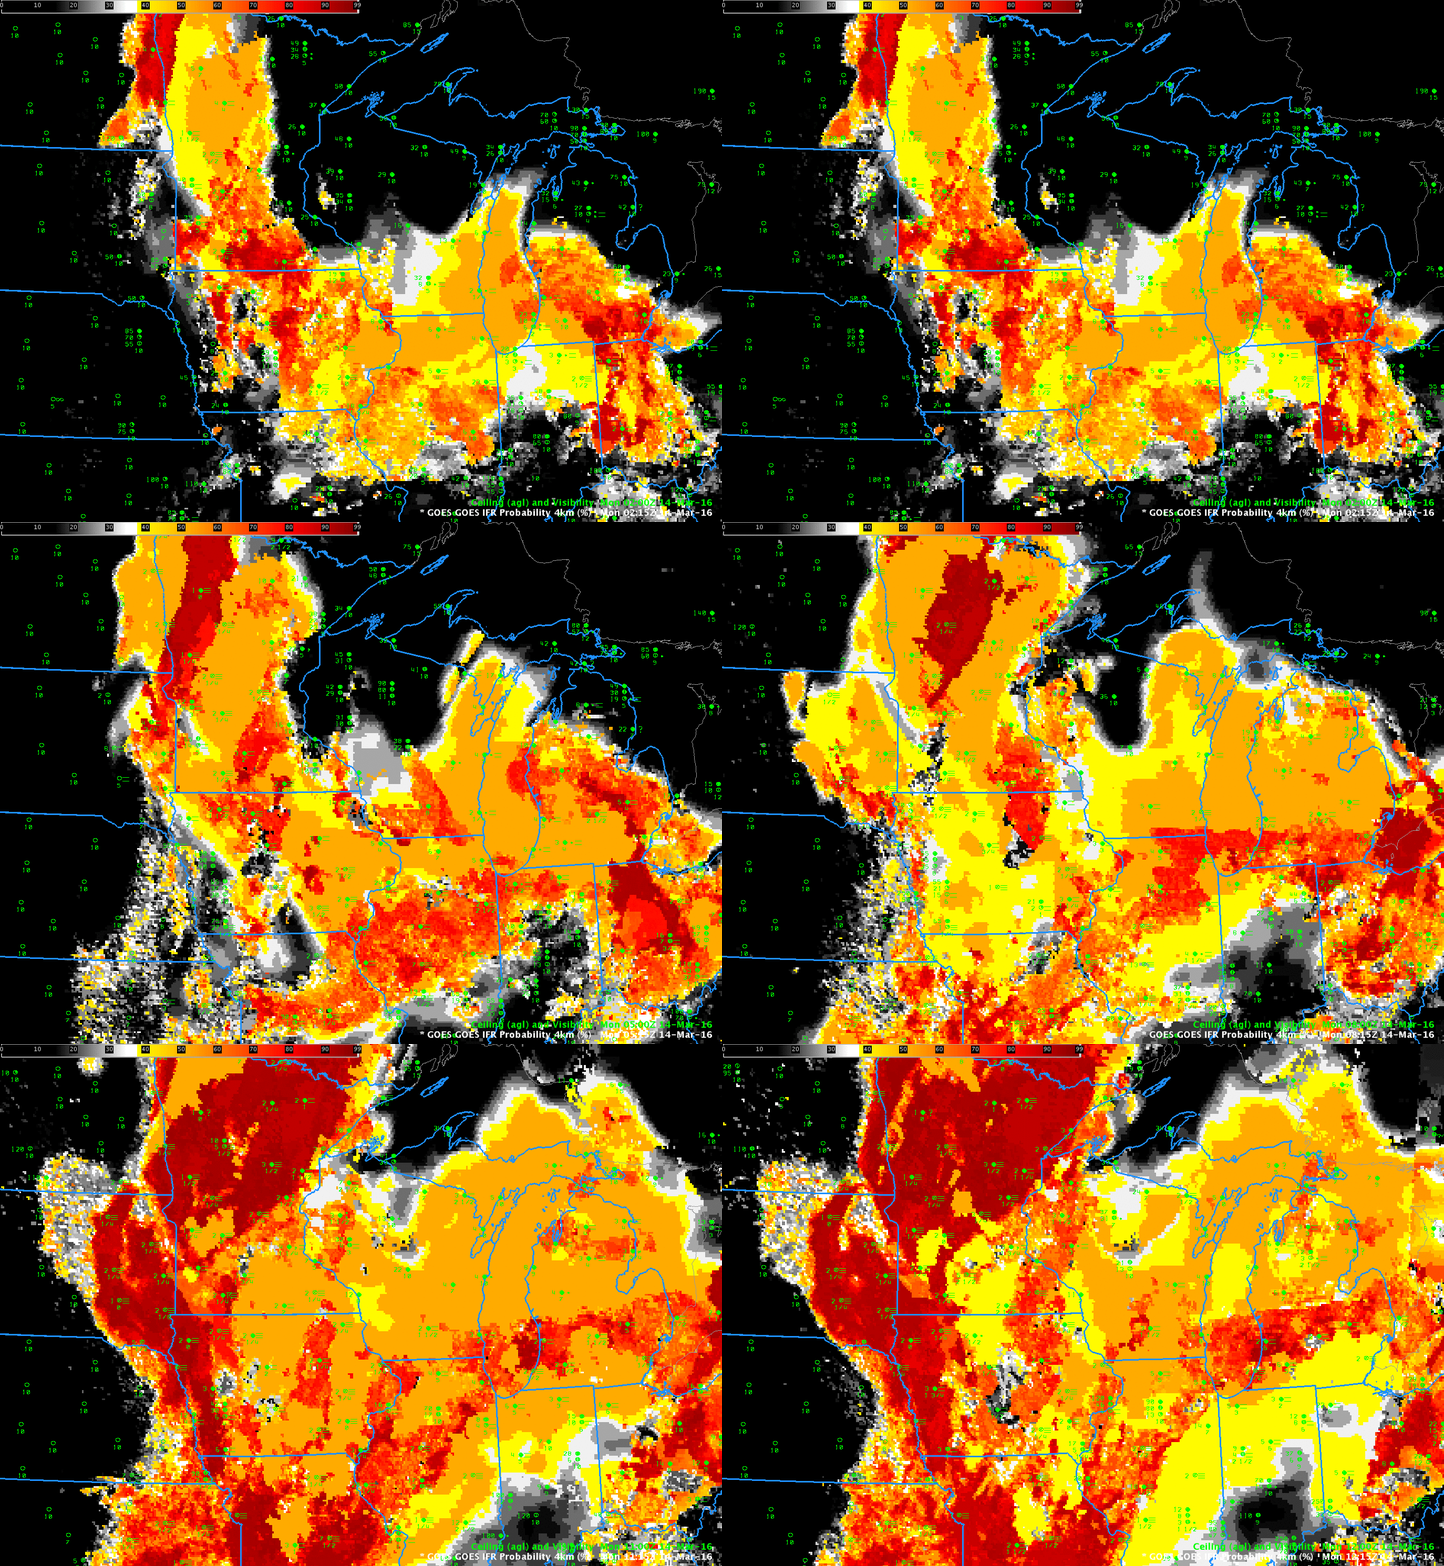
GOESR_IFRP_0215_1215stepanim

GOES-R IFR Probability Fields, hourly from 0215-1215, 14 March 2016 (Click to enlarge)

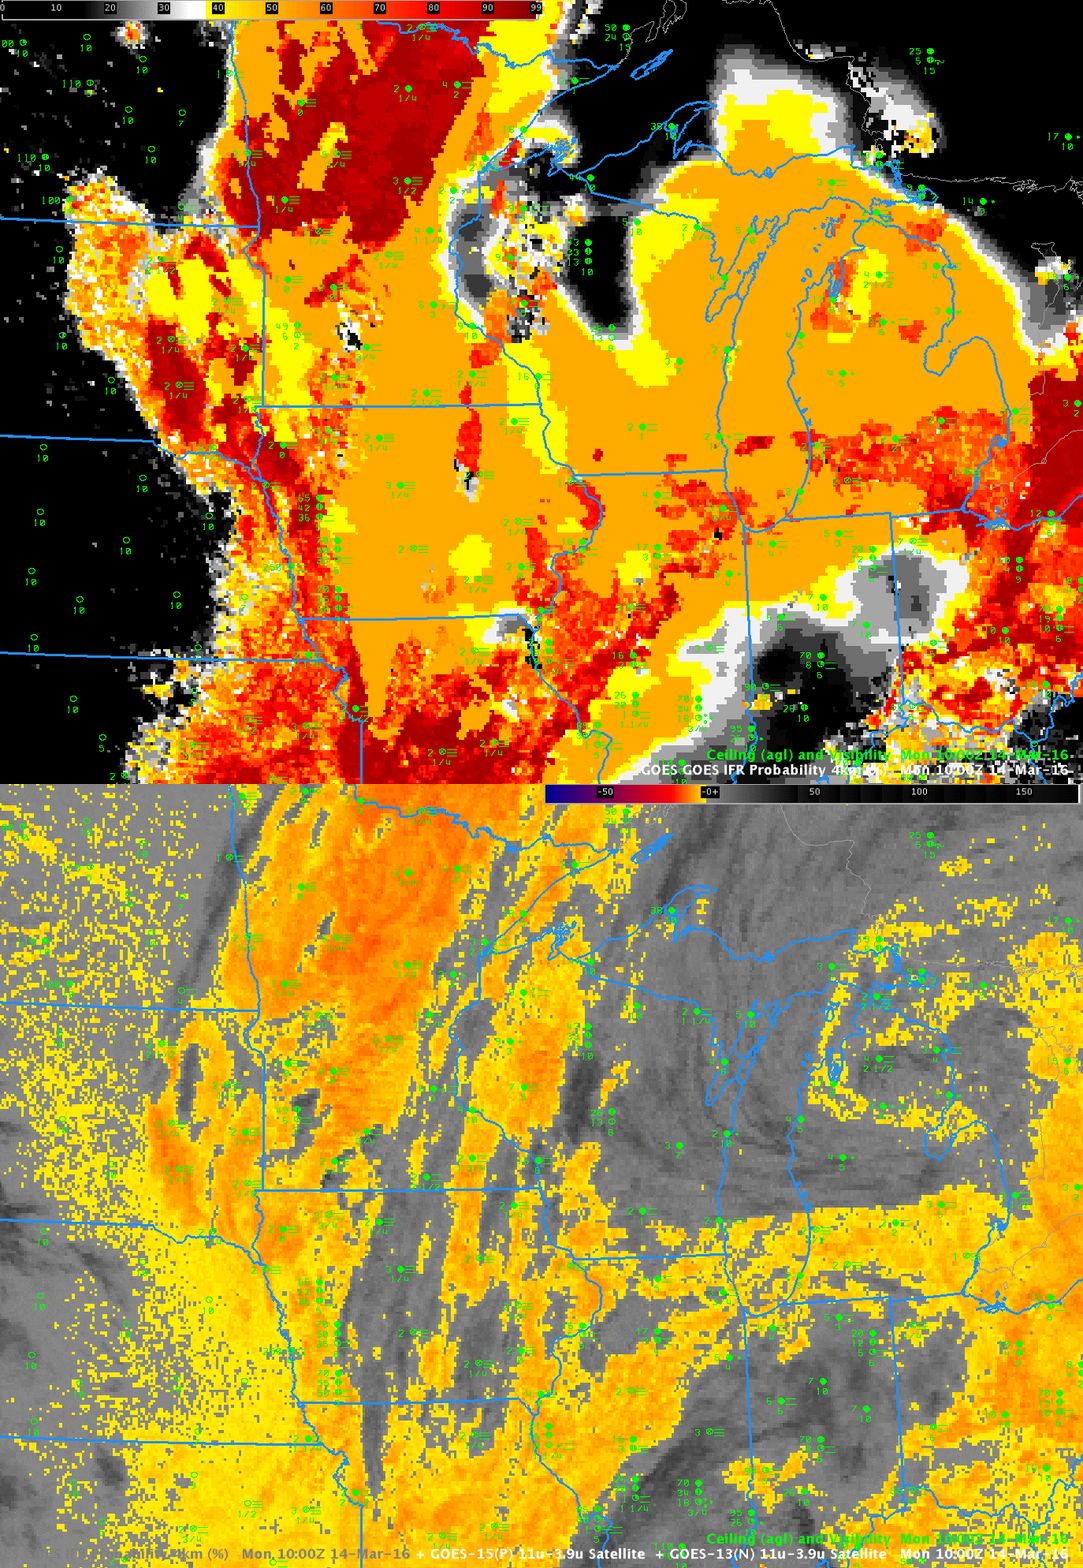
A rain-dampened boundary layer allowed fog to form over much of the upper midwest on early Monday March 14 2016 (as a baggy low pressure system moved eastward). GOES-R IFR Probability fields, above, captured the slow expansion of the region of IFR conditions.  The character of the IFR Probability Field varies from smooth (over northern Illinois at 0215 UTC, for example (link)) to pixelated (over southern Minnesota at the same time).  This is related to whether the model only is used as a predictor (over northern Illinois) because of high clouds that prevent the satellite from viewing low clouds or whether model and satellite data are both used as predictors (over southern Minnesota).  The toggle below, of IFR Probability Fields and Brightness Temperature Difference fields at 1000 UTC on 14 March, underscores this relationship between IFR Probability and Brightness Temperature Difference fields.

In the animation above, IFR conditions are in general observed where IFR Probability fields suggest their presence.

GOES_IFR_BTD_14March2016_1000ztoggle

GOES-R IFR Probability and GOES-13 Brightness Temperature Difference Field, 1000 UTC on 14 March 2016 (Click to enlarge)

IFR Probability and Topography

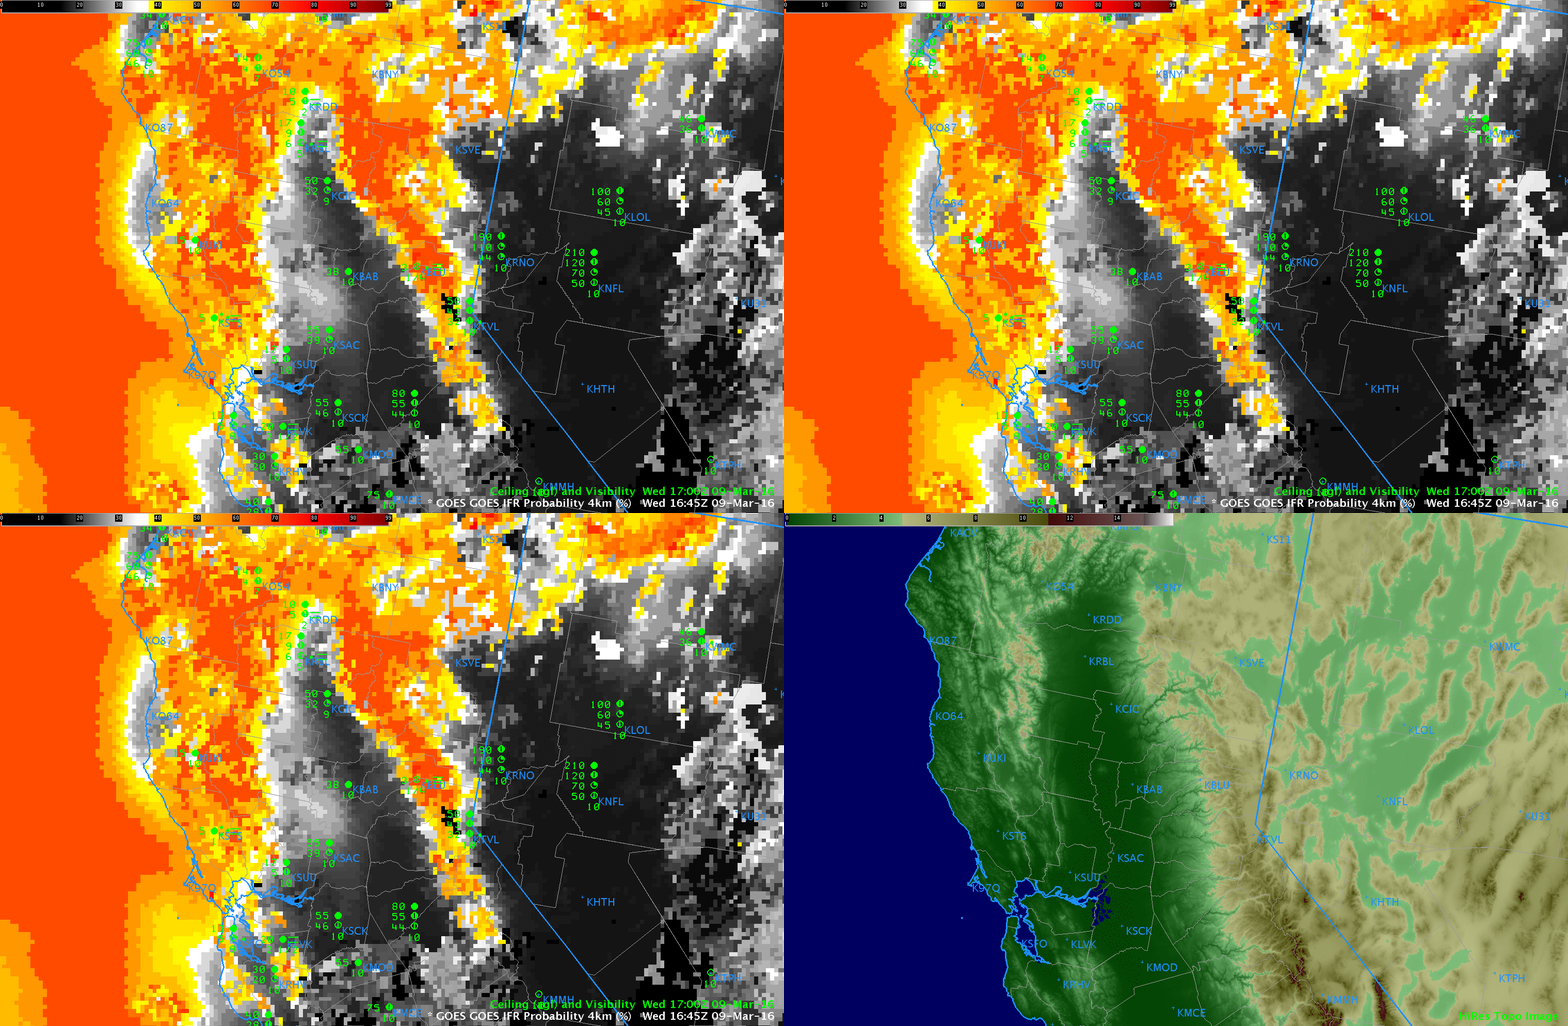
GOES_IFR_15z_9March_Topo.toggle

It is not unusual for land to ascend into the clouds in regions where Moutains abut large valleys or gently sloping plains.  This is especially apparent in California on either side of the Central Valley.  The toggle above shows IFR Probability fields at 1645 UTC on 9 March, and a high-resolution topographic image.  High IFR Probabilities are well correlated with high terrain. This is something a user must consider when using the product.