Monthly Archives: February 2016

Fog over ArkLaTex

IFRP-02

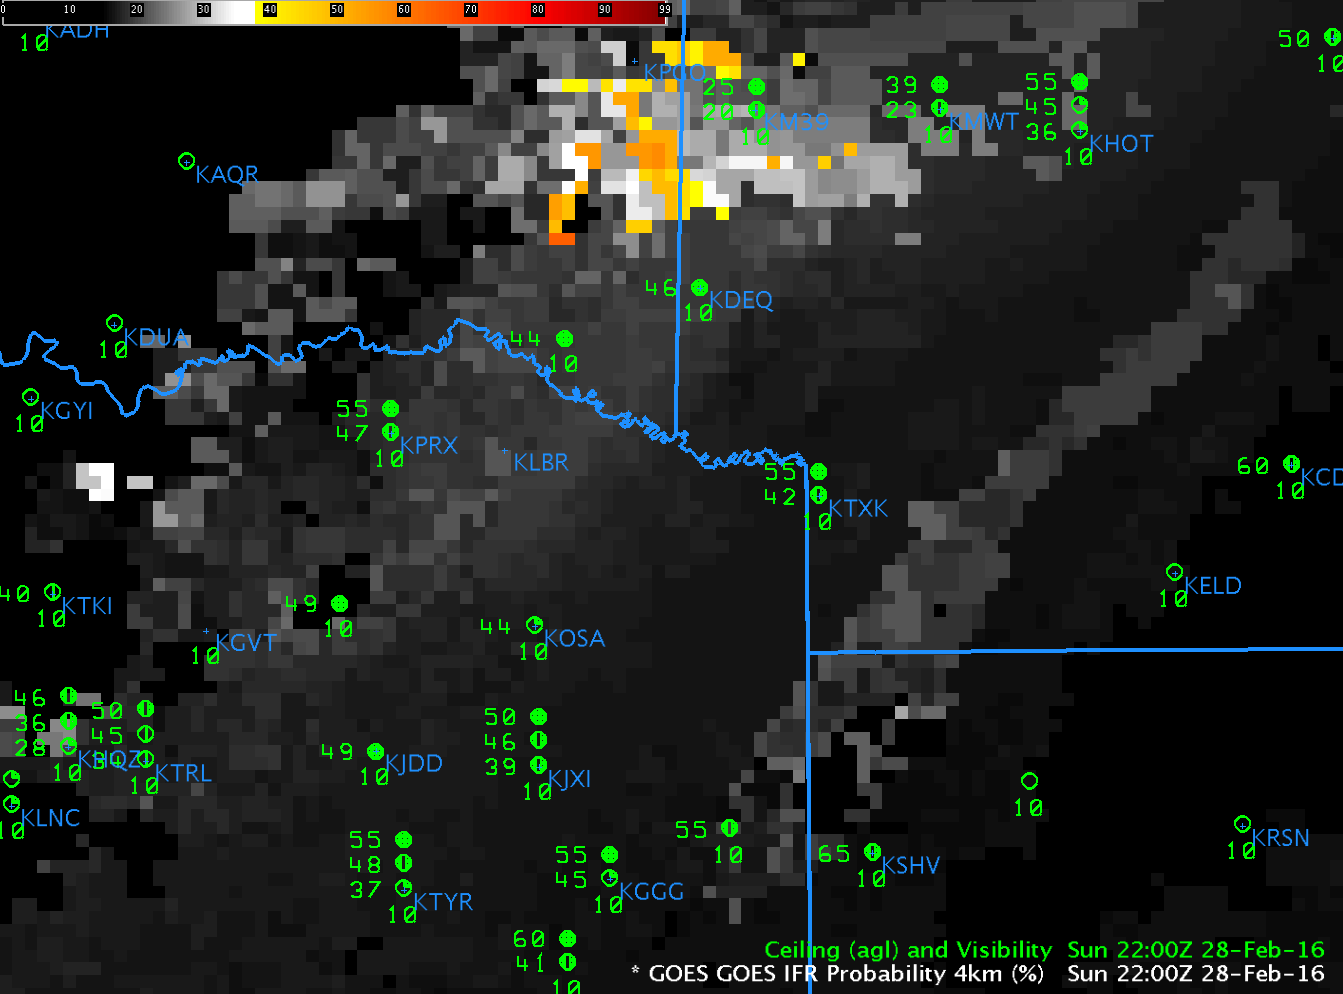
GOES-R IFR Probabilities, 2200 UTC on 28 February 2016 as well as surface observations of ceilings and visibilities (click to enlarge)

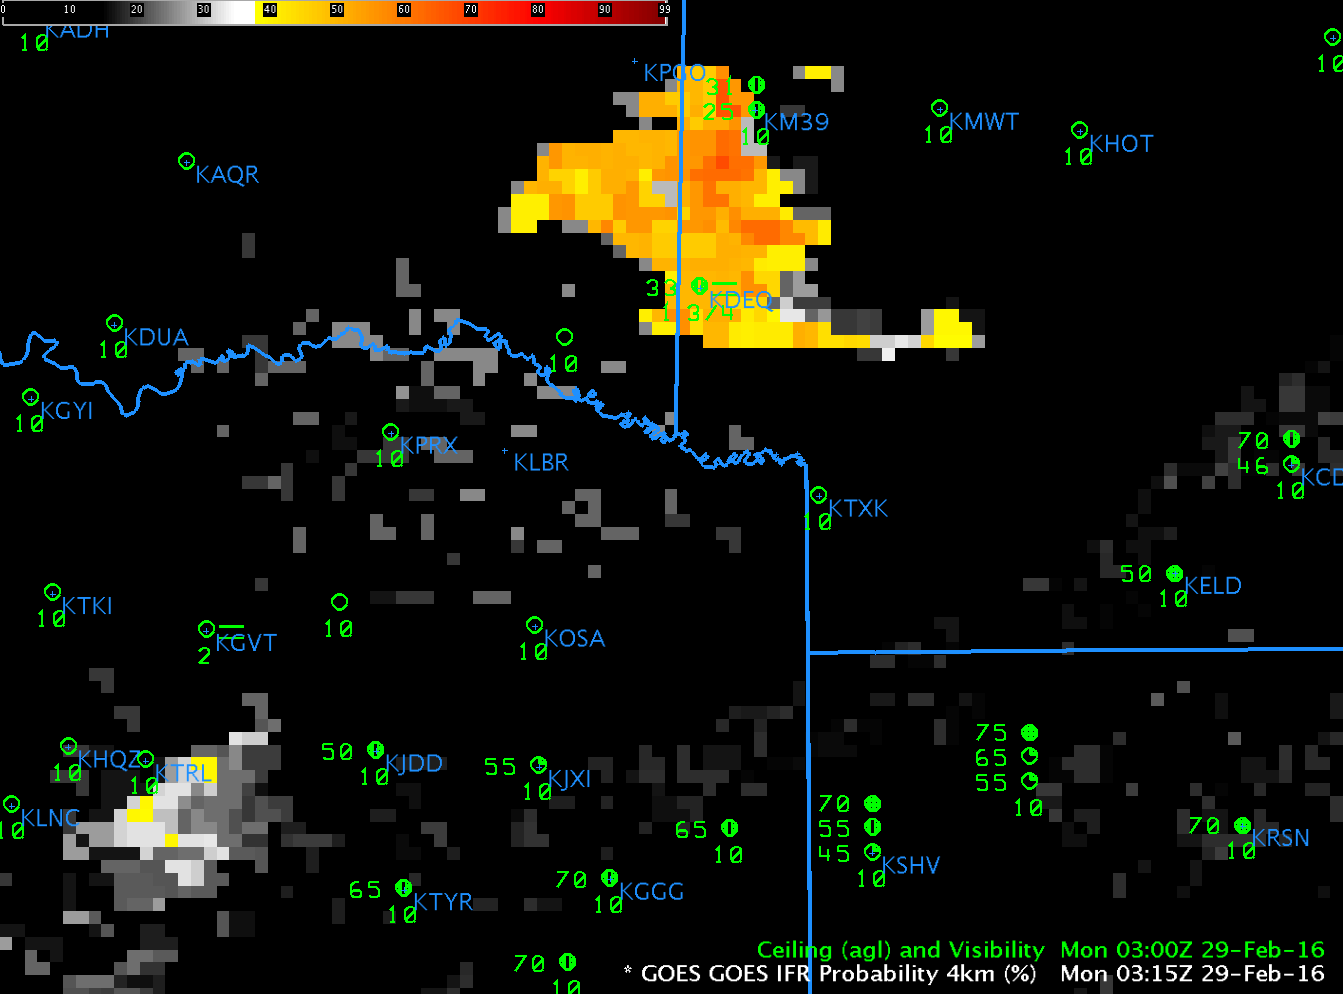
Late in the day on 28 February, as shown above, GOES-R IFR Probability fields included a small region of enhancement over west-central Arkansas and east-central Oklahoma. In this case, that field heralded the development of more widespread IFR conditions over northeast Texas (and surroundings). By 0300 on 29 February, below, IFR probailities in the region over east-central Oklahoma/west-central Arkansas had increased, and there is a suggestion of increasing IFR Probabilities over northeast Texas as well.  This is a case where IFR Probabilities can alert a forecaster to pay attention to a region long before a hazard develops.
IFRP-19

GOES-R IFR Probabilities, 0315 UTC on 29 February 2016 as well as surface observations of ceilings and visibilities (click to enlarge)

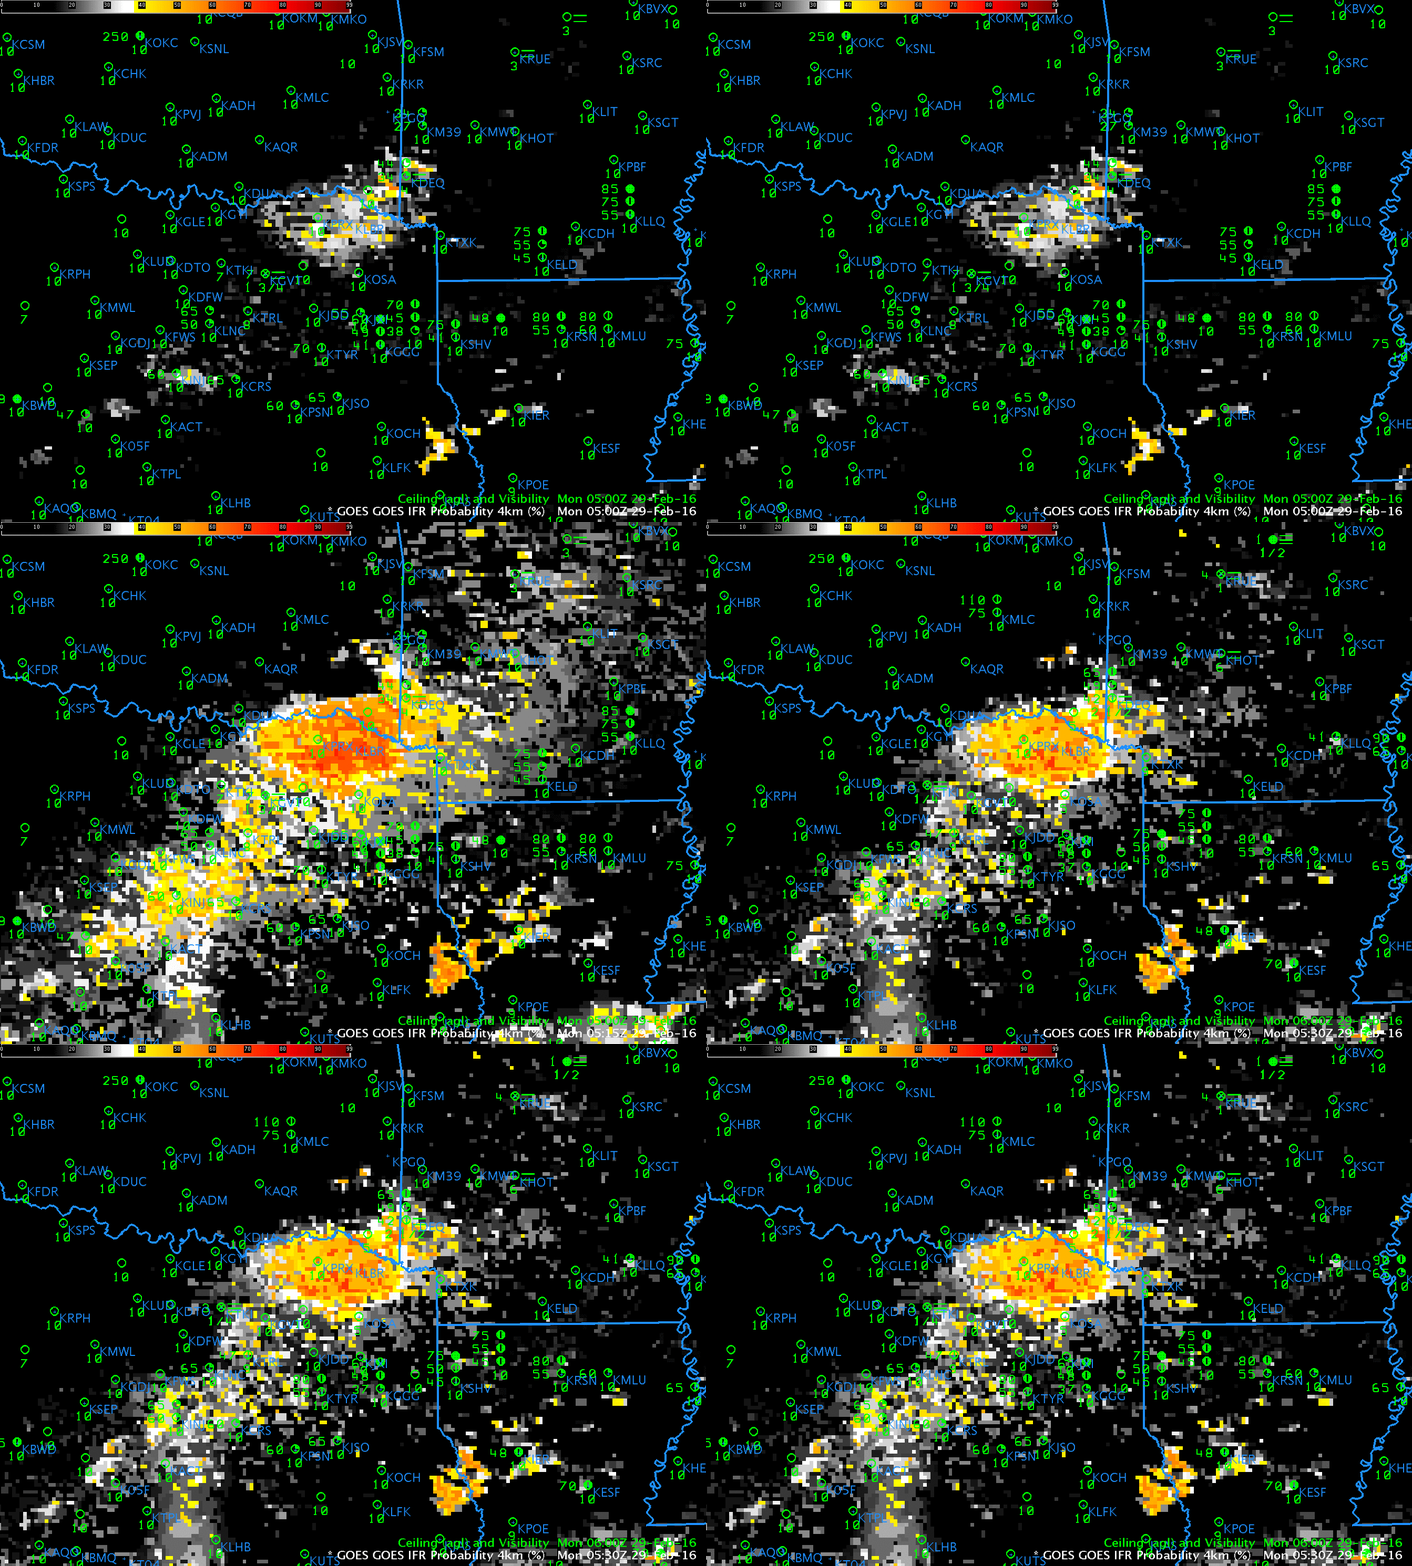
Late February starts the time when GOES-13 is near enough to eclipse season that stray light can creep into imagery. In this case, a large signal increase between 0500 and 0515, below, is in part related to stray light, and in part to low cloud development. By 0530, IFR Probability fields show less affect from stray light. (Click here for an animation of brightness temperature difference fields alone; Stray Light has an obvious impact at 0515 UTC).
IFR_P_0500_0530_29feb2106anim

GOES-R IFR Probability fields, 0500-0530 UTC, 29 February 2016, showing Stray Light Effects (Click to enlarge)

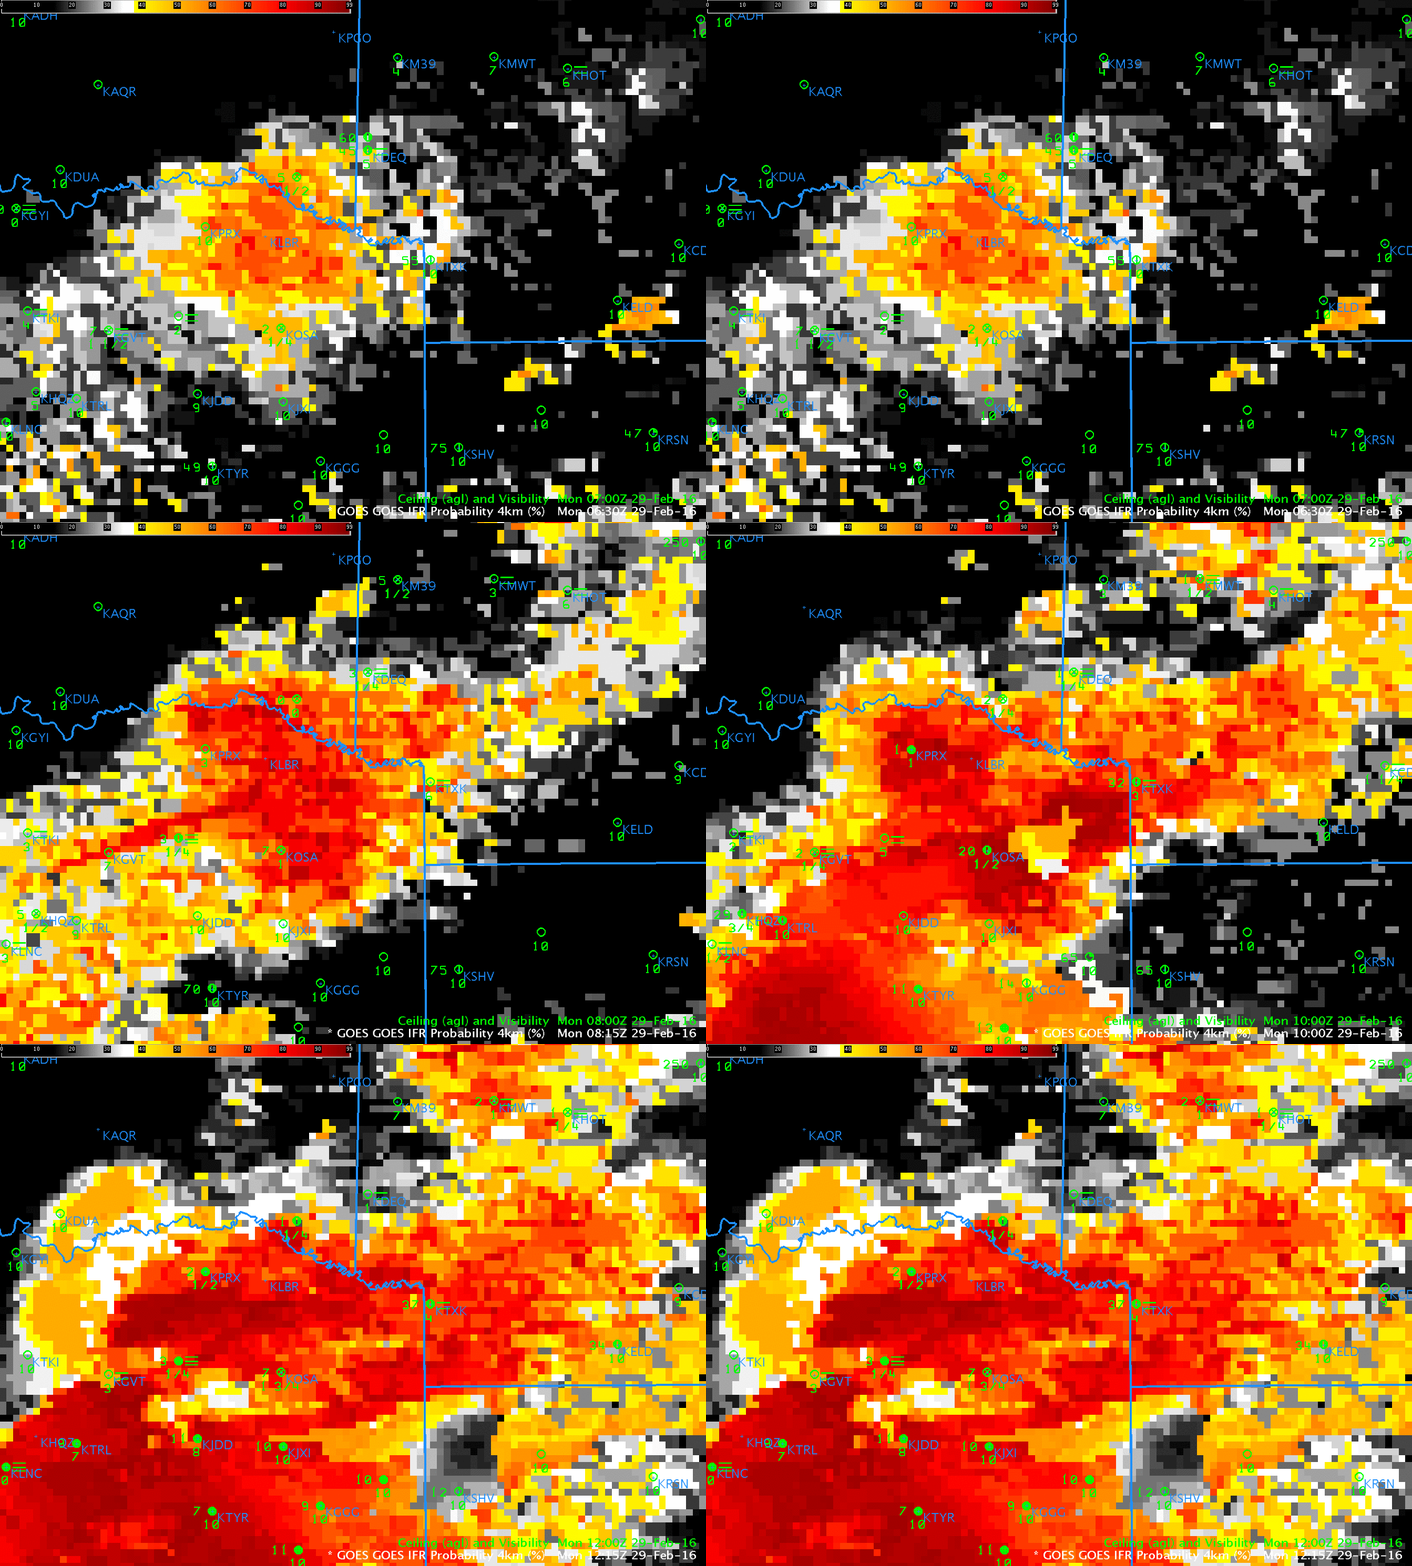
IFR Probability fields from 0615 through 1215 UTC are shown below. Very high IFR Probabilities (and IFR conditions) were widespread in the early morning over northeast Texas and surrounding states.

IFRPanim_0615_1215_29February

GOES-R IFR Probabilities fields, hourly from 0615-1215 UTC, and surface reports of ceilings and observations (Click to enlarge)

Nebraska Fog

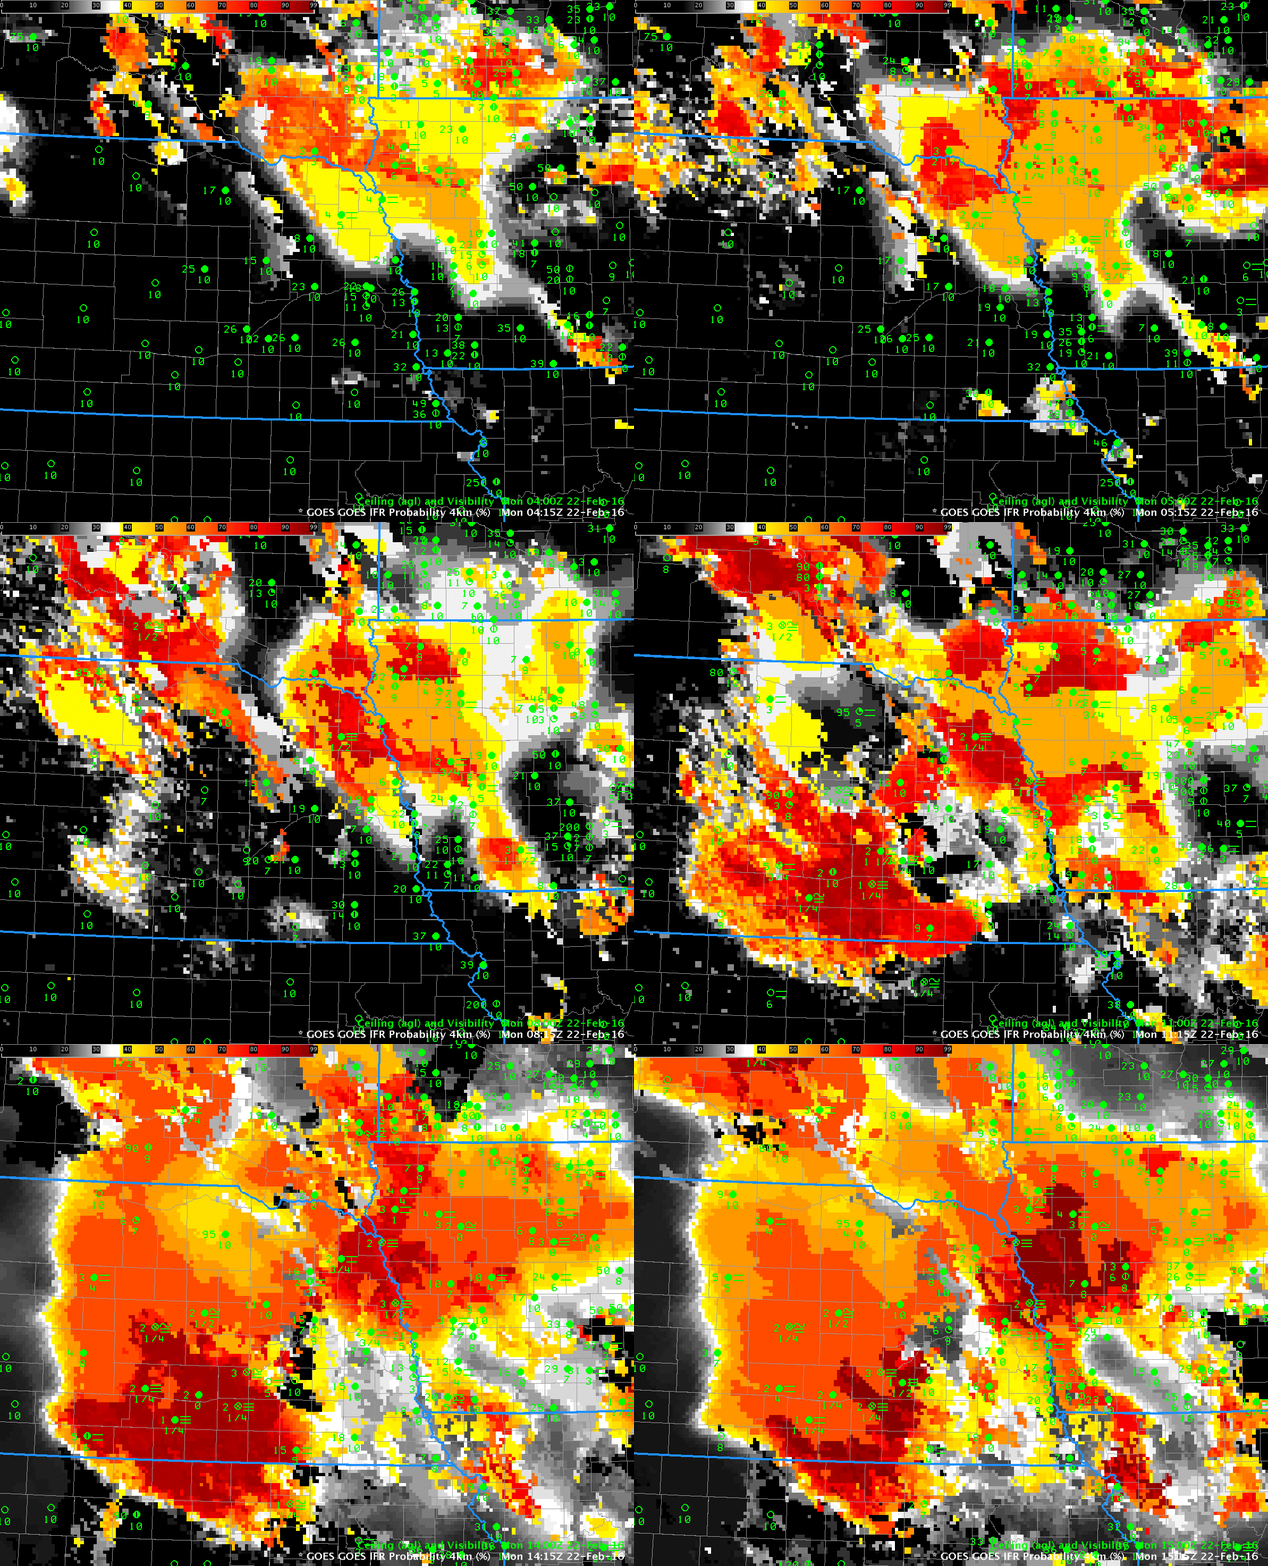
IFRP-0415_1515anim_22feb2016

GOES-R IFR Probability fields, hourly from 0415 to 1515 UTC on 22 February, along with surface observations of ceilings and visibilities (Click to enlarge)

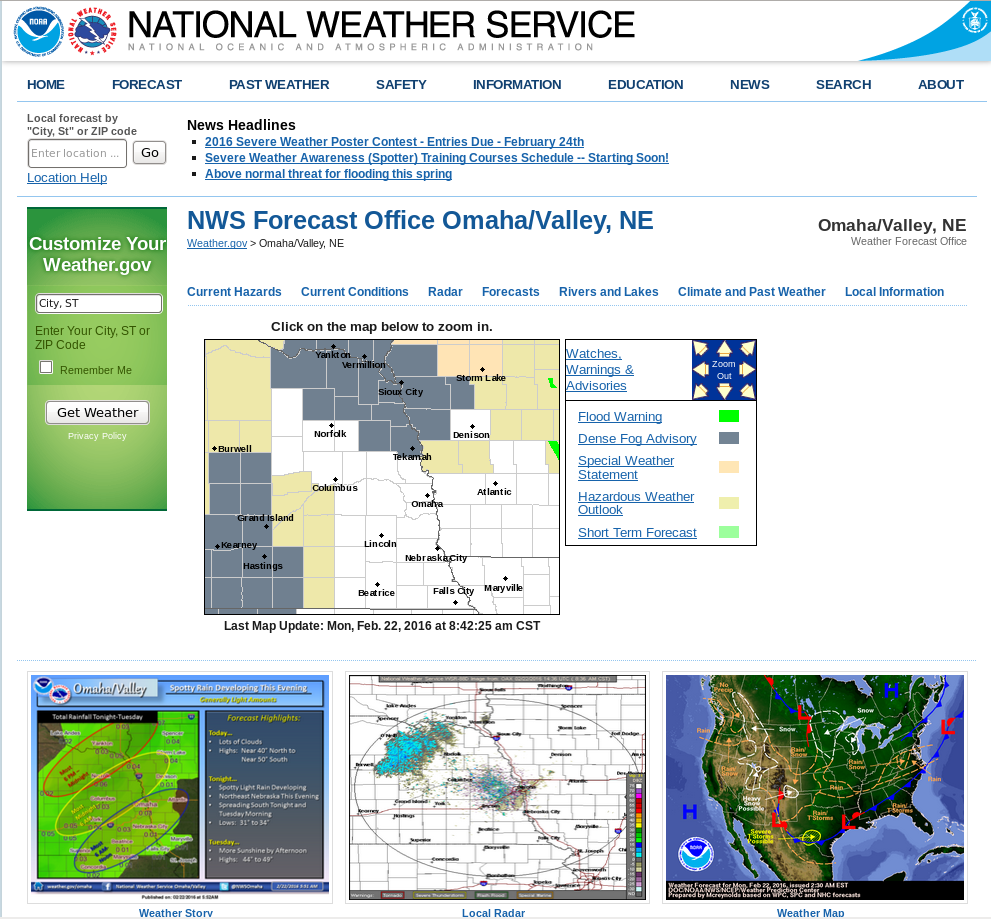
Dense Fog developed in two regions over Nebraska overnight, as shown in the screen capture below (from 1445 UTC) showing Dense Fog Advisories. GOES-R IFR Probabilities discerned the differences between the two regions, as shown in the animation above. The fog feature near the Missouri River (the boundary between Iowa and Nebraska) developed first in a region where high clouds were also present. That high clouds are present is apparent from the flat nature (that is, not pixelated) of the IFR Probability field at, say, 0415 and 0515 over western Iowa. The second region of fog, over south-central Nebraska, develops under clear skies as evidences by the (initially) very pixelated field. Towards the end of the animation high clouds overspread that region also. When that happens, IFR Probability values drop (because only model predictors can be used in the computation of IFR Probability in regions where high clouds exist). At the end of the animation, largest IFR Probabilities overlap the two regions where Dense Fog Advisories were issued. The region in between the advisories has lower Probabilities.

NWSFronPage

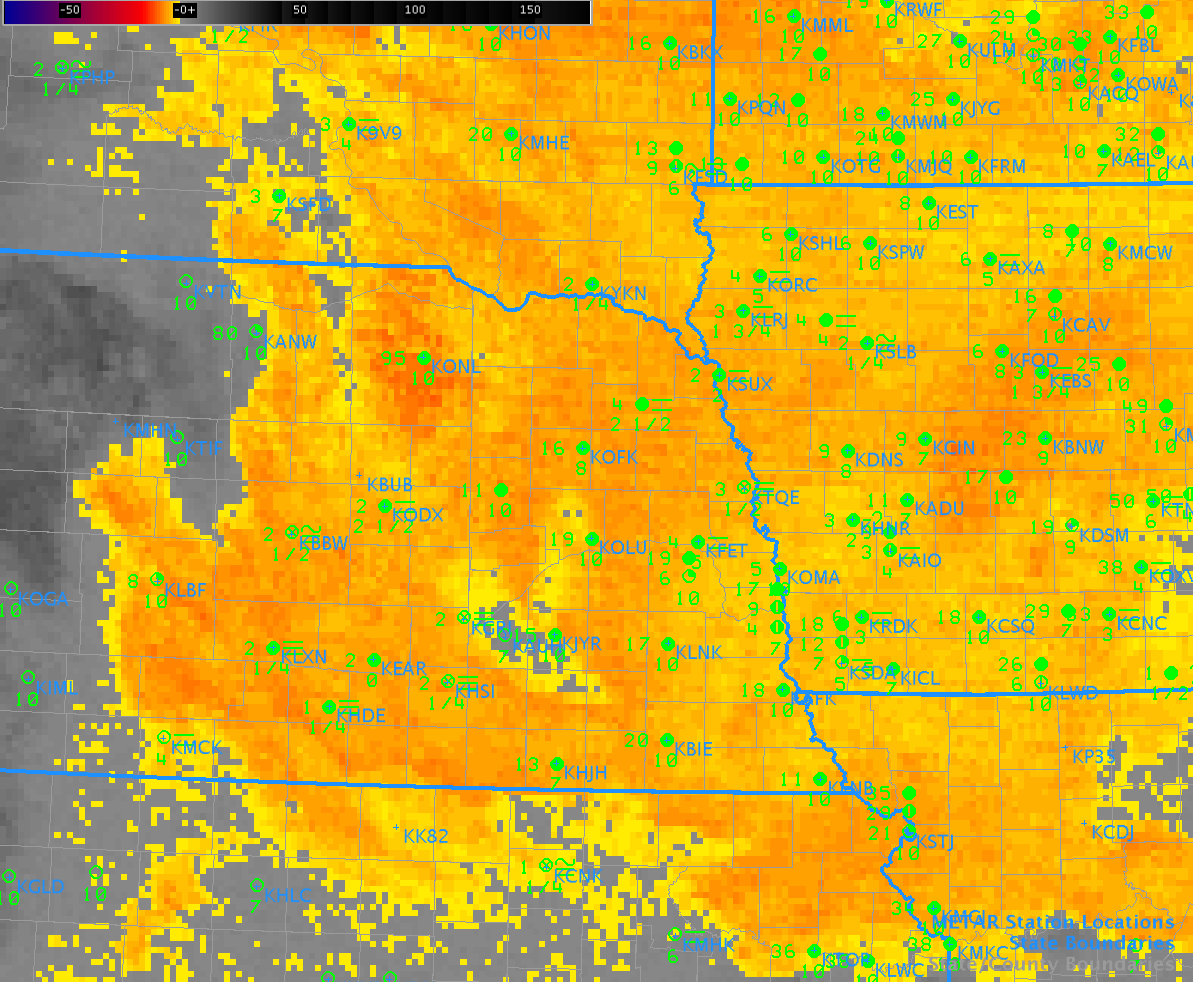
Compare the IFR Probability field, above, to Brightness Temperature Difference, below. Brightness Temperature Difference fields identify regions of Fog and Stratus, but near-surface information cannot be extrapolated (consistently) from cloud-top information. Thus, many stations with ceilings and visibilities far better than IFR conditions are in regions where a strong Brightness Temperature Difference signal exists (for example, KONL in northeastern Nebraska), The incorporation of surface information via Rapid Refresh model predictions of near-surface saturation allows the IFR Probability fields to better outline regions of IFR conditions only.

BTD_1300UTC_22feb2016

GOES-13 Brightness Temperature Difference (10.7 µm – 3.9 µm), 1300 UTC on 22 February 2016 (click to enlarge)

Fog over the Tennessee River Valley

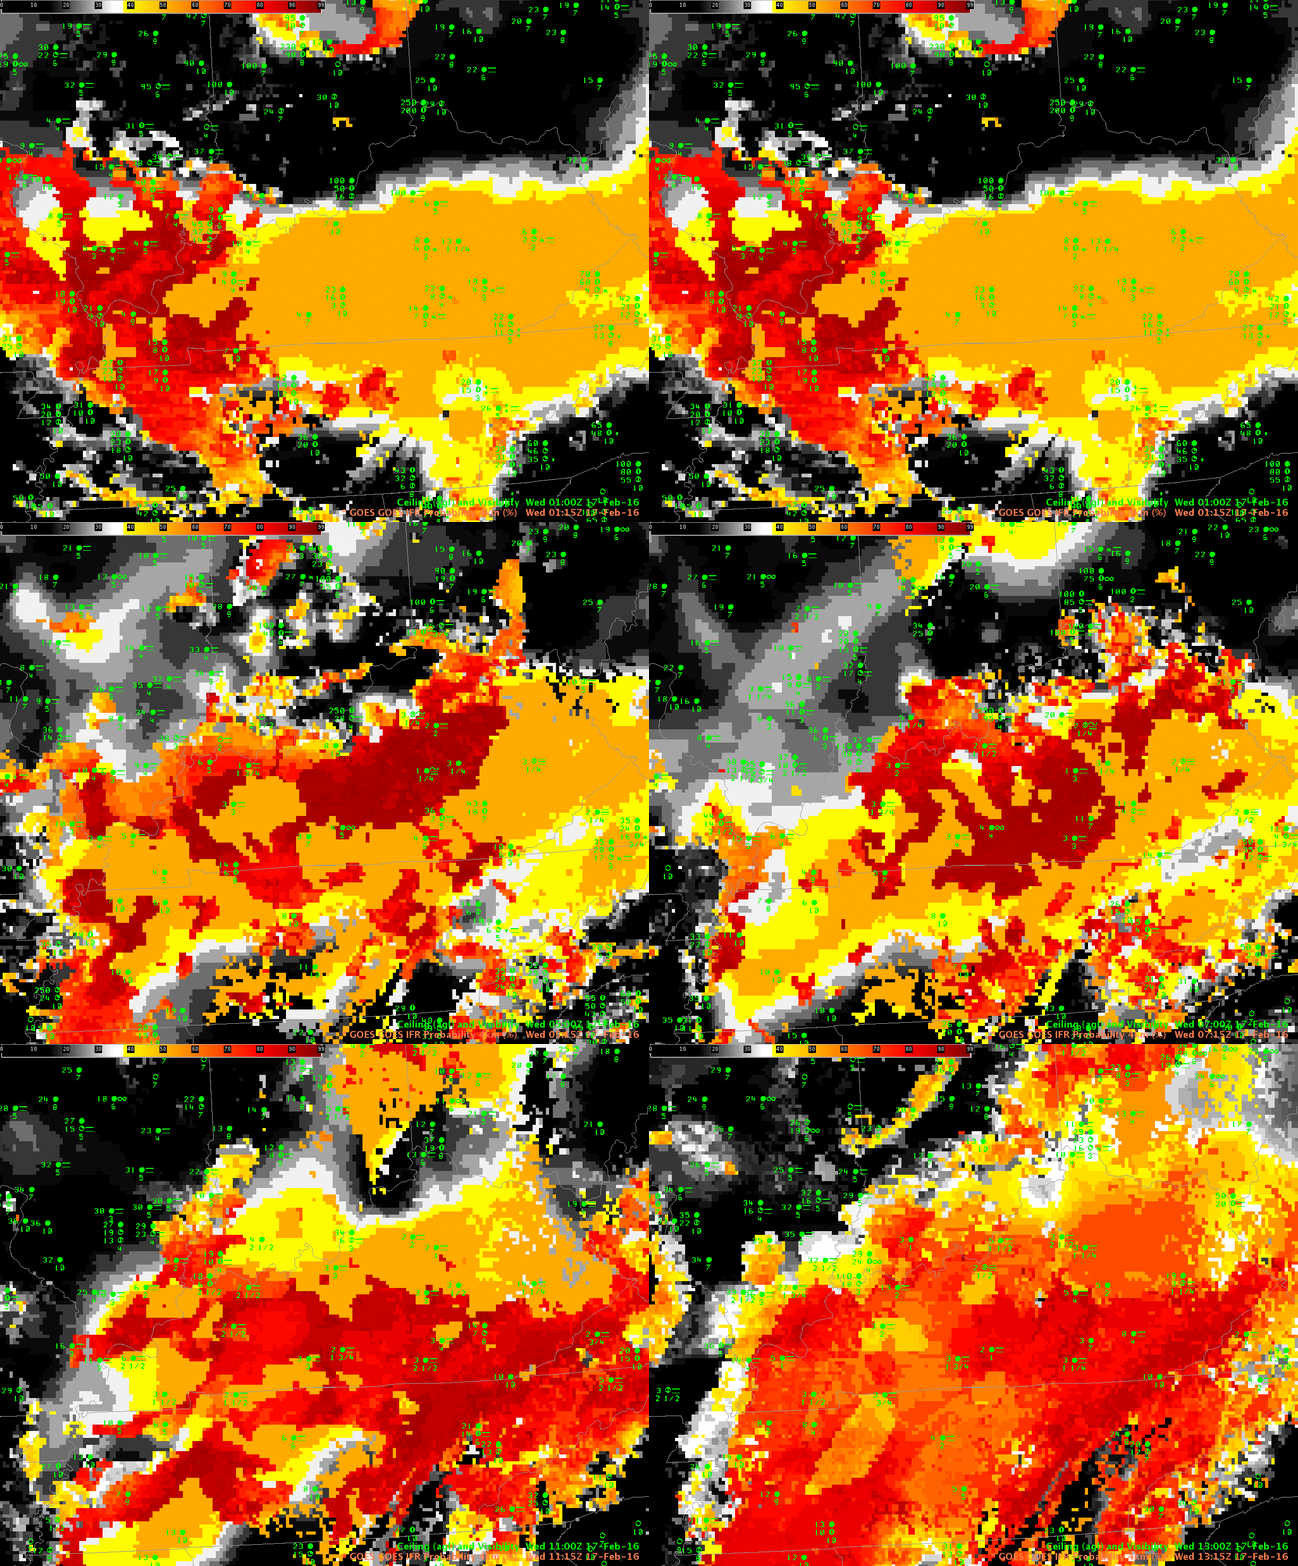
IFRP_0115_1315stepanim_17Feb2016

GOES-R IFR Probability fields, every two hours from 0115 through 1315 UTC on 17 February 2016 (Click to enlarge)

GOES-R IFR Probability fields showed large values over parts of Kentucky and Tennessee during the overnight hours on 16-17 February 2016, as shown in the animation above (every 2 hours from 0115 through 1315 UTC). (IFR or near-IFR Conditions were present over the region of enhanced IFR Probabilities) For much of the overnight hours, mid-level and high clouds prevented an unobstructed satellite view of low clouds, so Rapid Refresh model output was the principle driver in IFR Probabilities. When that happens, the character of the IFR Probability field is less pixelated (it’s a flatter field) and values are smaller. At the end of the animation — 1315 UTC — satellite observations of low clouds have improved and the GOES-R IFR Probability field is (1) more pixelated, as expected when satellite data are used and (2) showing higher values because Satellite Predictors can be used in the computation of IFR Probability.

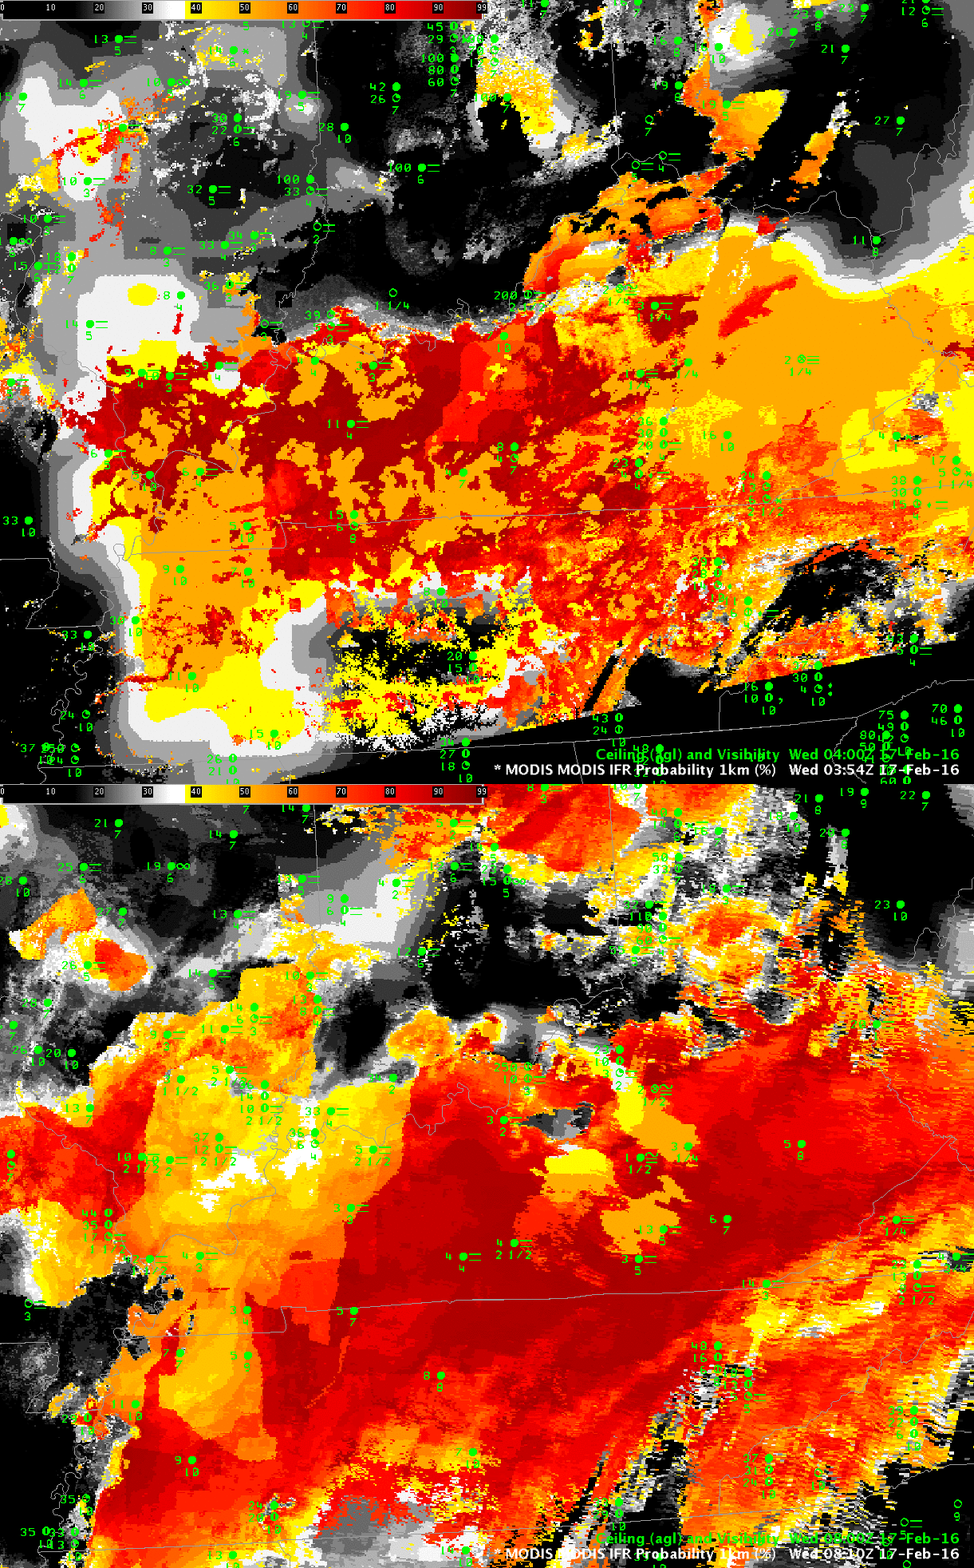
MODIS data from Terra and Aqua satellites can also be used to compute IFR Probability fields, and the high spatial resolution of the MODIS instrument (1-km vs. nominal 4-km on GOES) can yield superior results for valley fogs, for example (The effects of some rivers are apparent in the 0354 UTC image over western Tennessee, for example). For a large-scale event as above, however, GOES-based resolutions can be adequate. The toggle of MODIS-based GOES-R IFR Probabilities at 0354 UTC and 0810 UTC is shown below. Patchy clouds (that prevent MODIS from viewing low clouds) are more apparent in the 0354 UTC image than in the 0810 UTC image.

MODIS_IFRP_0354_0810UTC_17Feb2016toggle

MODIS-based GOES-R IFR Probabilities, 0354 and 0810 UTC on 17 February 2016 (Click to enlarge)

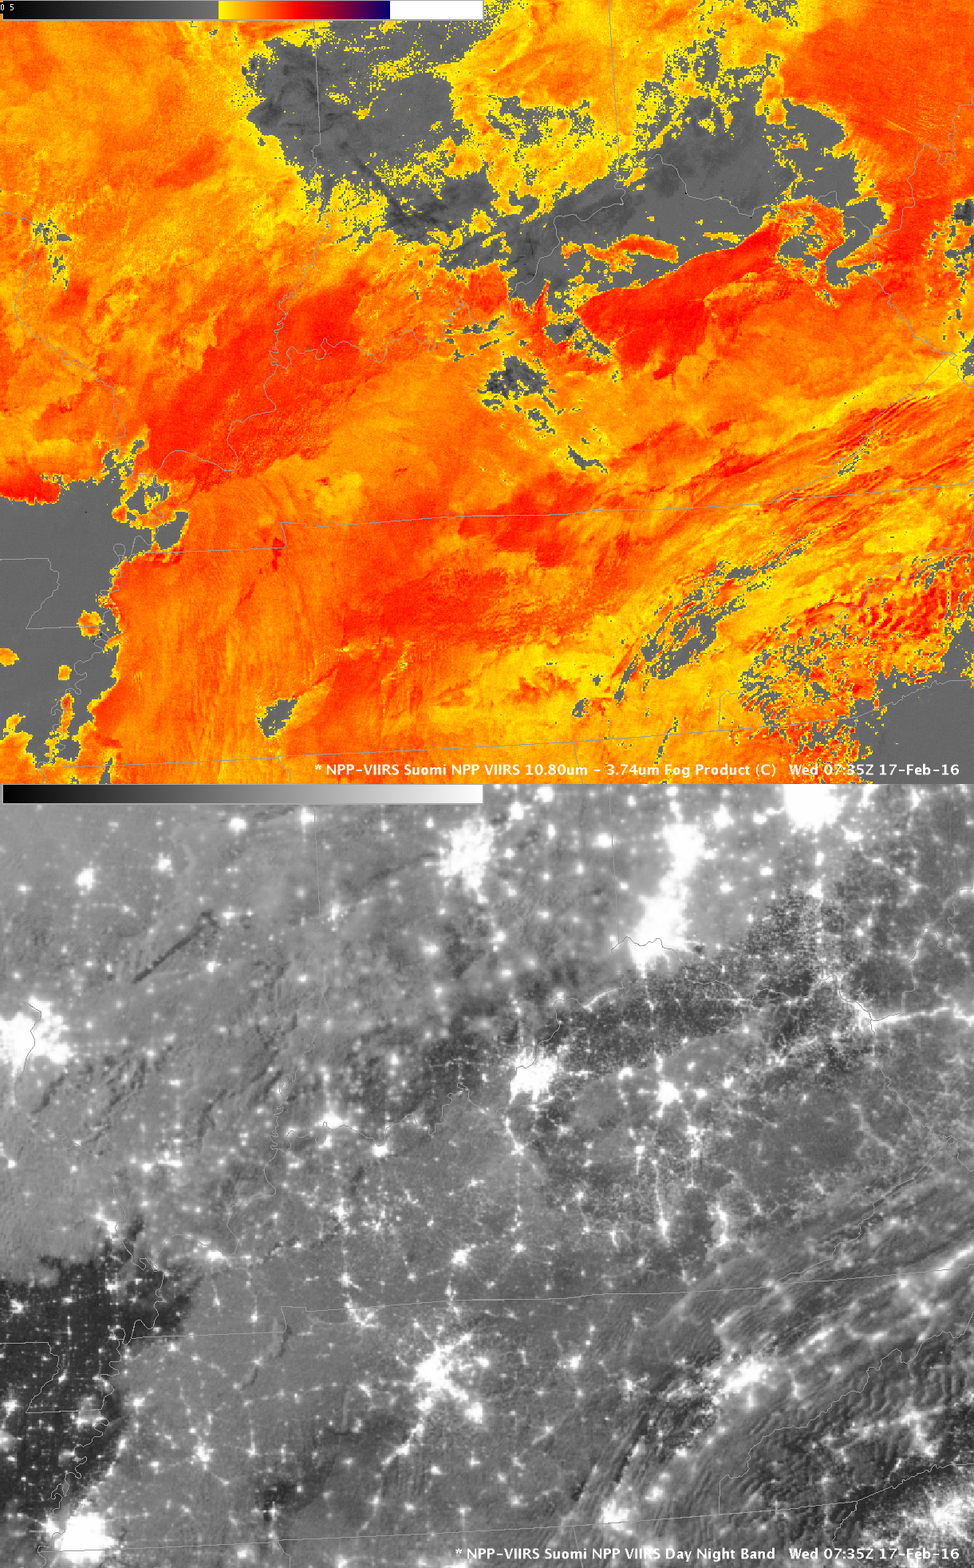
Suomi NPP Overflew the Tennessee River valley just after midnight local time, and the toggle of the Day Night band and the Brightness Temperature Difference field (11.45 – 3.74) is shown below. Extensive cloud cover is apparent. The importance of the IFR Probability fields is that it incorporates surface information (from the Rapid Refresh predictions of saturation in the lowest 1000 feet of the model atmosphere) so that fog and low stratus that impacts transportation by reducing visibilities can be distinguished from mid-level stratus that has a smaller impact.

SNPP_DNB_BTD_0735UTC_17Feb2016toggle

Suomi NPP Brightness Temperature Difference fields (10.8 µm – 3.74 µm) and Day Night band visible imagery (0.70 µm) at 0735 UTC on 17 Feburary 2016 (Click to enlarge)

Small-scale Fog Event near Puget Sound

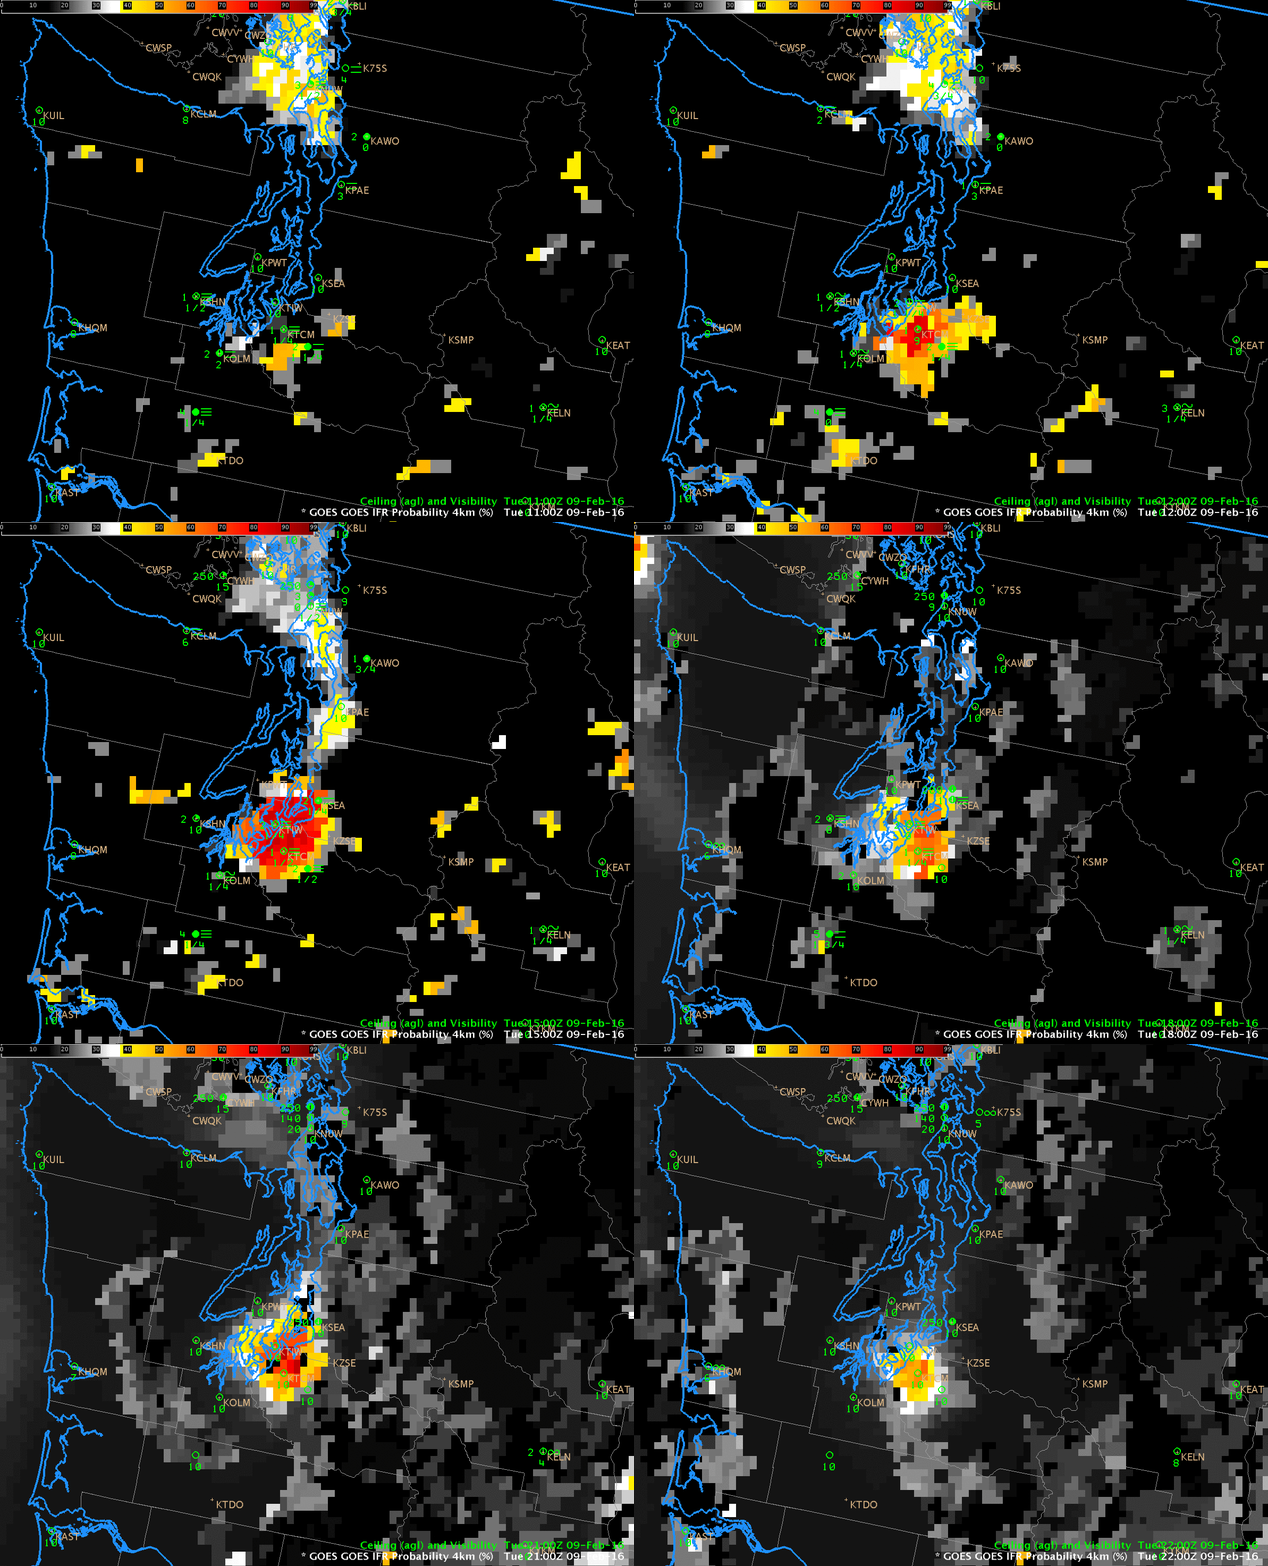
IFRProbability_9Feb_11_22UTCanim

GOES-R IFR Probabilities computed with GOES-15 and Rapid Refresh Data, 1100-2200 UTC on 9 February 2016 (Click to enlarge)

GOES-R IFR probabilities on Tuesday 9 February captured the development of a small-scale fog event in/around the southern part of Puget Sound in Washington State. The animation above shows high IFR Probabilities developing shortly before sunrise and persisting through most of the day in a region including Shelton, Olympia, Tacoma and Seattle.

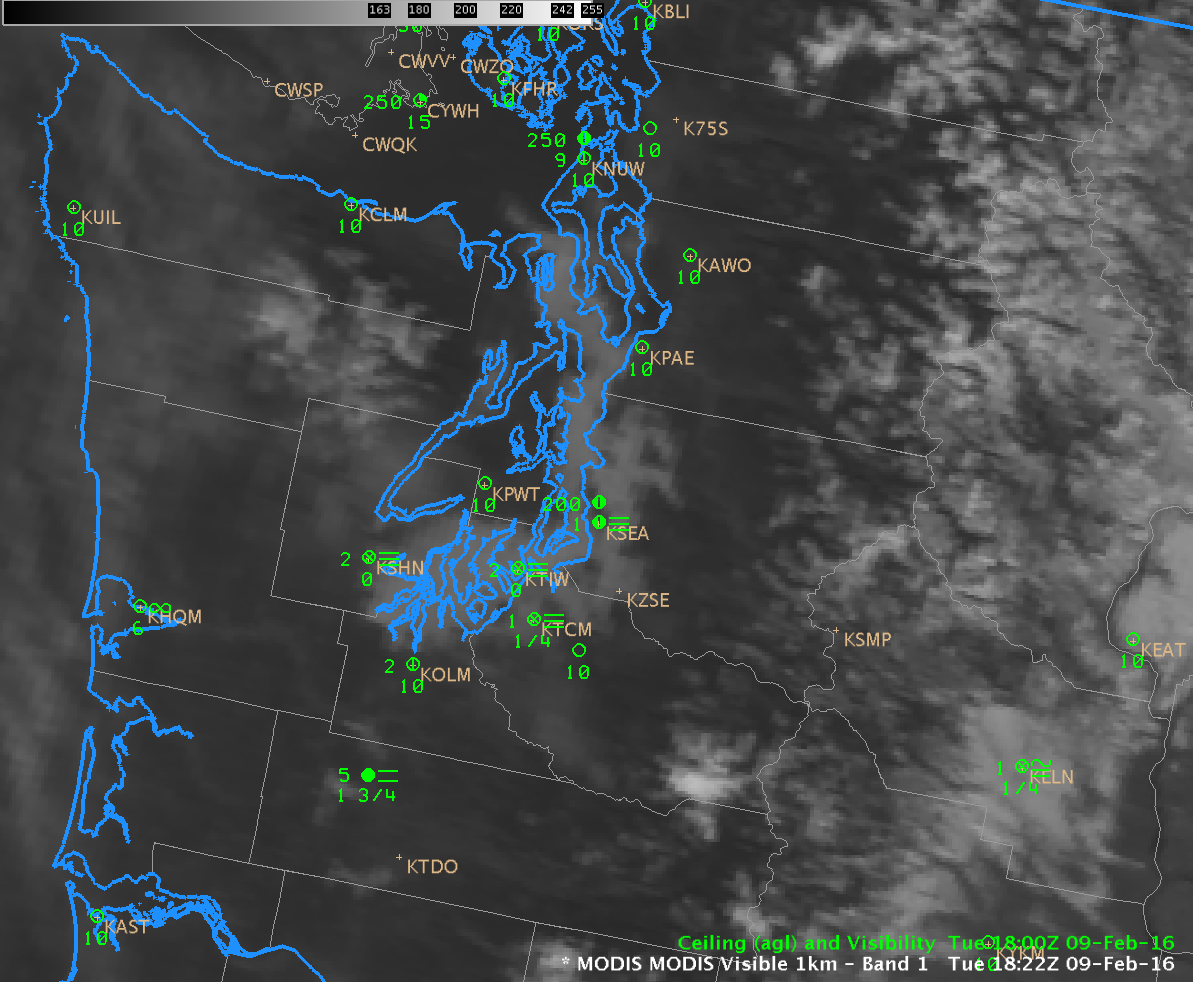
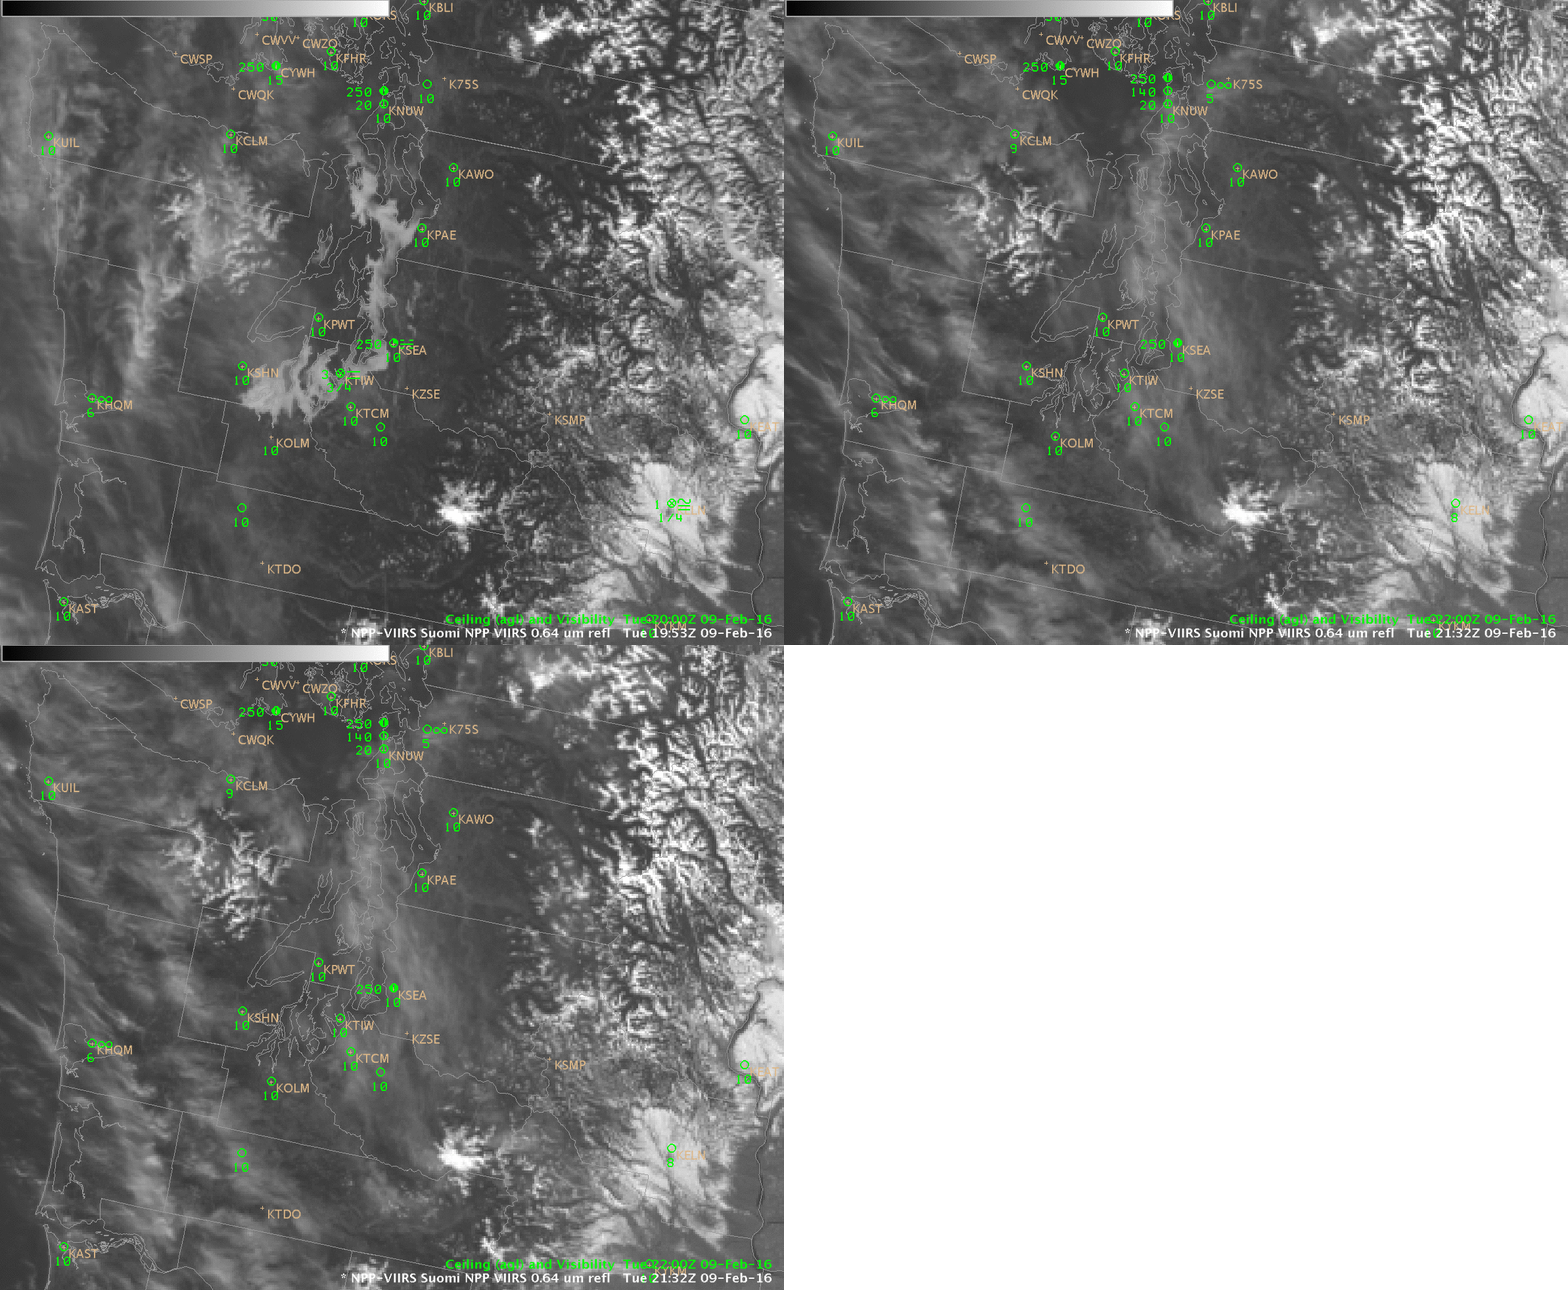
MODIS visible data, below, from the Terra Satellite overpass shortly after 1800 UTC, below, shows the fogbank over the most of Puget Sound, extending inland only over the southern part of the sound.

MODISVIS_1822

MODIS Visible Imagery (0.65 µm), 1822 UTC on 9 February (Click to enlarge)

Suomi NPP viewed Puget Sound on two consecutive overpasses on 9 February, and visible imagery from those passes, just before 2000 UTC and near 2130 UTC, are shown below.  Fog Dissipation is apparent in the later image, which is consistent with the animation of IFR Probability at the top of this post, which animation shows IFR Probabilities declining in value after 2100 UTC.

SNPPVIS_1953_2122step

Suomi NPP Visible Imagery (0.64 µm), 1953 and 2122 UTC on 9 February (Click to enlarge)

Fog and Low Stratus in Idaho’s Snake River Valley

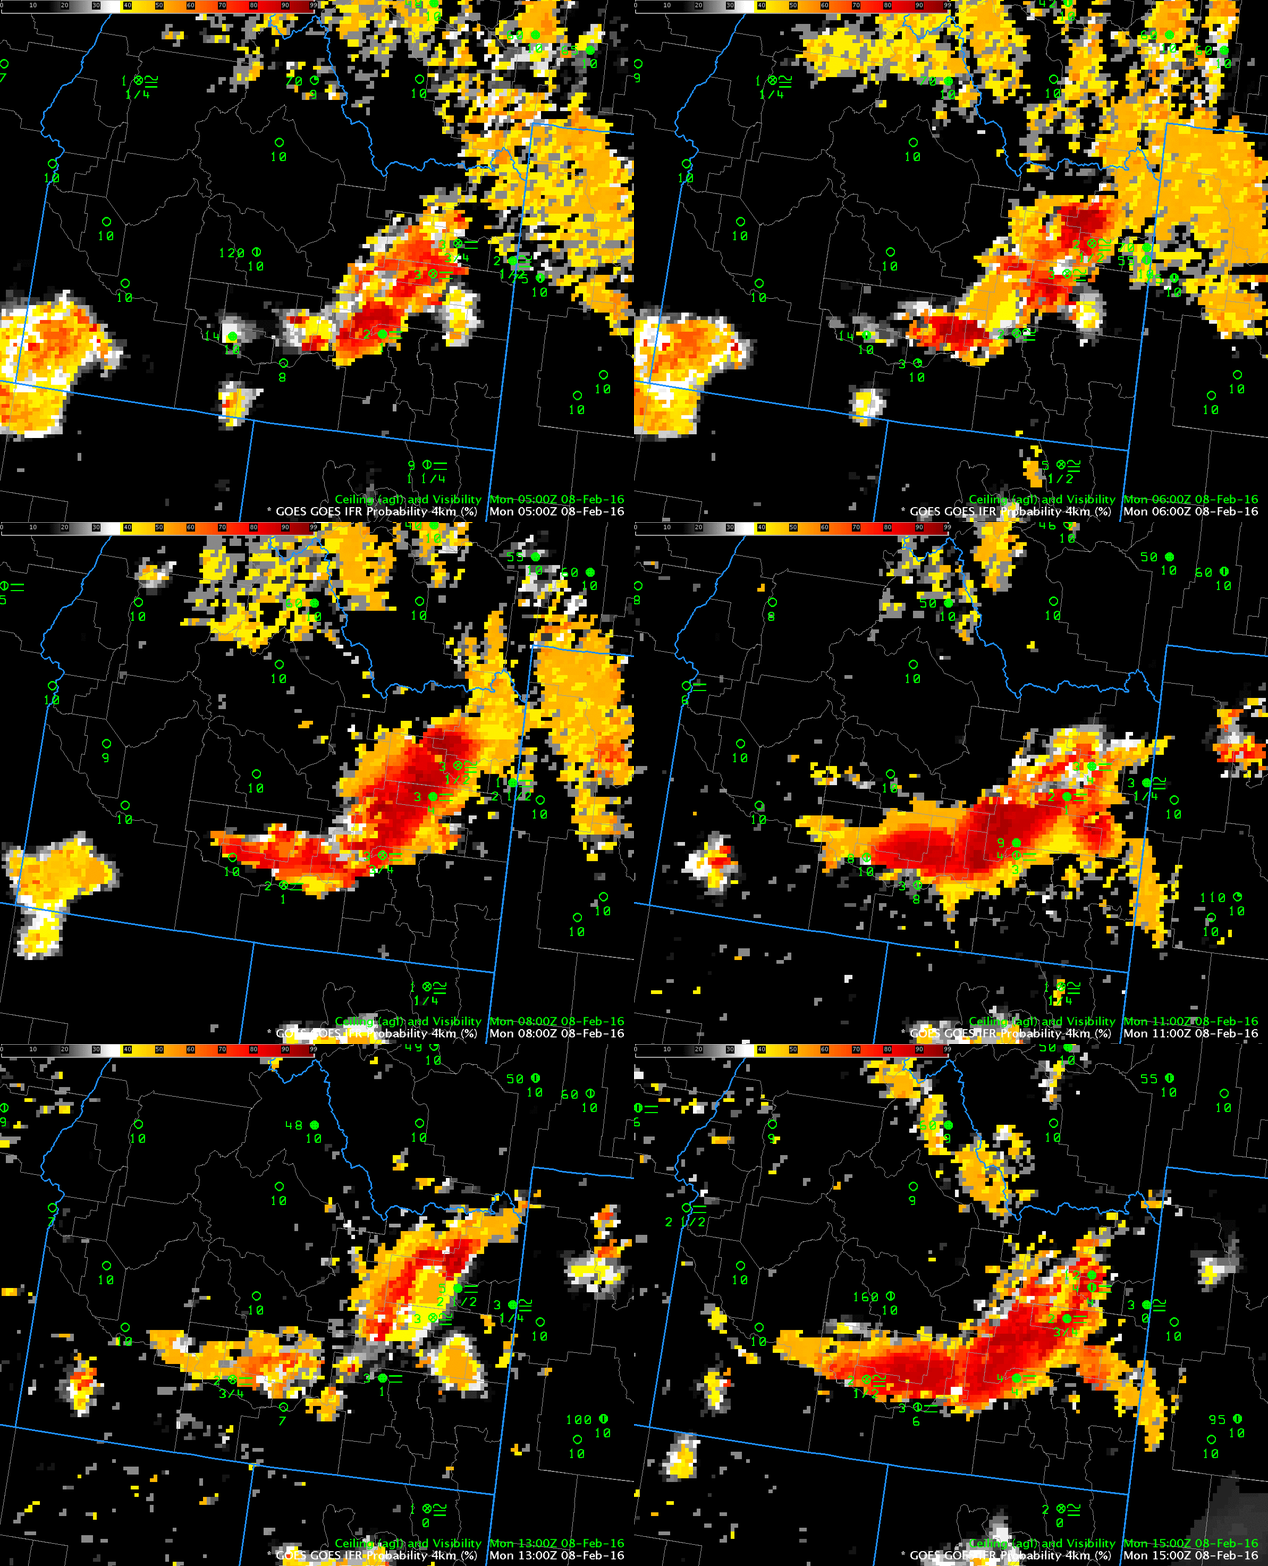
IFRP-0500_1500anim_08feb2016

GOES-R IFR Probability, hourly from 0500 through 1500 on 8 February 2016 (Click to enlarge)

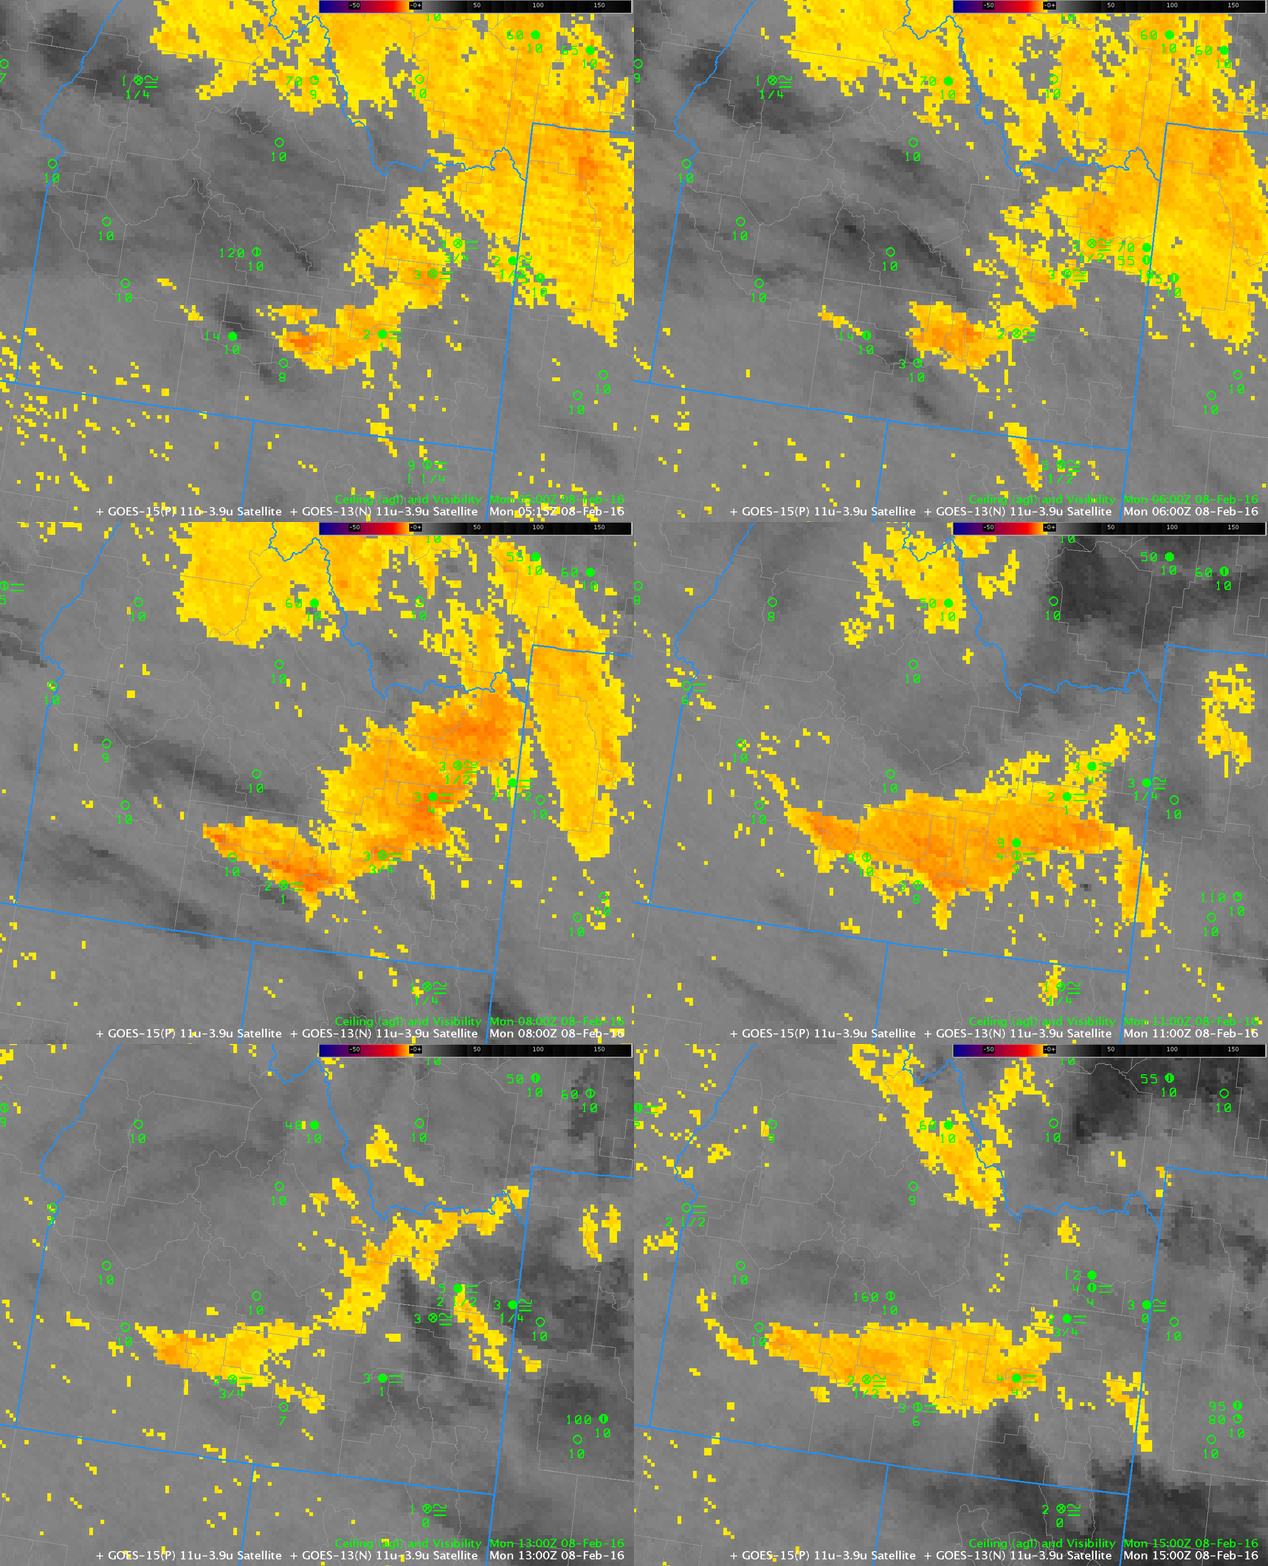
River Valleys will be prone to fog when they are capped by strong High Pressure, as occurred early in the morning on 8 February 2016 over Idaho. The animations, above and below, show GOES-R IFR Probability fields and GOES Brightness Temperature Difference Fields, respectively. GOES-R IFR Probability fields include information from the Rapid Refresh about near-surface saturation. Compare IFR Probabilities at Burley Municipal Airport (KBYI) in Cassia County with those at Jerome County Airport (KJER) between 0800 and 1100 UTC, when visibilities and ceilings at the two airports vary. IFR Probabilities in general are higher when reported ceilings and visibilities are consistent with IFR conditions, and they are lower when IFR conditions are not reported.

Extensive mid-level stratus over the eastern portions of northern Idaho and western Montana have reduced values of IFR Probabilities (compared to the Snake River Valley where IFR Probabilities are large). This is a benefit of a fused product: Information from two sources combined is more powerful than either of the two sources individually. IFR Probability fields also have superior results when mid-level or higher clouds overspread an area. This occurs around 1200-1300 UTC over the northeastern portion of the Snake River Canyon around Rexburg and Idaho Falls, locations that maintain IFR (or near-IFR) conditions although the brightness temperature difference field has little signal. IFR Probabilities remain enhanced in the region, however, with a signal — a less pixelated, flatter field — that suggests only Rapid Refresh Data are being used as predictors of IFR.

BTD-0500_1500anim_08feb2016

GOES Brightness Temperature Difference (10.7µm – 3.9µm), hourly from 0500 through 1500 on 8 February 2016 (Click to enlarge)

IFR Conditions with a Coastal Storm

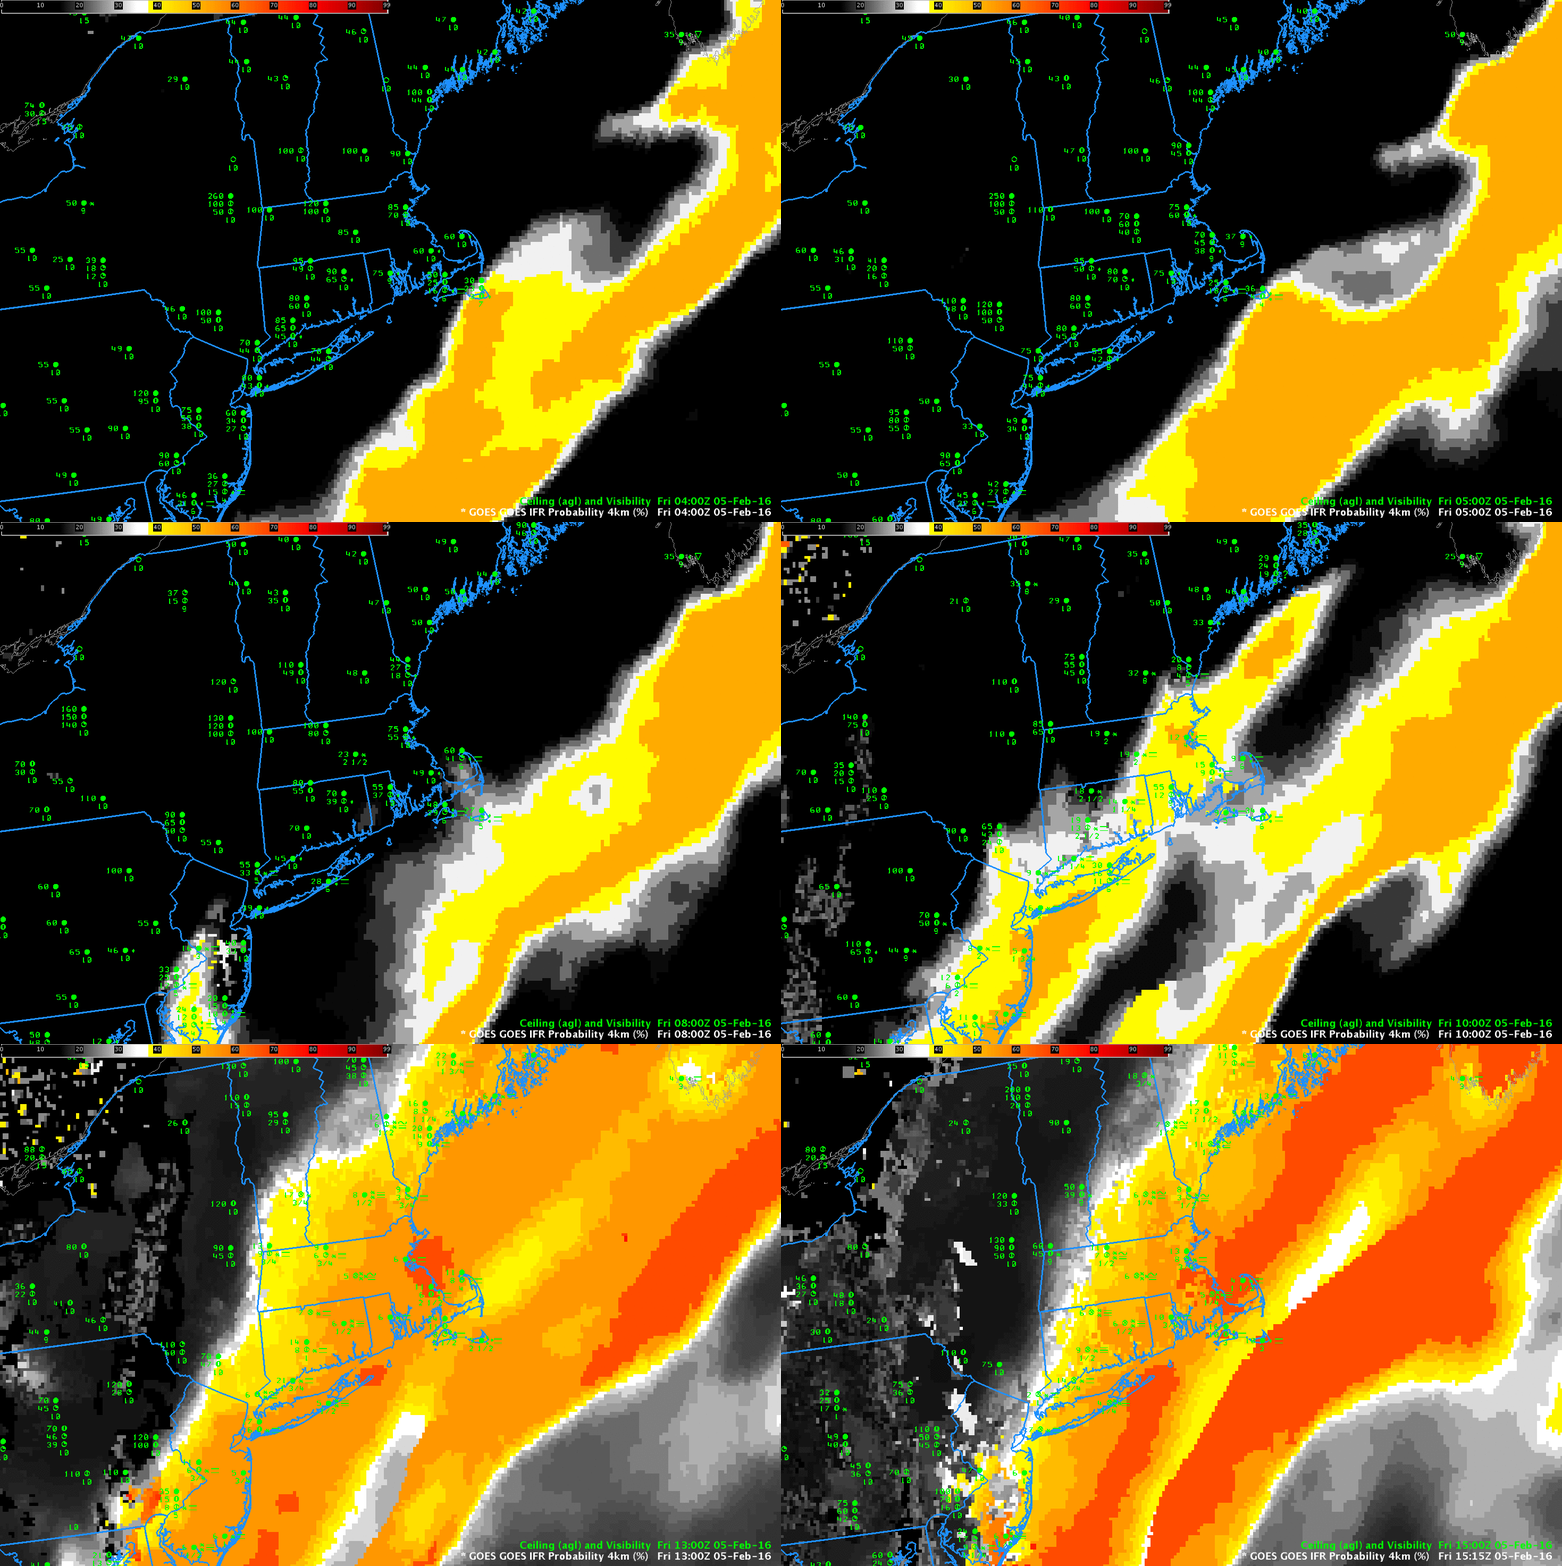
GOES_IFRPanim_0400_1515_05Feb2016

GOES-R IFR Probabilities, hourly from 0400 through 1515 UTC, 5 February 2016 (Click to enlarge)

IFR Conditions frequently occur with storms along the East Coast. Satellite detection of such conditions is very difficult because of the multiple cloud layers that accompany cyclogenesis. The IFR Probabilities, above, have a character that reflects their determination solely from Rapid Refresh Data. That is, Satellite Predictors were not considered over much of New England because of the presence of multiple cloud layers, as suggested in the Water Vapor animation below.

IFR Probability fields are initially entirely offshore in the animation above, and IFR conditions are not observed over southern New England.  Note how IFR probabilities initially increase over land over southern New Jersey and then quickly move northeastward into southern New England as IFR Conditions develop.  Because satellite predictors are unavailable in these regions (on account of the many clouds layers), the simultaneous development of high IFR Probabilities with observed IFR Conditions argues for a good simulation of the observed weather by the Rapid Refresh.  Fused data products such as IFR Probability fields join the strengths of different systems to provide a statistically more robust field than is possible from the individual pieces.

When daytime arrives — at around 1215 UTC in the animation above — a distinct transition is apparent in the GOES-R IFR Probability fields.  This occurs because Satellite Data — visible satellite data — can be used during daytime to articulate the regions of cloudiness with more precision.  Because cloudiness in general is better defined, IFR Probability fields (that require the presence of clouds) increase somewhat, and the color table used emphasizes that change.

WV__0400_1300_05Feb2016anim

GOES-13 Water Vapor 3-hourly Animation, 0400-1300 UTC, 5 February 2016 (Click to enlarge)