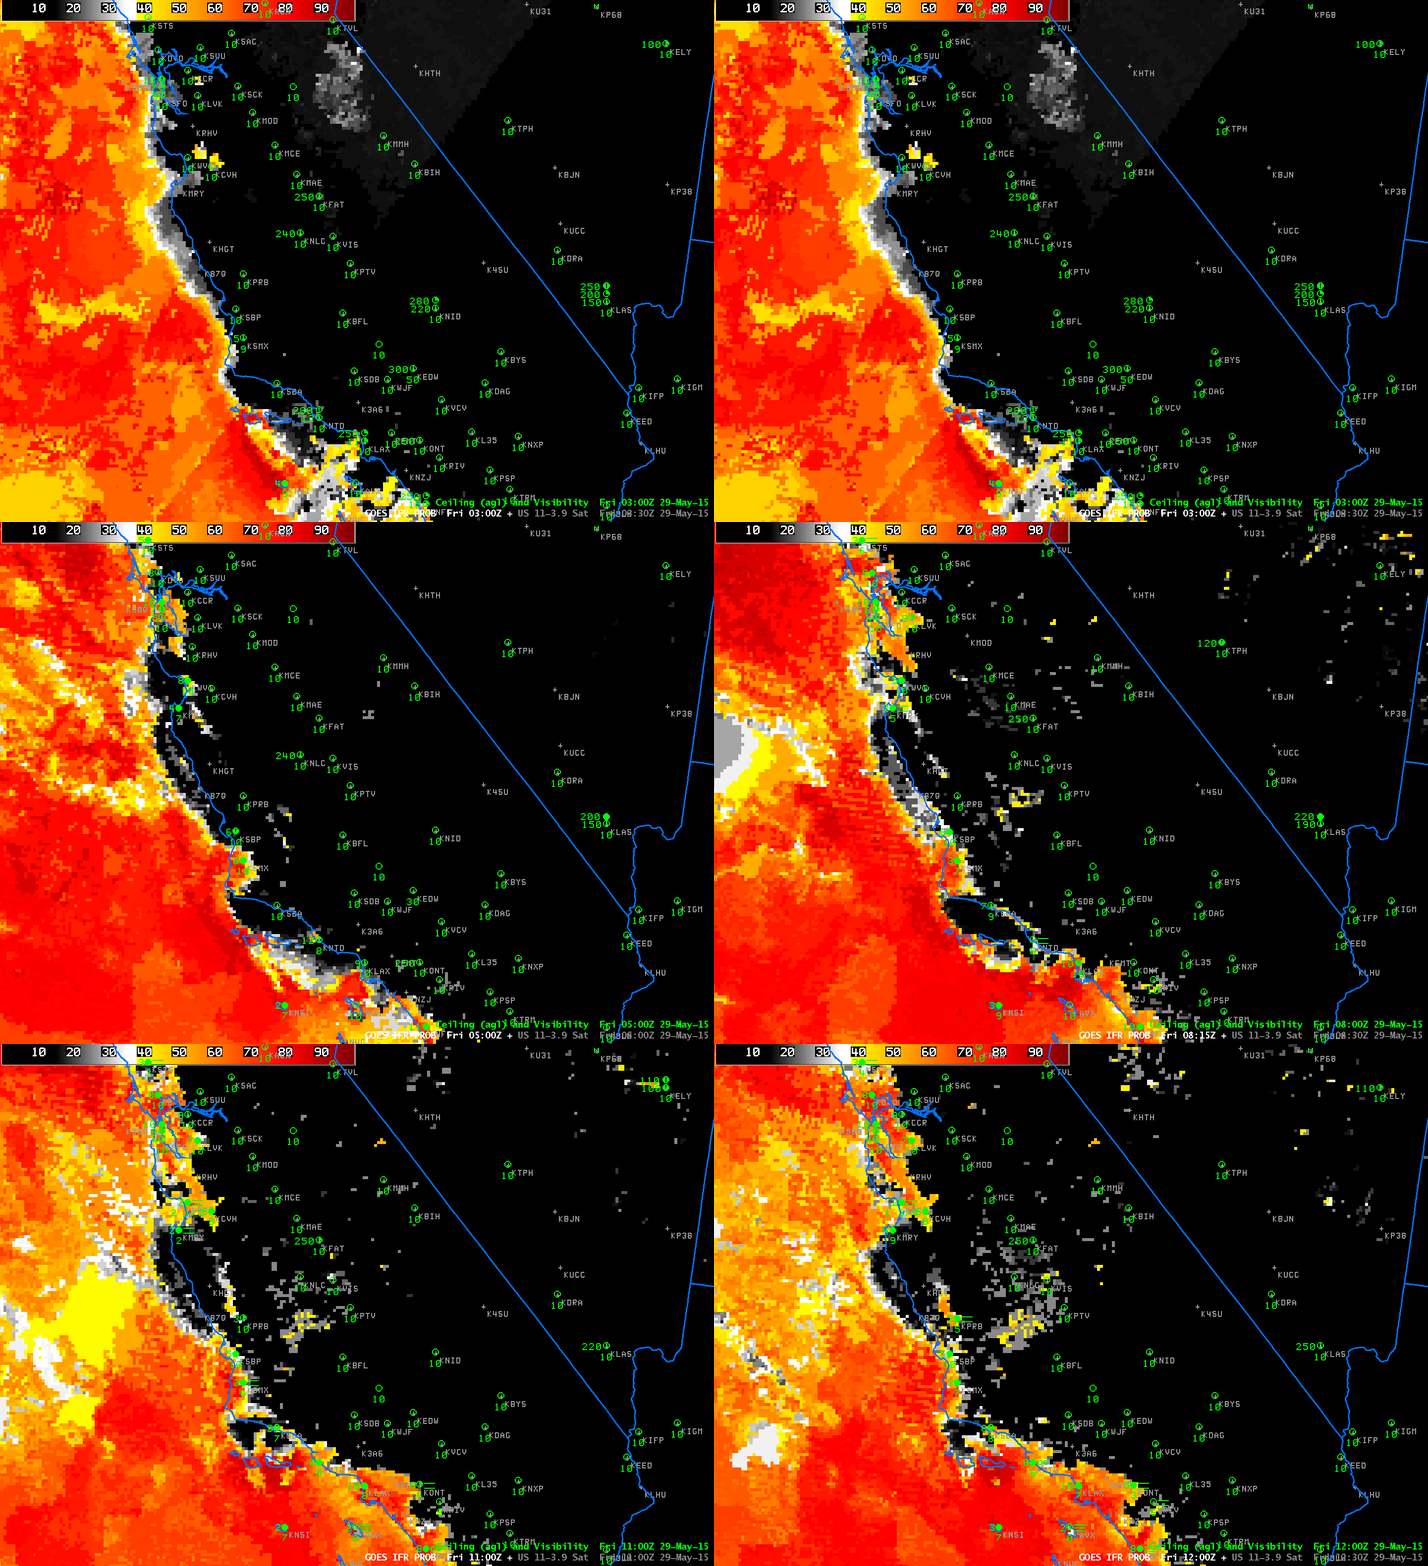
GOES-R IFR Probabilities computed from GOES-West and Rapid Refresh Data, 0300-1200 UTC on 29 May 2015 (Click to enlarge)
GOES-R IFR Probability fields are challenged most days by the diurnal penetration of coastal fog and stratus that occurs overnight along the California Coast. In the animation above, IFR Probabilities increase in regions along the coast, and also in valleys (such as the Salinas Valley) where fog moves inland. Note above how Monterey, Watsonville and Paso Robles all show IFR (or near-IFR) conditions as the IFR Probabilities increase. The same is true farther north at Santa Rosa and at Marin County Airport, and farther south at Avalon, Ontario, Point Mugu and LA International. IFR Probability fields routinely do capture these common fog events.
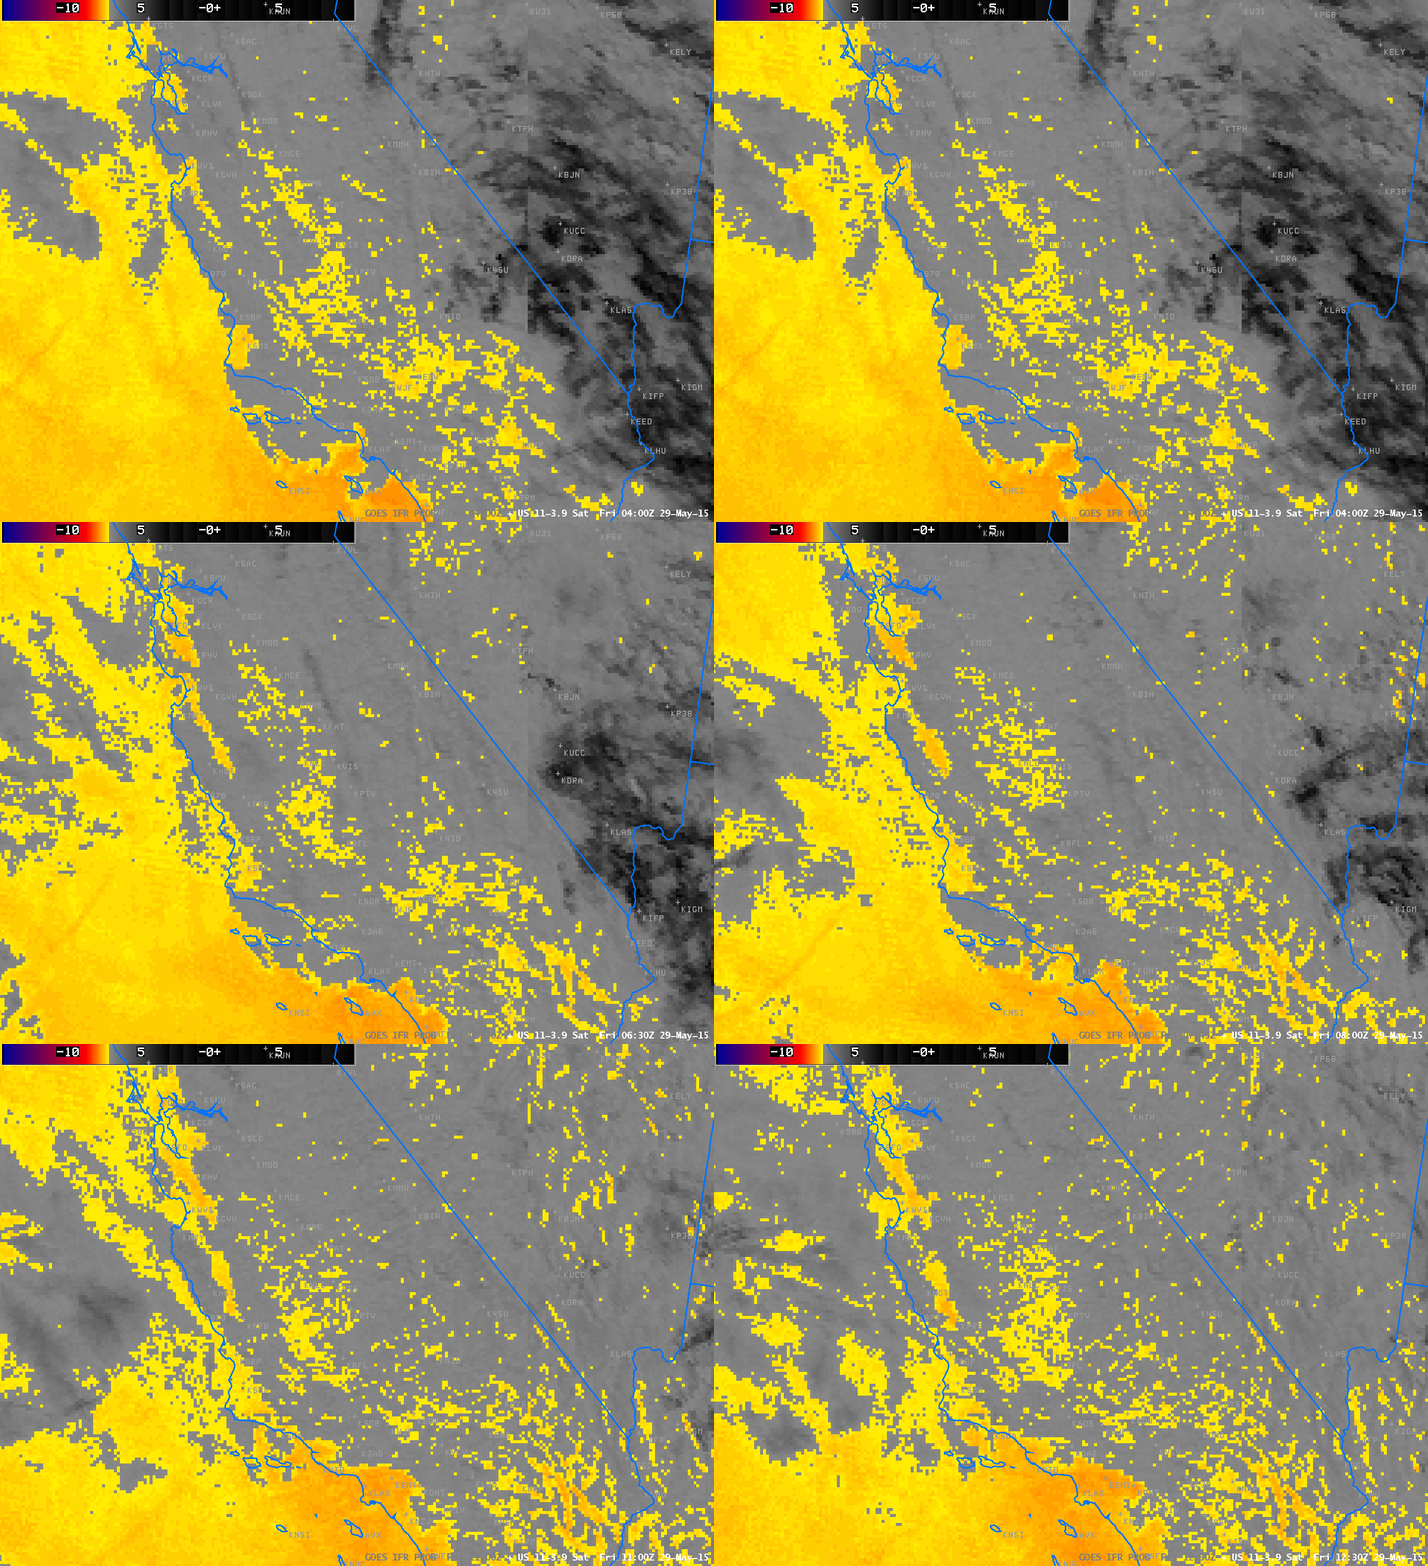
The Brightness Temperature Difference Field (10.7 µm – 3.9 µm), below, captures the motion of these low clouds as well. However, numerous ‘false positive’ signals occur over the central Valley of California (likely due to differences in soil emmissivities). The GOES-R IFR Probability field can screen these regions out because the Rapid Refresh data in the region does not show saturation in the lowest kilometer. Note also how the Brightness Temperature Difference field gives little information about low clouds where high clouds are present (over the Pacific Ocean in the images below). IFR Probability fields, however, do maintain a strong signal there because data from the Rapid Refresh strongly suggests the presence of low clouds/fog.
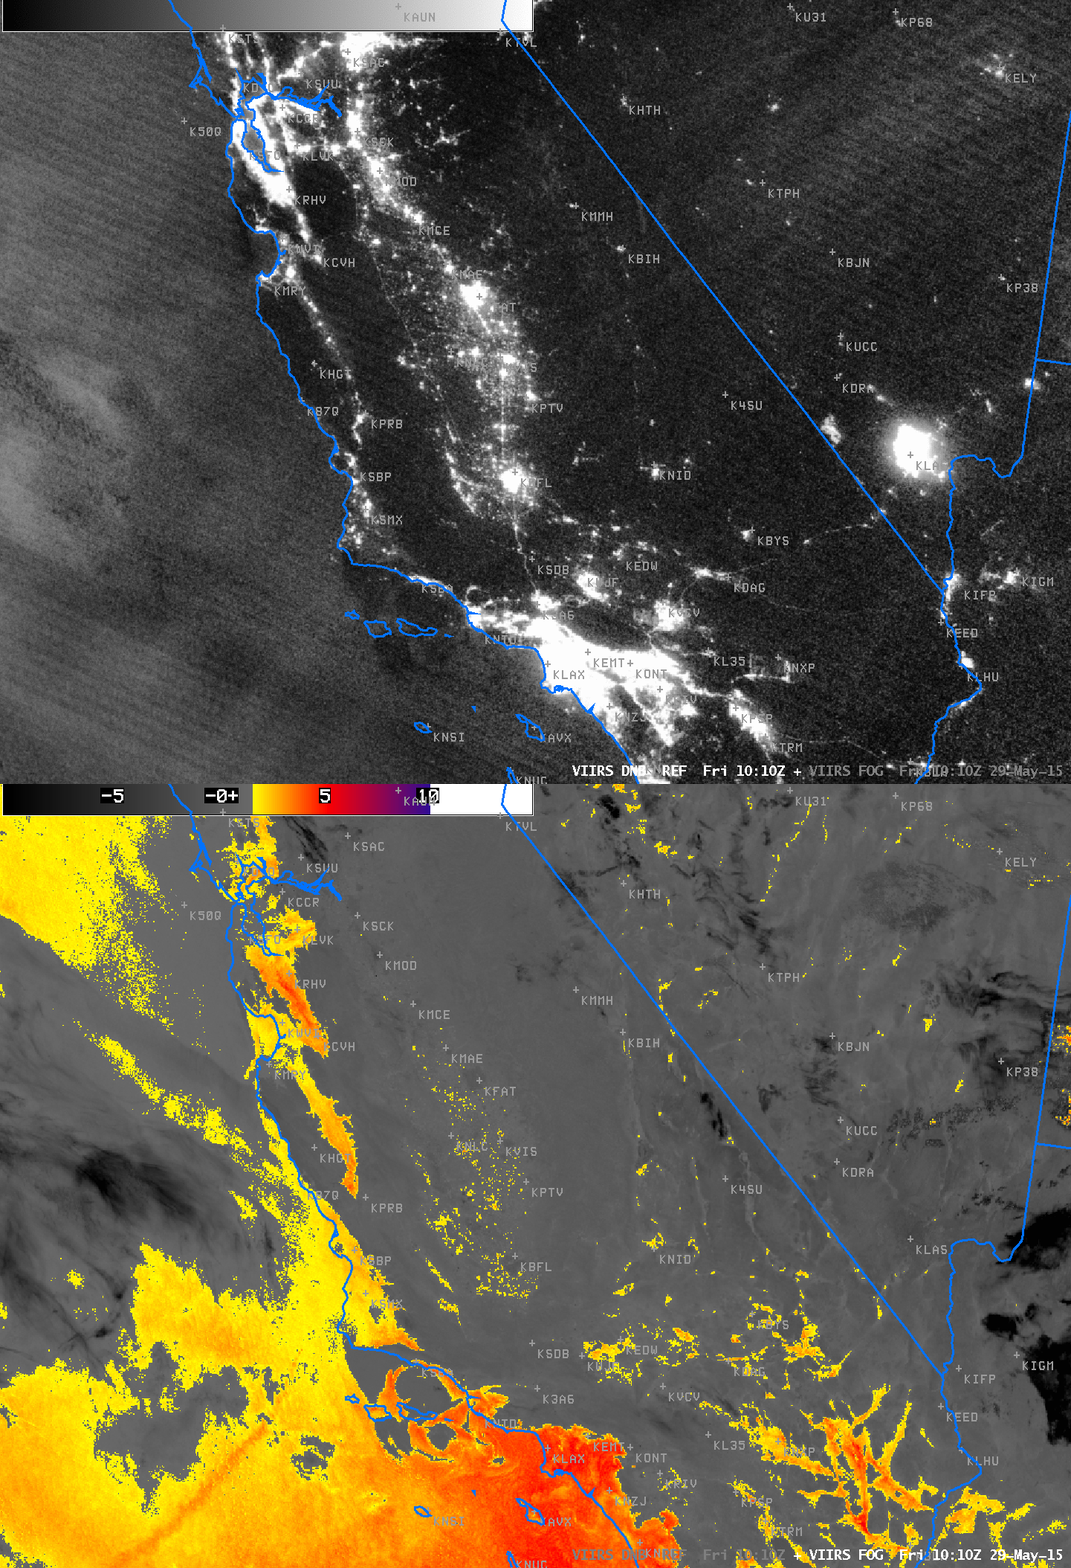
Suomi NPP makes an overflight over the West Coast each day around 1000 UTC, and the toggle of the Day Night Band and the Brightness Temperature Difference field (11.45 µm – 3.74 µm) is shown below. The moon at this time was below the horizon, so illumination of any fog is scant; the brightness temperature difference field does highlight regions of water-based clouds (that is, stratus); however, it does not contain information about the cloud base. In other words, it’s difficult to use the brightness temperature difference product alone to predict surface conditions.

1010 UTC Imagery from Suomi NPP VIIRS Instrument: Day Night Visible Band (0.70µm) and Brightness Temperature Difference Field (11.45µm – 3.74µm) (Click to enlarge)
GOES-14 is in SRSO-R mode, and its view today includes the west coast. The animation below shows the erosion of the fog after sunrise at 1-minute intervals. (Click here for mp4, or view it on YouTube). (Click here for an animation centered on San Francisco).

