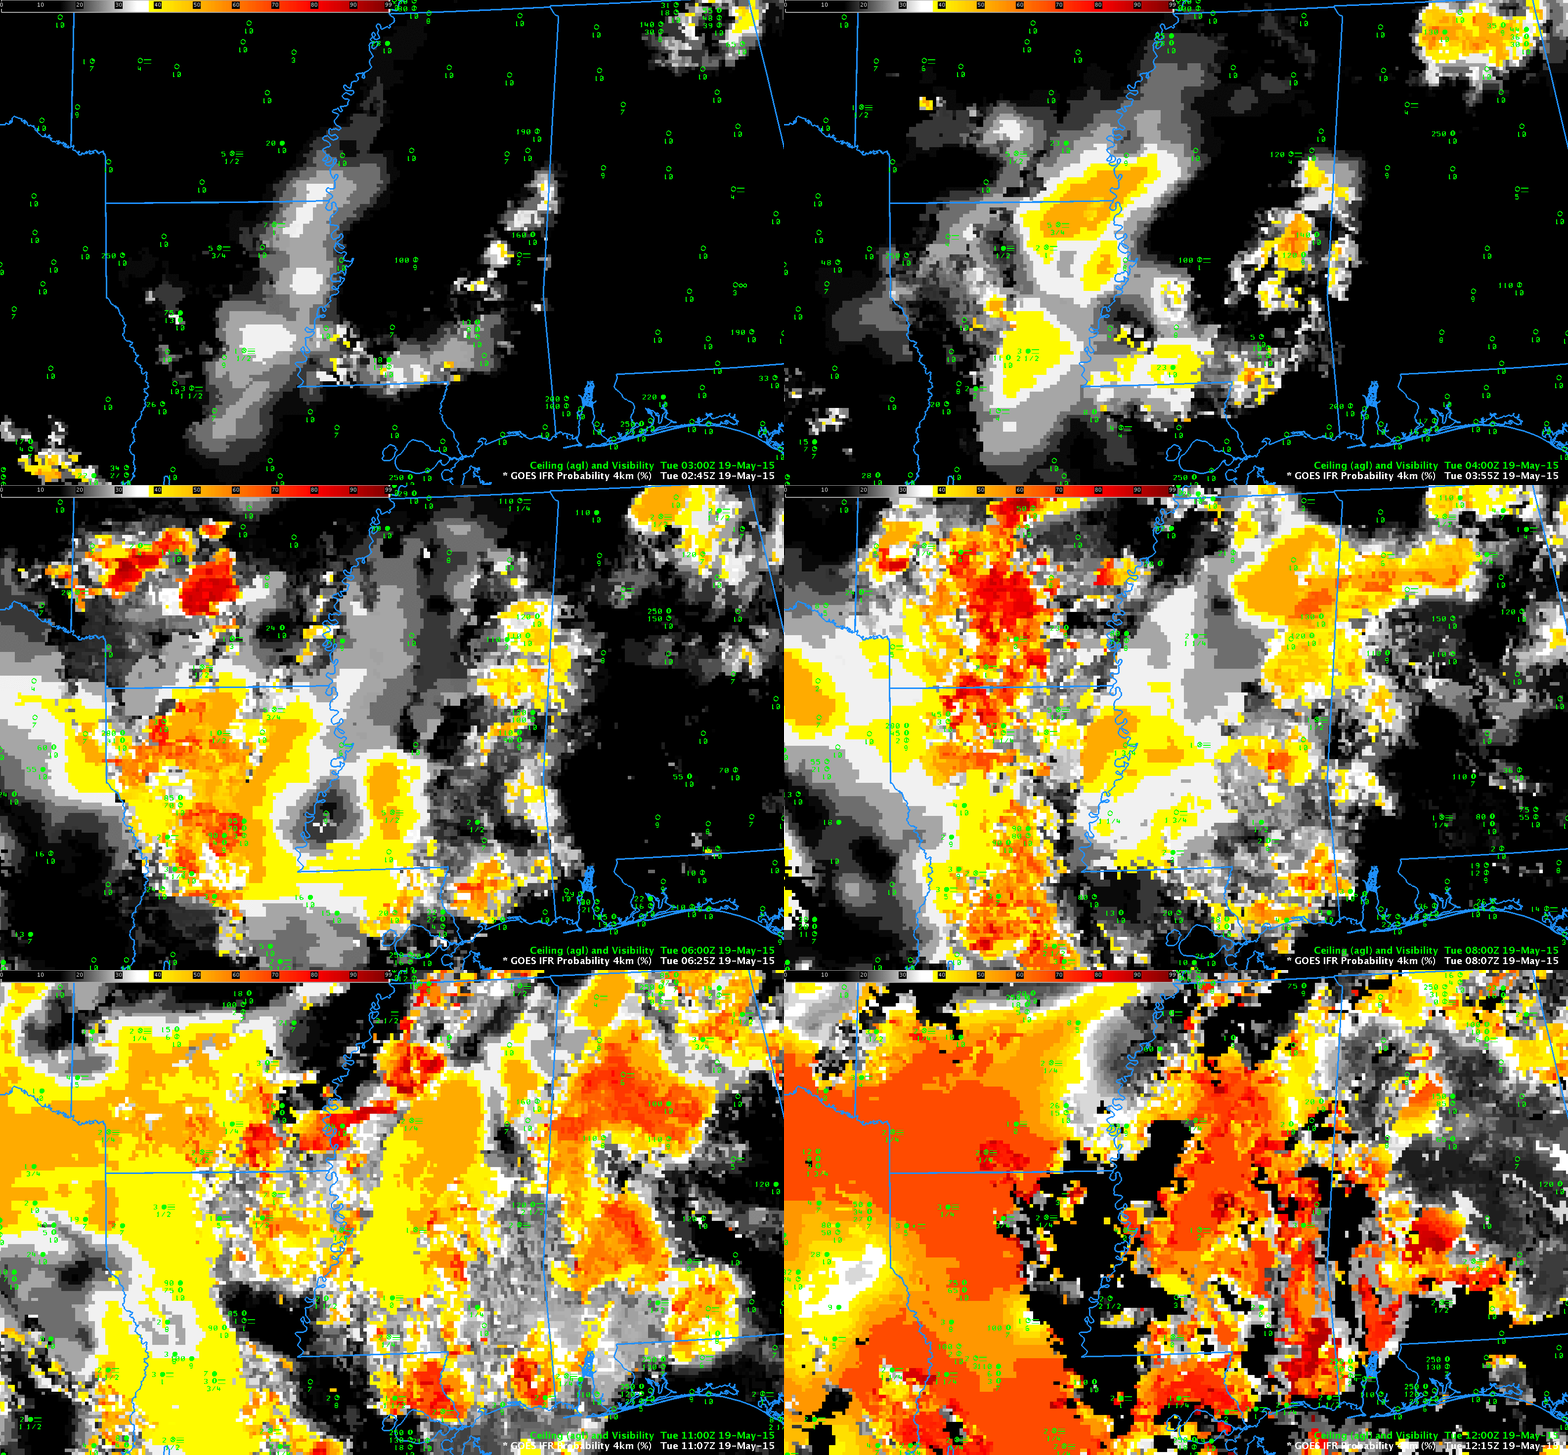
GOES-R IFR Probability Fields, ~hourly, from 0300 through 1200 UTC on 19 May 2015 (Click to enlarge)
Thunderstorms moved through Mississippi (See this animation — from this Blog Post — of SRSO-R 1-minute imagery from 18 May), and the low-level moisture left behind allowed Dense Fog to form, and Dense Fog advisories were issued.
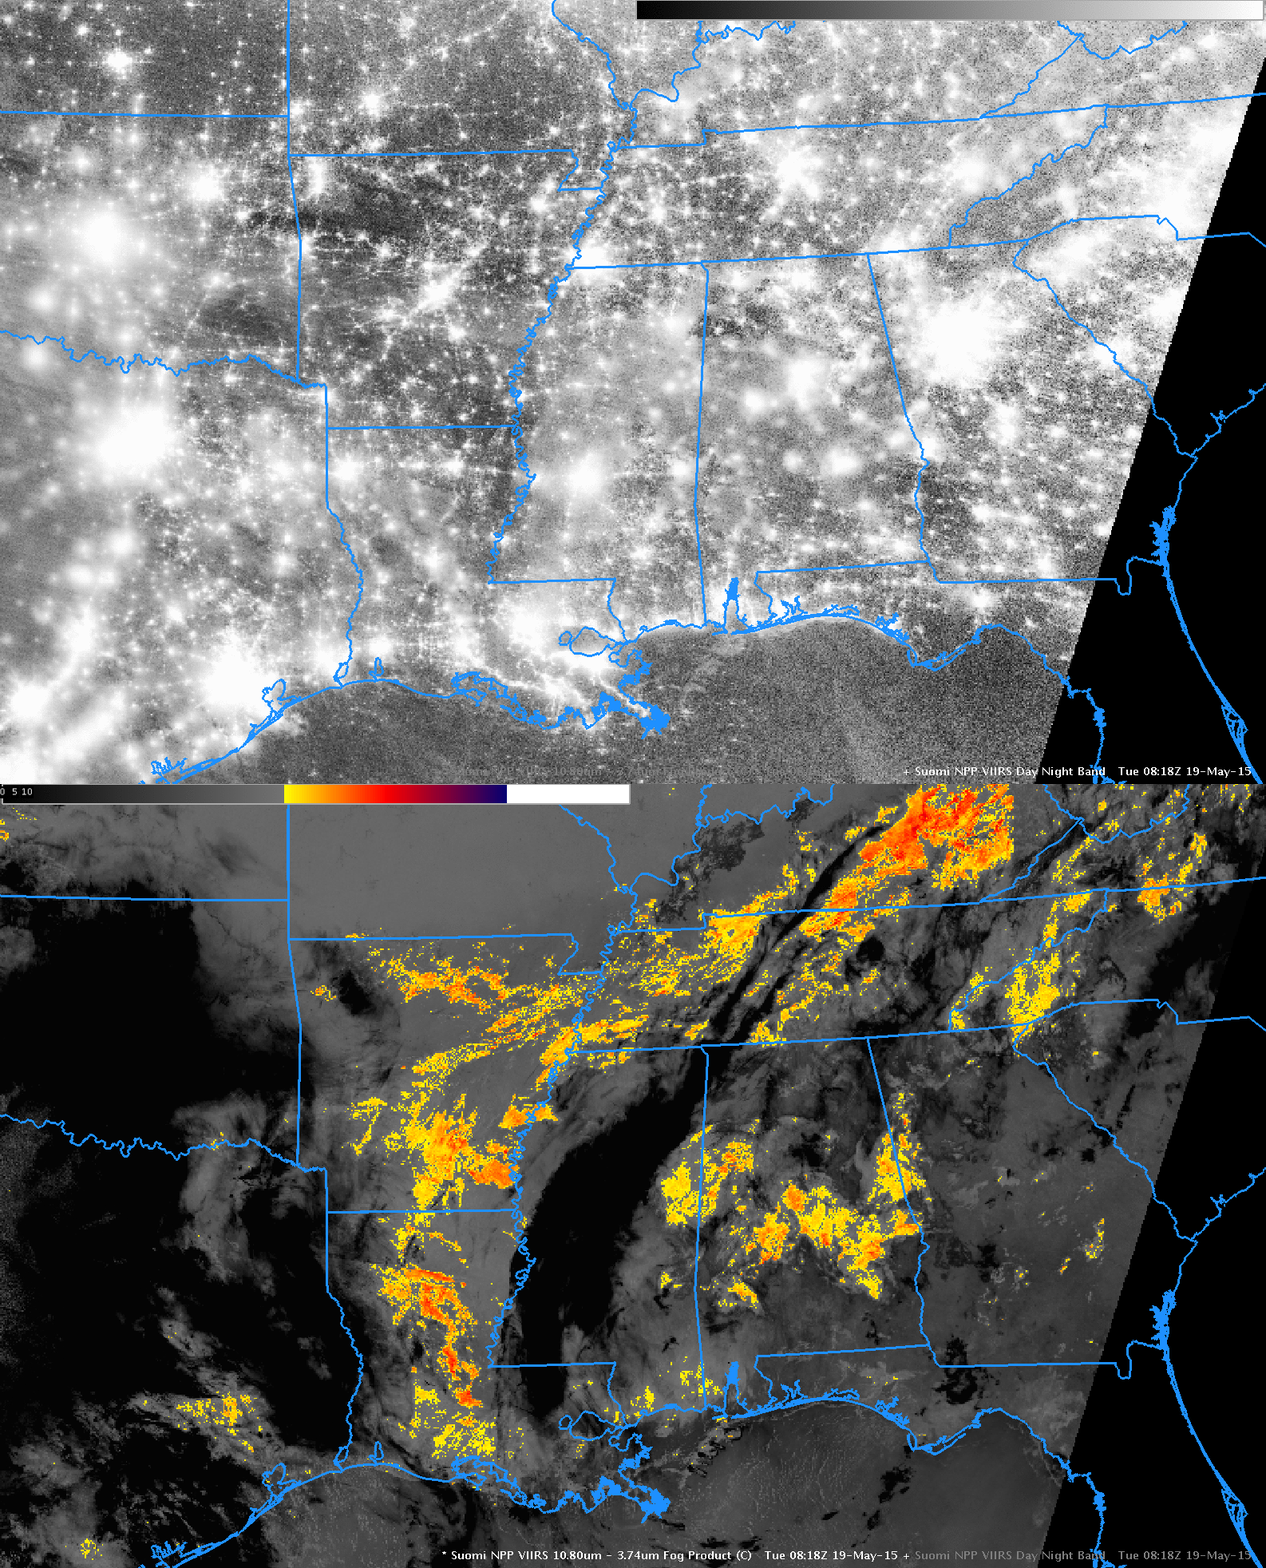
Multiple cloud decks — shown in the toggle, below, of Suomi NPP Day Night Band and Brightness Temperature Difference (11.45 µm – 3.74 µm) — prevented the traditional brightness temperature difference product from providing useful information. GOES-R IFR Probabilities, shown ~hourly in an animation above do highlight the region of developing IFR conditions. Low ceilings and reduced visibilities are commonplace in regions where IFR Probabilities are increasing over night. The predictors that are included to compute the IFR Probabilities are mostly model-based because of the multiple cloud layers that are present, and the IFR Probability field is somewhat flat as a result. Note that GOES-R IFR probabilities increase at the very end of the animation; when daytime predictors are used, probabilities are a bit higher than when nighttime predictors are used.

