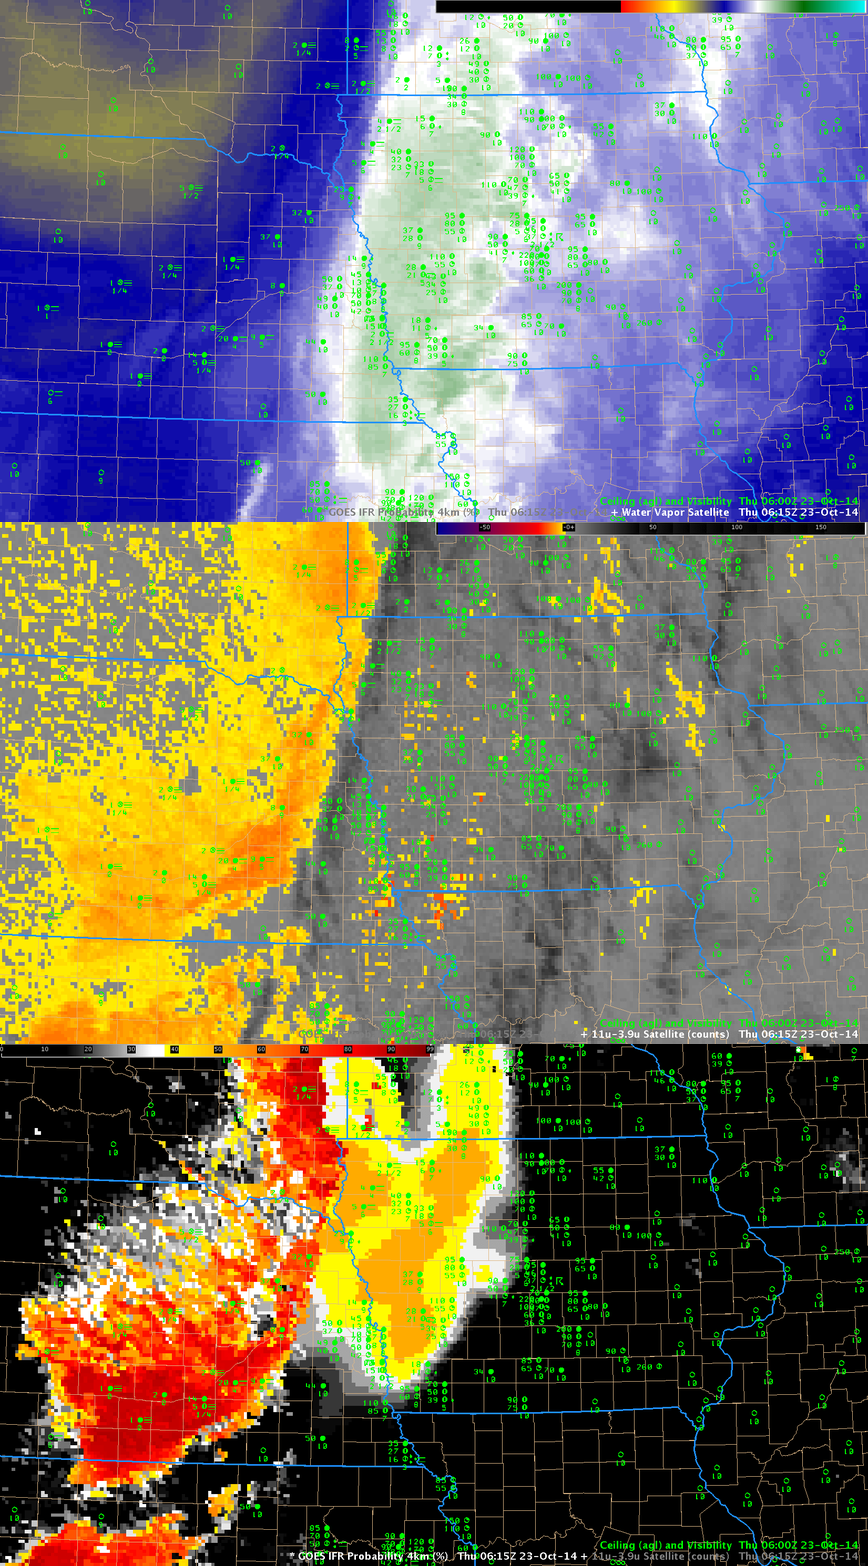
GOES-13 Water Vapor (6.5µm), Brightness Temperature Difference (10.7µm – 3.9µm) and GOES-based IFR Probabilities, all at 0615 UTC 23 October 2014, with surface observations of ceilings and visibilities (click to enlarge)
When a baroclinic system moves through a CWA, drops precipitation and then exits after sunset, the stage is often set for the development of radiation fog. The animation above cycles through the 0615 UTC imagery: GOES-13 Water Vapor (6.5 µm), GOES-13 Brightness Temperature Difference (10.7µm – 3.9µm) and GOES-based GOES-R IFR Probabilities. The upper-level reflection of a surface cold front moving through eastern Nebraska and western Iowa (link) is obvious in the (infrared) water vapor imagery, and also in the brightness temperature difference field.
The difficulty that arises with multiple cloud layers that invariably accompany these systems is that the mid- and high-level clouds do not allow for an accurate satellite-only-based depiction of low stratus and fog. GOES-R IFR Probabilities allow for that kind of depiction because near-surface saturation is considered in the computation of IFR Probabilities (using data from the Rapid Refresh Model). Thus, IFR Probabilities correctly suggest the presence of reduced visibilities over extreme northwestern Iowa and they alert a forecasters to the possibility of fog over much of western Iowa.
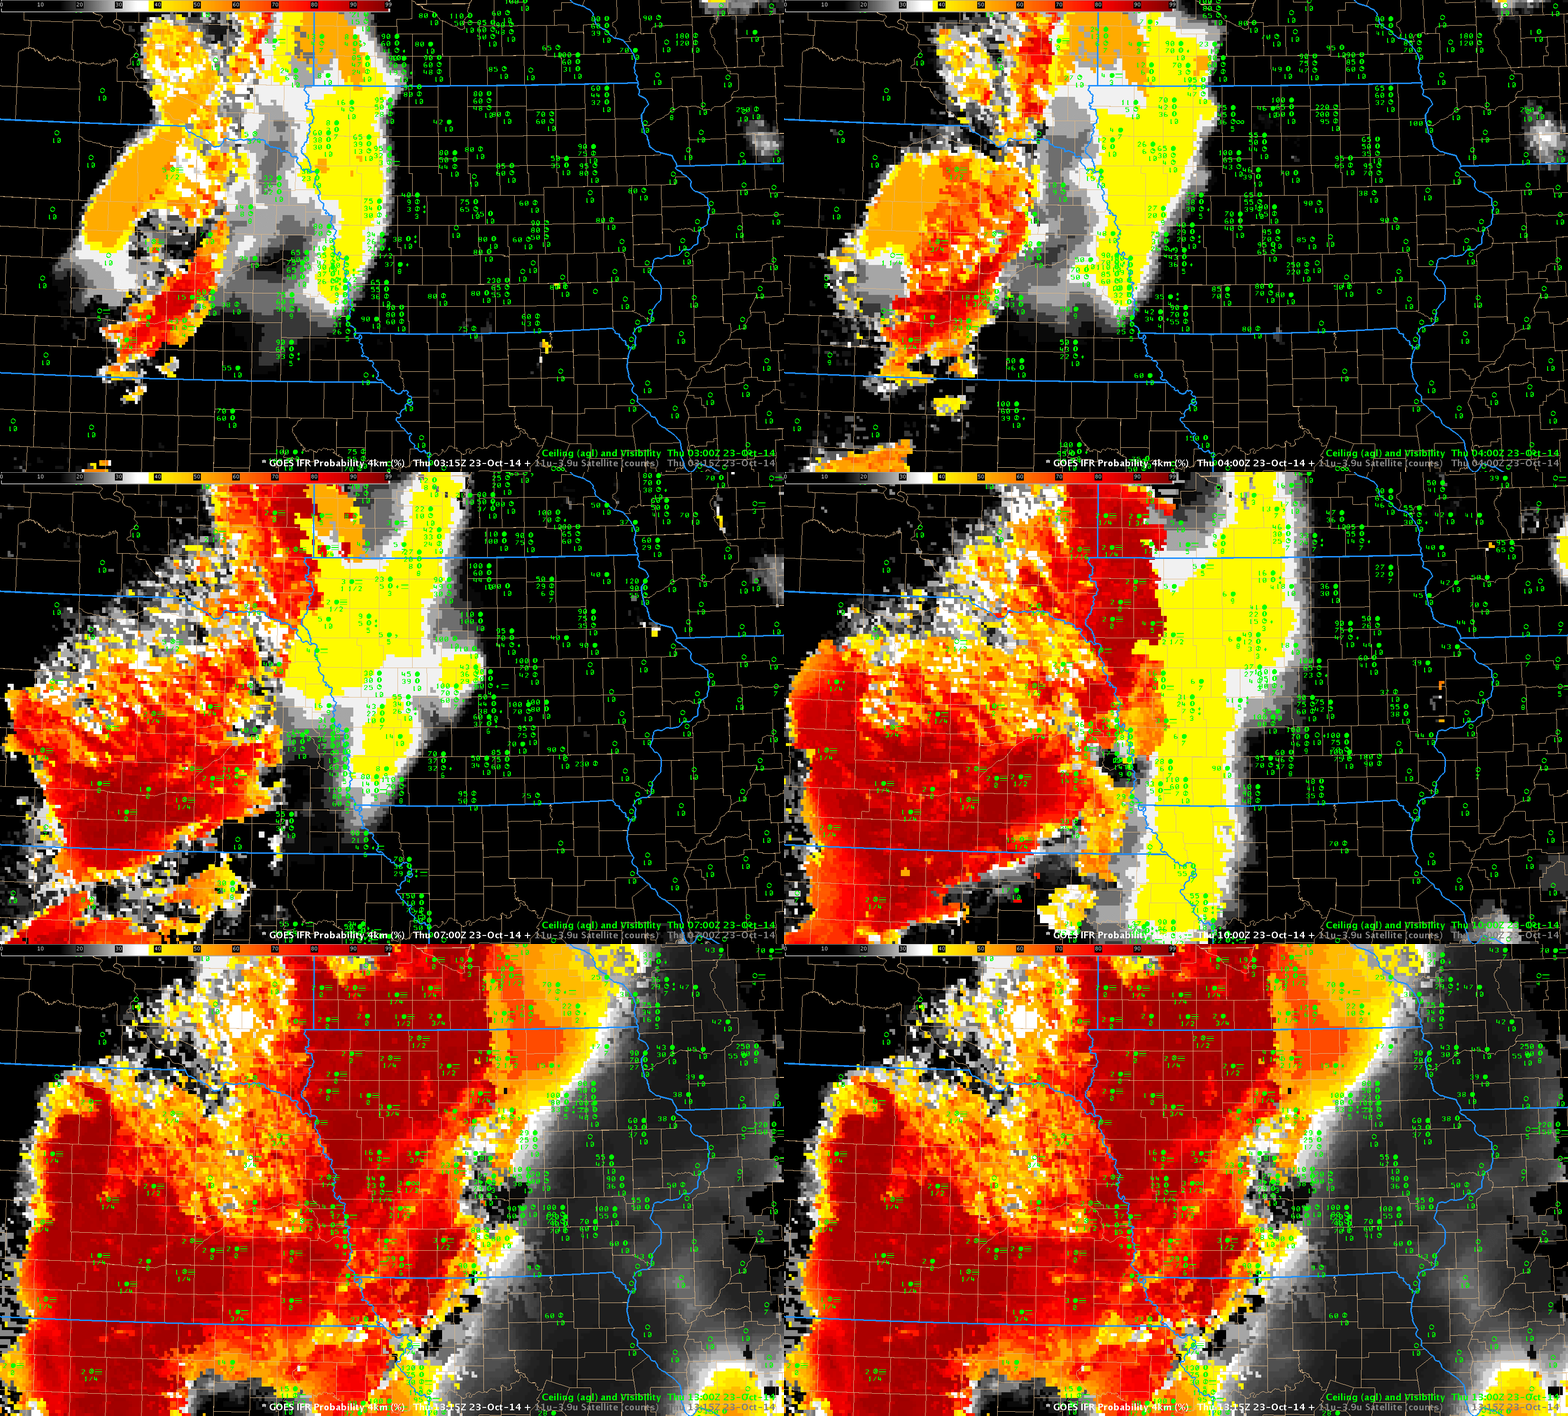
The animation of GOES-R IFR Probability fields, above, shows the steady increase in probability that accompanied the reduction in ceilings and visibilities. The character of the IFR Probability fields is testimony to the data that are used to create them. The fairly flat fields over Iowa early in the animation mean that satellite data cannot be used as a predictor (because of the multiple cloud levels that are present there, as apparent in the animation below). Instead, the model fields (that are fairly flat compared to satellite pixels) are used and horizontal variability in the field is small. In addition, IFR Probability values themselves are somewhat smaller because fewer predictors can be used.
IFR Probabilities are more pixelated in nature over southern Nebraska where satellite-based predictors could be used. IFR conditions are widespread in that region where IFR Probabilities exceed 90%. Note how IFR probabilities are smaller over Kansas, in a region of mid-level stratus (but not fog). The brightness temperature difference field there maintains a strong signal. IFR probability fields do a superior job of distinguishing between mid-level stratus and low stratus/fog (compared to the brightness temperature difference field). This is because a mid-level stratus deck and a fog bank can look very similar from the top, but an accurate Rapid Refresh model simulation of that atmosphere will have starkly different humidity profiles.
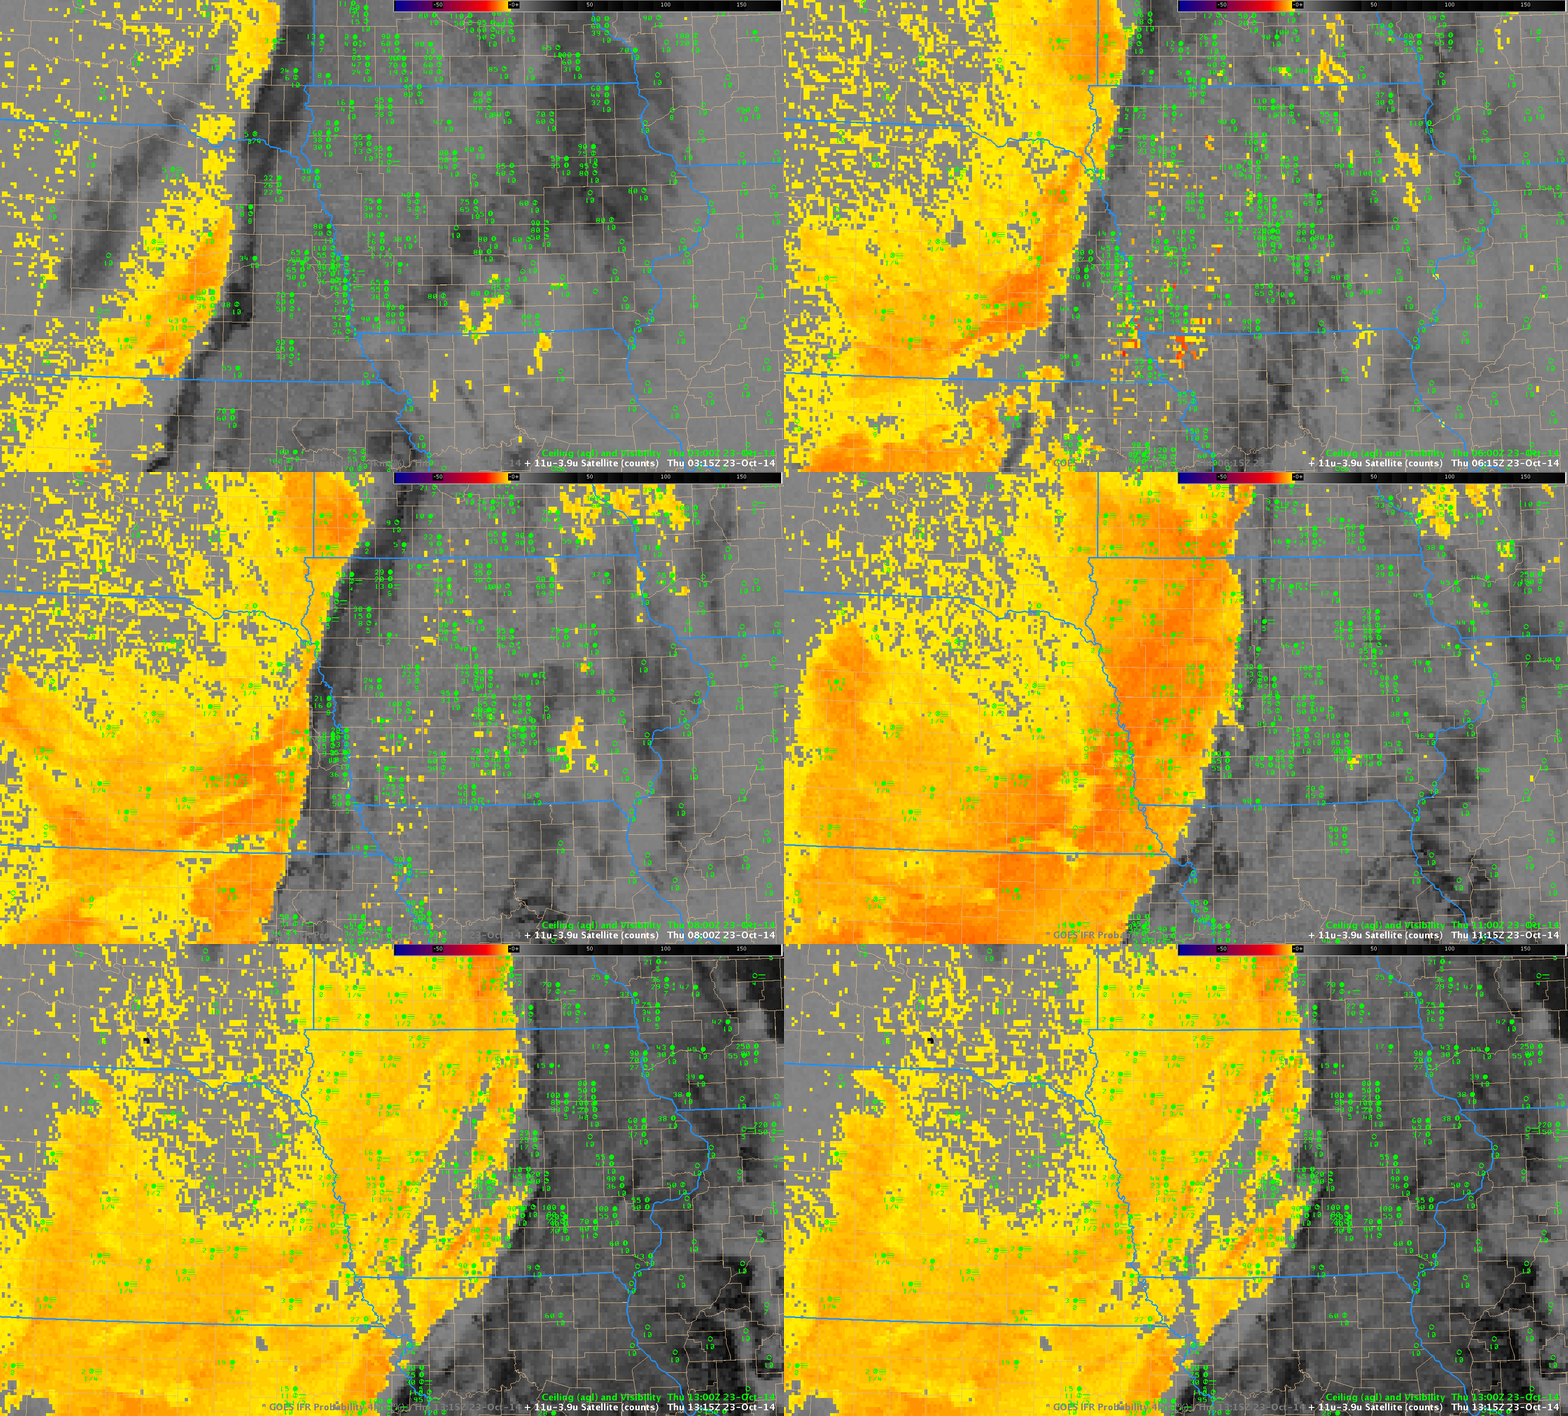
GOES-13 Brightness Temperature Difference (10.7µm – 3.9µm) Fields hourly from 0300 through 1300 UTC 23 October, including surface observations of ceilings and visibilities (Click to enlarge)
At 1400 UTC (below), the rising sun (and its abundant 3.9 µm energy that can be easily scattered off clouds) causes the sign of the brightness temperature difference field to flip. (Compre the 1400 UTC Brightness Temperature Difference Field below to the final Brightness Temperature Difference field (1300 UTC) in the animation above!) However, the IFR Probability field maintains its character through sunrise.
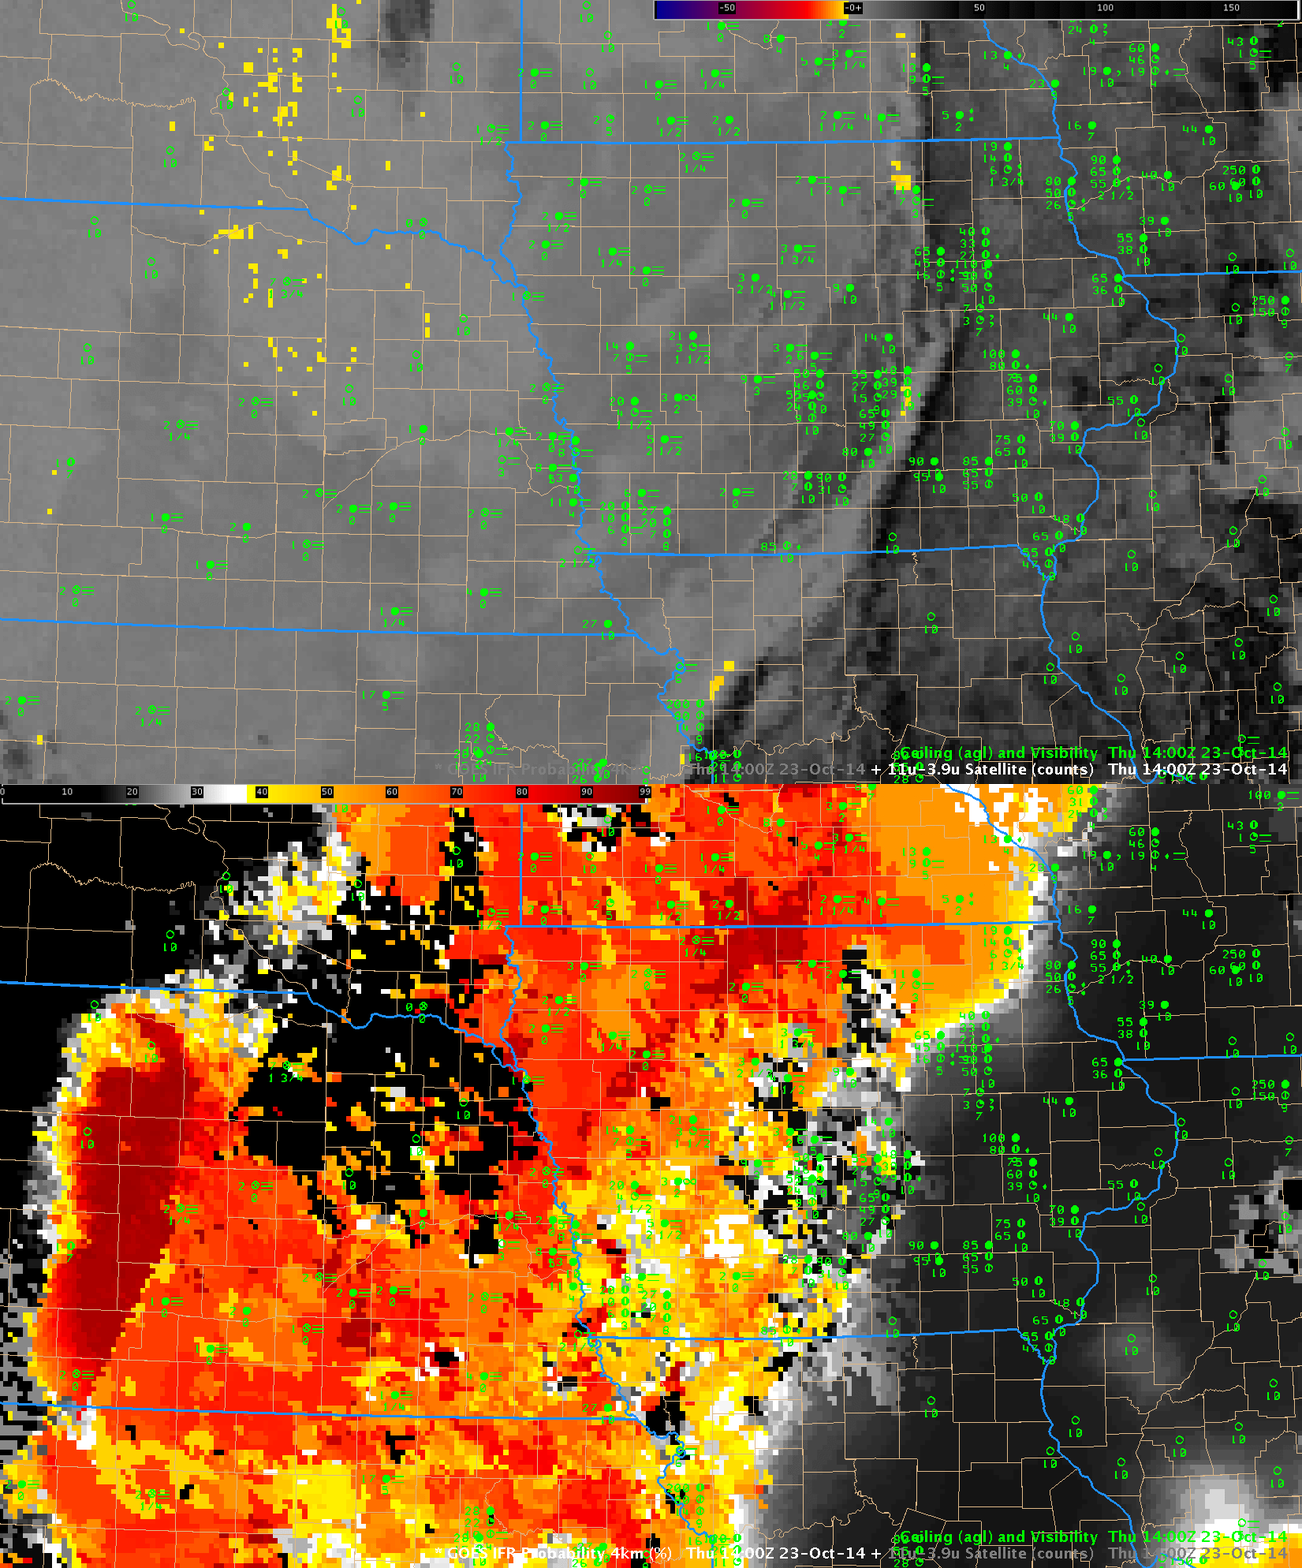
GOES-13 Brightness Temperature Difference (10.7µm – 3.9µm) and GOES-based IFR Probabilities, all at 1400 UTC 23 October 2014, with surface observations of ceilings and visibilities (click to enlarge)
The NSSL WRF accurately suggested that fog/low stratus was possible. The brightness temperature difference field from the model run, below, at 0900 UTC, shows a strong signal of low water-based clouds over western Iowa and Nebraska. (This link shows the latest model run (initialized at 0000 UTC) of Brightness Temperature Difference fields, with output from 0900 through 1200 UTC of the following day)
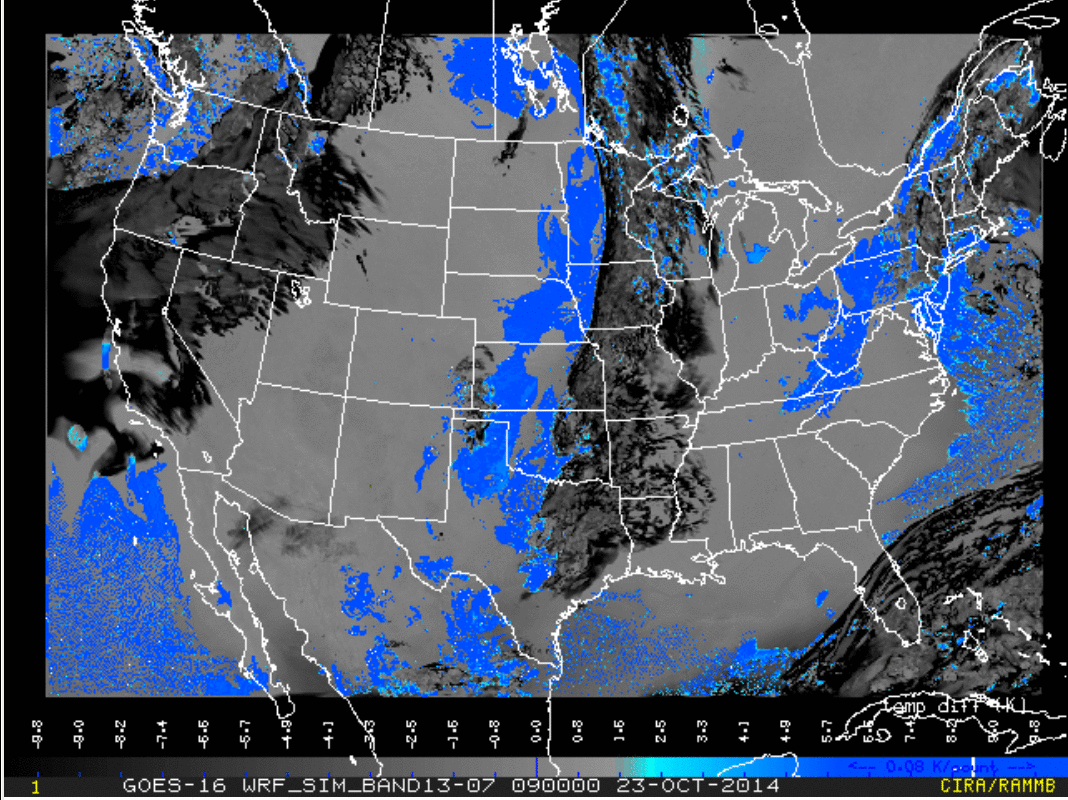
Simulated Brightness Temperature Difference fields, 0900 UTC 23 October 2014, from the 0000 UTC NSSL WRF Model Run (Click to enlarge)
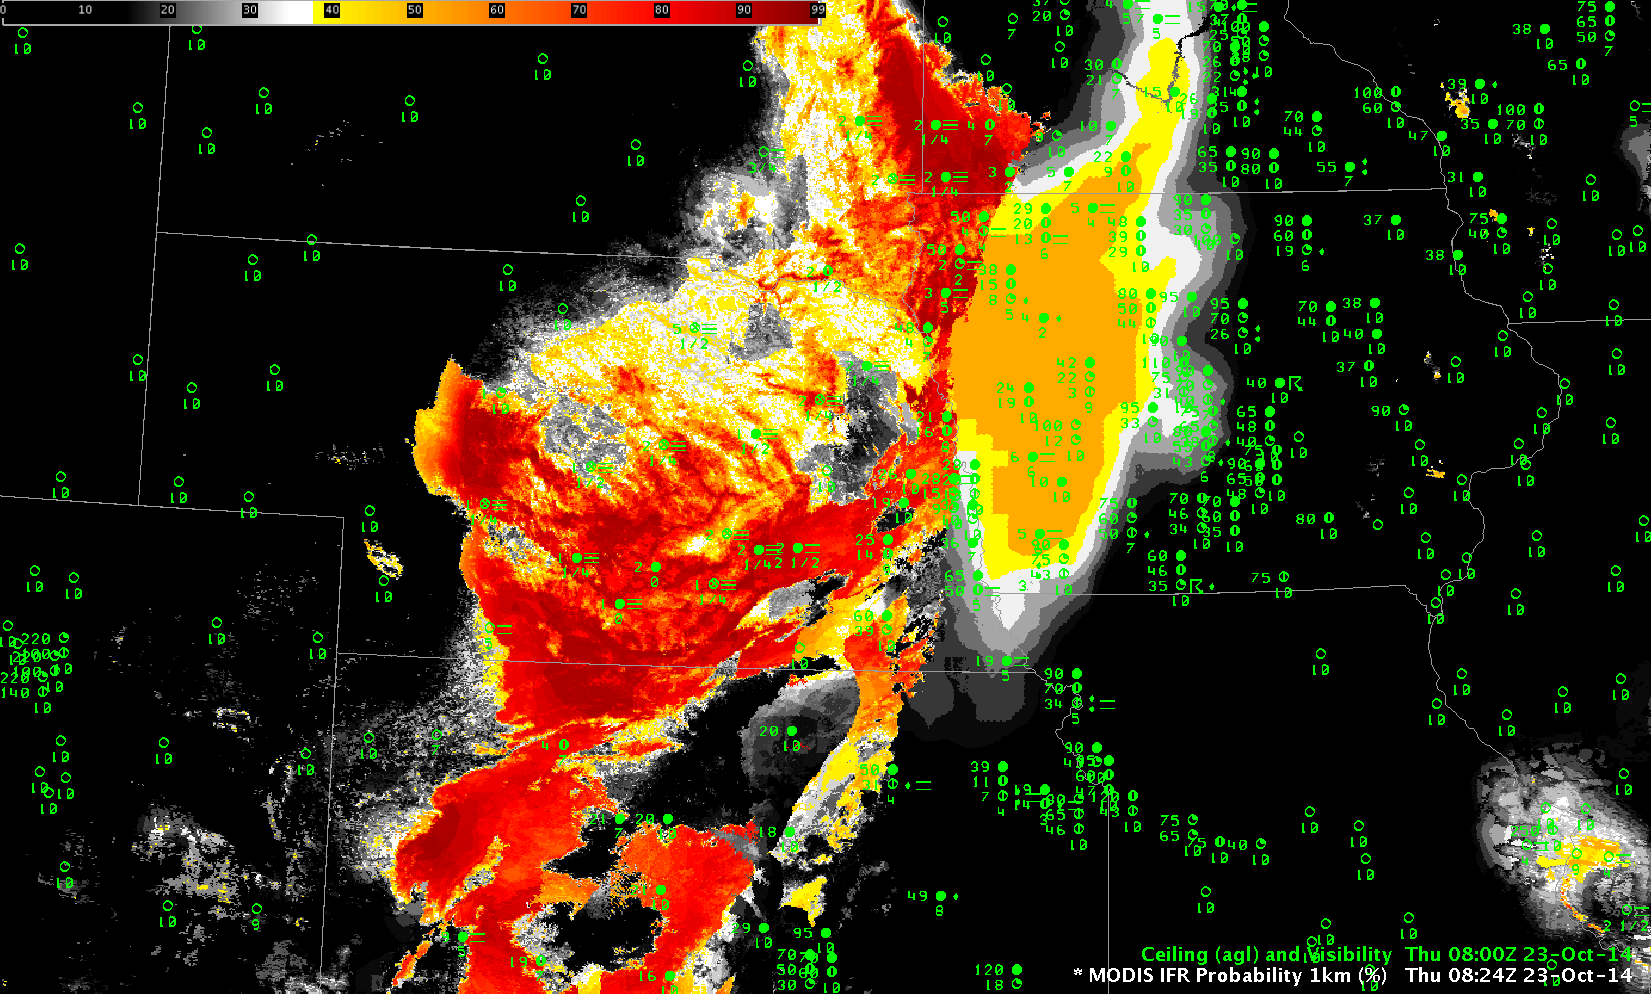
MODIS-based IFR Probability Fields were also available for this event, at 0824 UTC, below. As with the GOES, there is a noticeable (very!) difference between regions where Satellite Predictors are being used in the computation of IFR Probabilities (Nebraska) and regions where Satellite Predictors are not being used in the computation of IFR Probabilities (Iowa). The superior resolution of the MODIS data also suggests that River Valleys in eastern Nebraska are more likely foggy than adjacent land. The Elkhorn River between Norfolk and O’Neill, for example, shows up in the MODIS-based IFR Probability field as a thread of higher IFR Probability.

