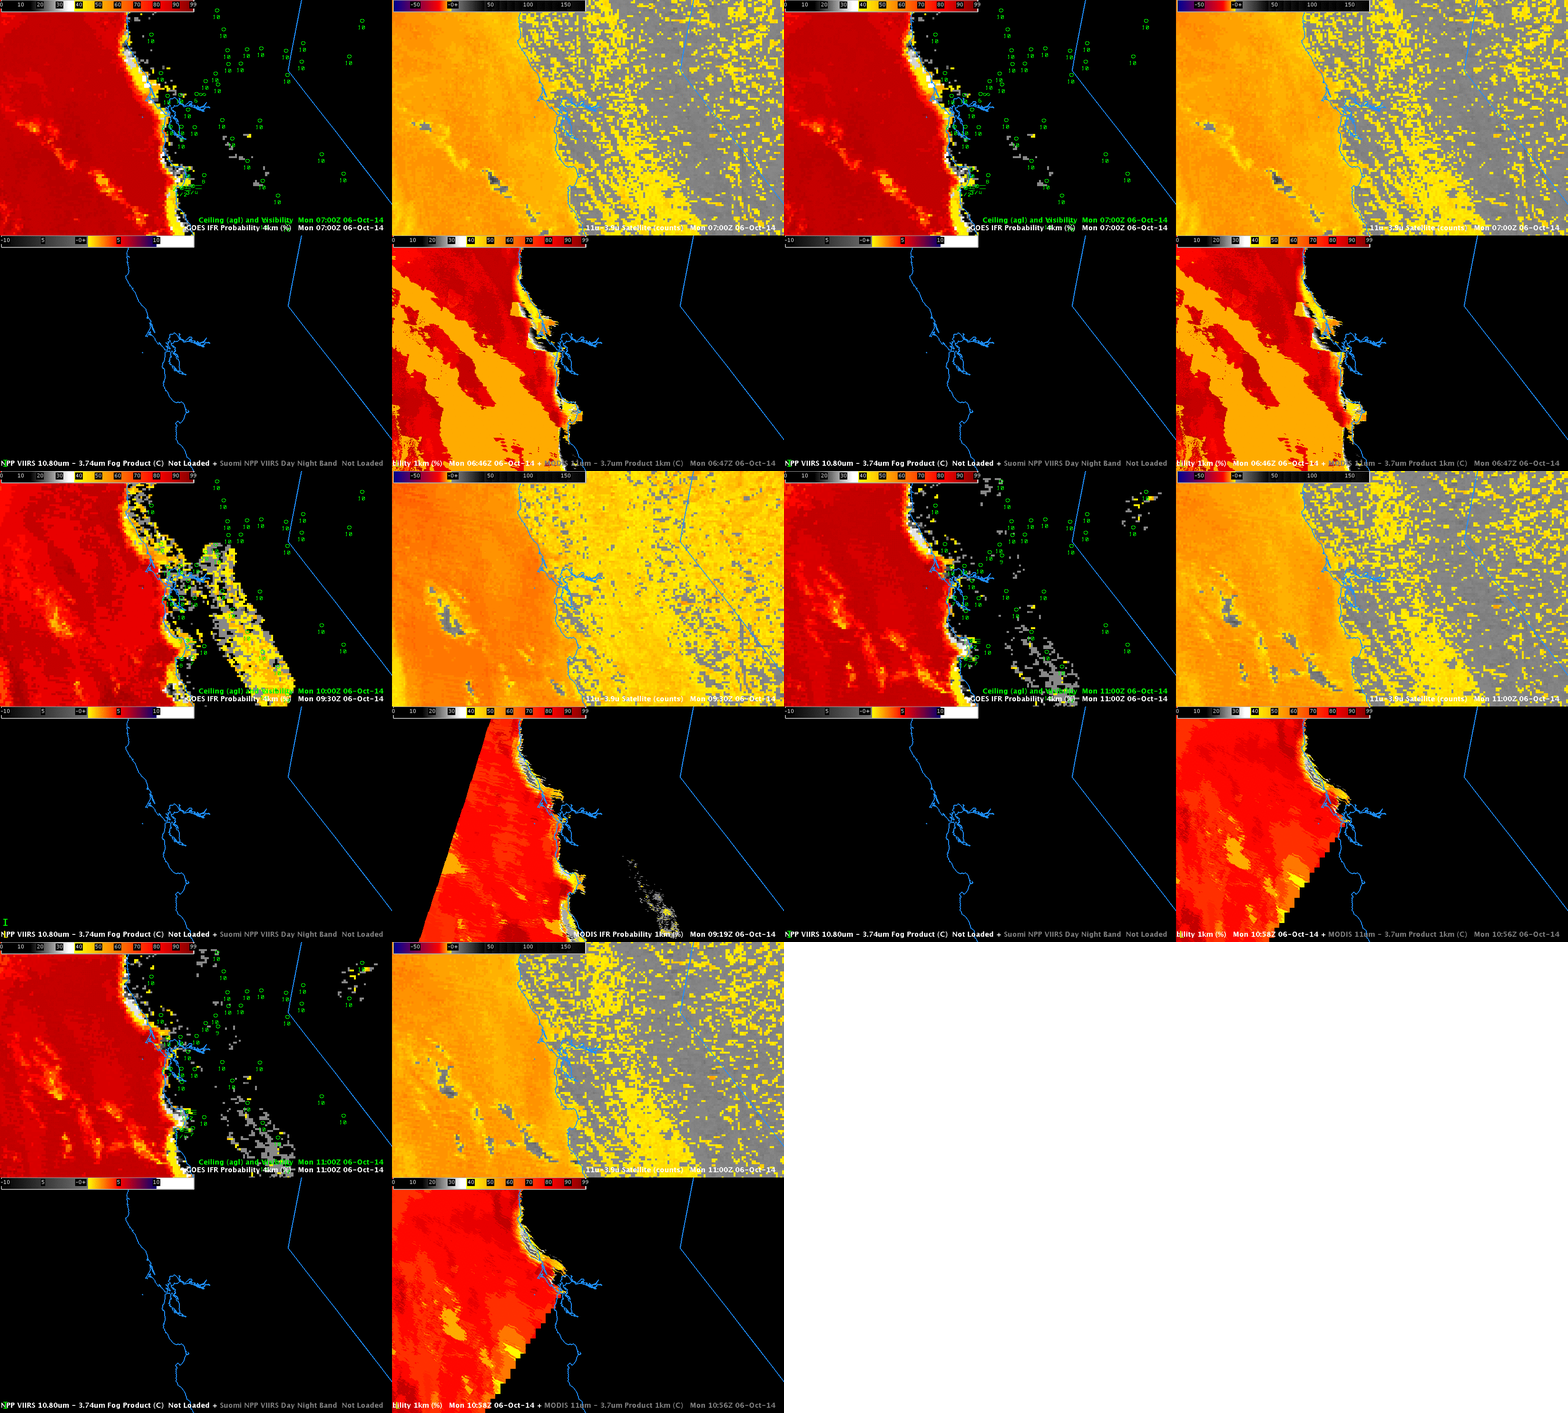
MODIS data from Terra and Aqua, Suomi NPP data, and GOES-15 data yield different types of information that can be used to observe clouds in a region. Probabilities of IFR conditions — that is, what’s going on at cloud base, which is a part of the cloud the satellite cannot see — can be produced by combining satellite observations of cloud tops and data from a model (such as the Rapid Refresh) that includes accurate predictions low-level moisture.

GOES-based IFR Probabilities (Upper Left), GOES-15 Brightness Temperature Difference (10.7µm – 3.9µm) (Upper Right), MODIS-based IFR Probabilities (Lower Right) at 0646 UTC, 0919 and 1058 UTC (Click to enlarge)
The three MODIS images, above (bottom right), show the slow encroachment of higher IFR Probabilities east-southeastward along the Sonoma/Marin county border. The high-resolution imagery from MODIS allows a more accurate depiction of the sharp edges that can occur as marine stratus penetrates inland around topographic features. MODIS data also suggests reduced ceilings in San Francisco.

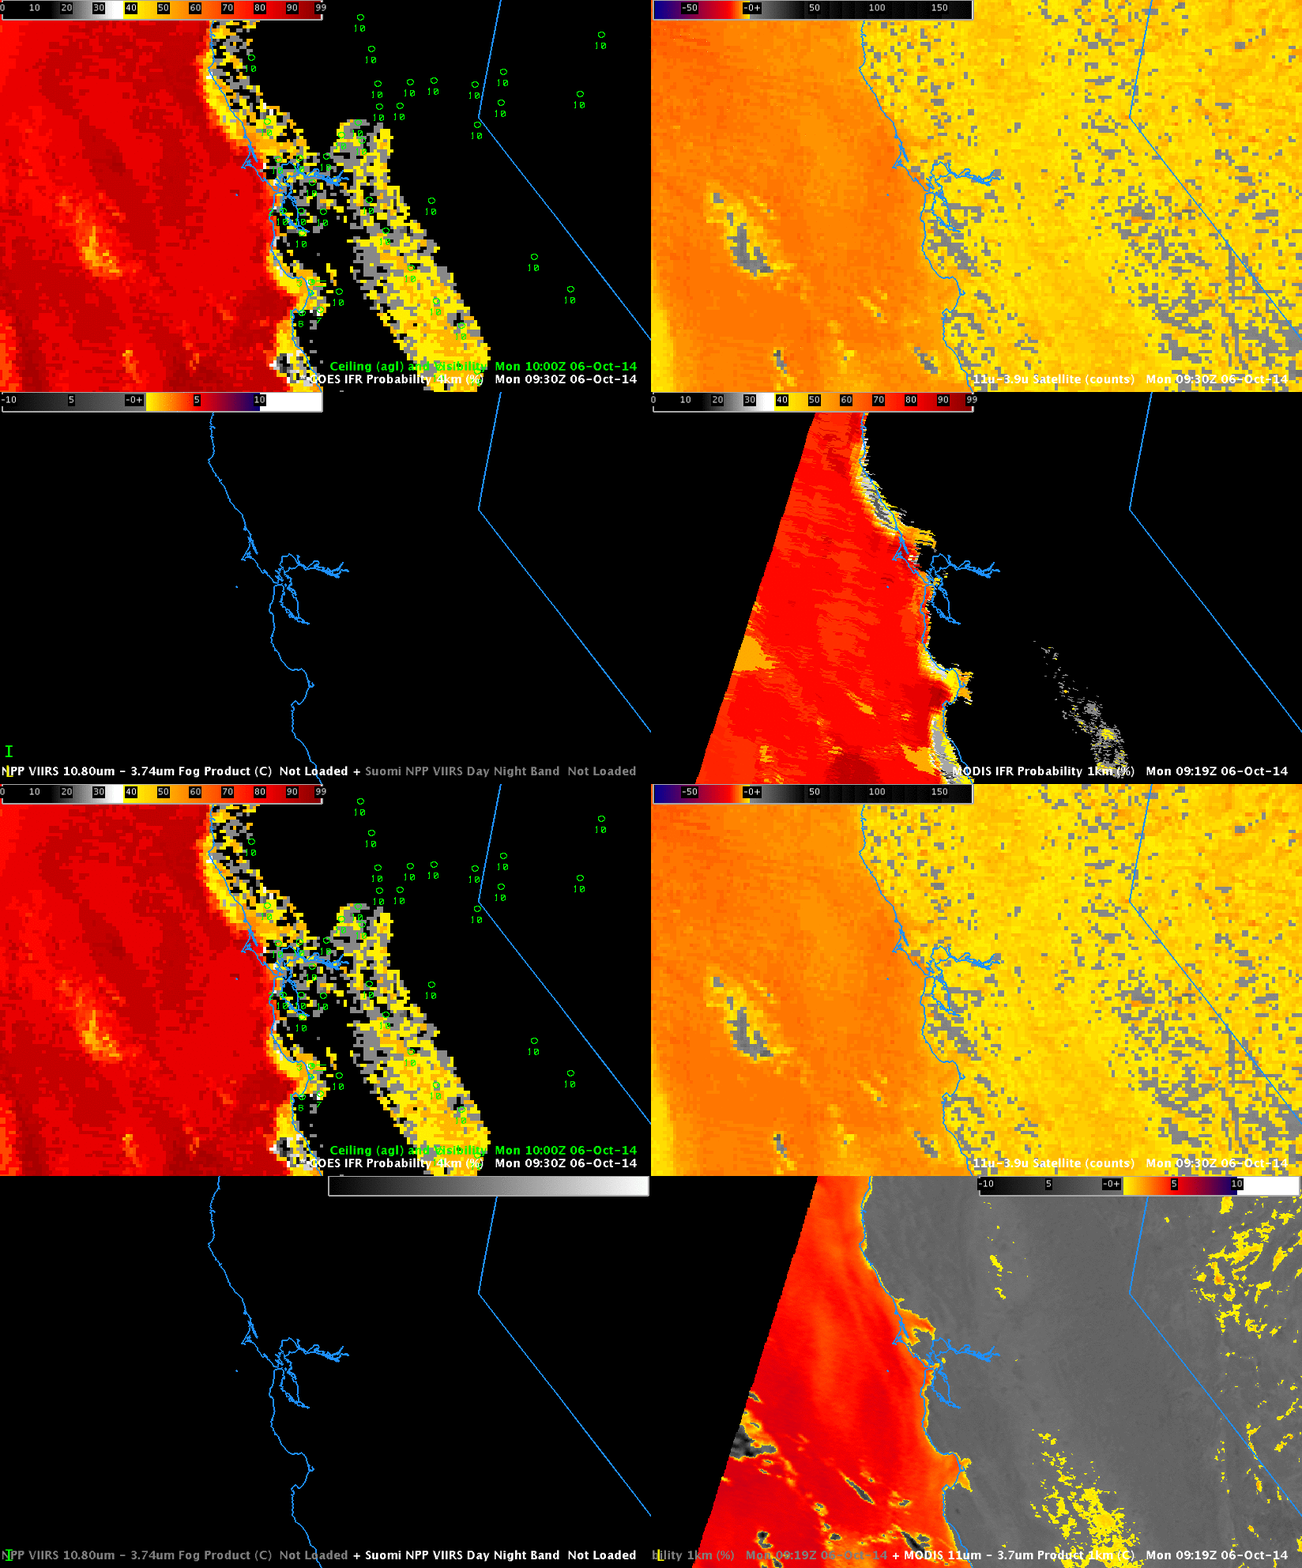
As above, but at 0919 UTC only, with a toggle of MODIS Brightness Temperature Difference (11µm – 3.7 µm) and IFR Probability (Bottom Right) (Click to enlarge)
The 0919 UTC MODIS pass (from Aqua) happened to pass at a time when the GOES-West brightness temperature difference field was contaminated by stray light. The toggle above shows the difference between MODIS and GOES Brightness Temperature Difference fields at that time. MODIS is only detecting a signal where low clouds are present (or where soil differences allow the emissivitiy differences that can show up in the brightness temperature difference field, in this case over Nevada)
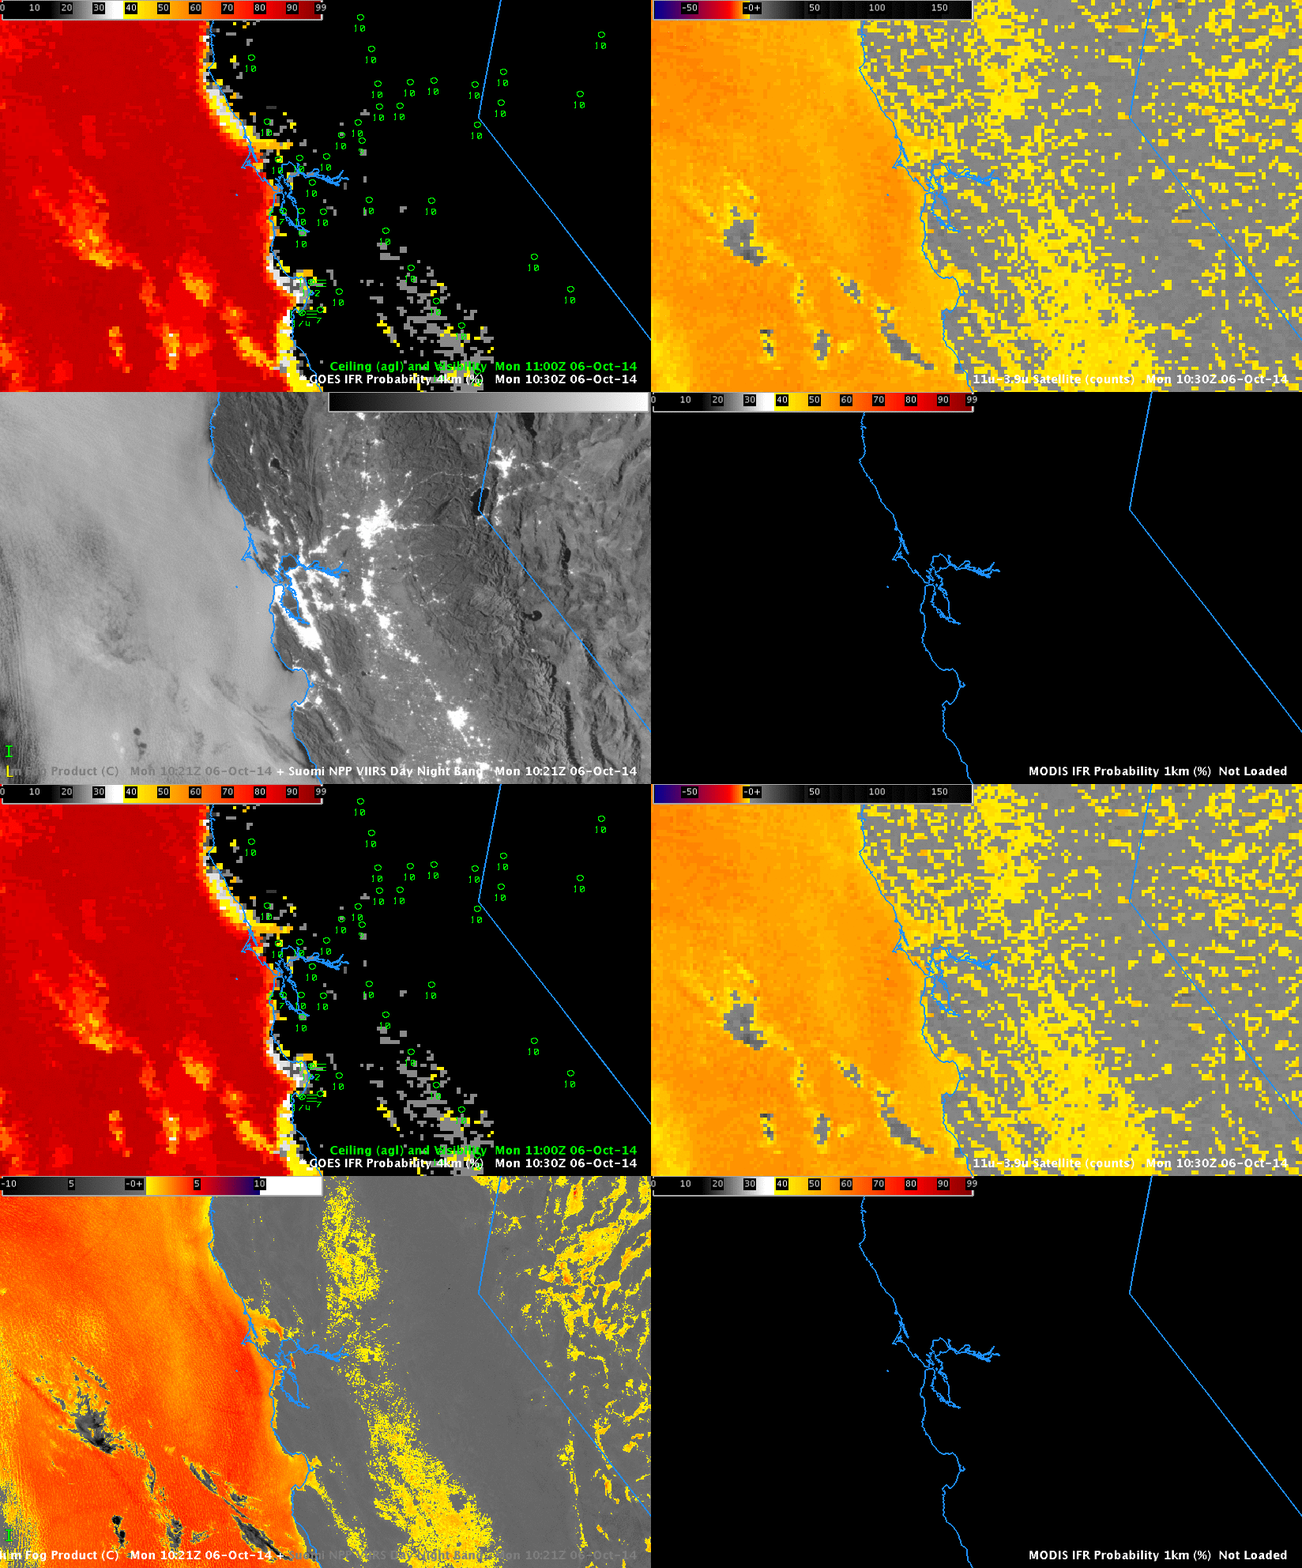
Suomi NPP overflew California at 1000 UTC, and those images are below. The brightness temperature difference field, and the Day Night band show clouds offshore, and city lights in and around San Francisco Bay and Monterey Bay. Regions of stratus have moved inland towards southern Sonoma County, over San Francisco, and over Monterey. There is a slight brightness temperature difference signal in the Suomi NPP data that extends down the Salinas Valley as well; it’s difficult to perceive cloudiness in the Day Night band in that region however.

As above, but with a toggle of Suomi NPP Brightness Temperature Difference and Day Night Band in the lower left, data at 1021 UTC (Click to enlarge)
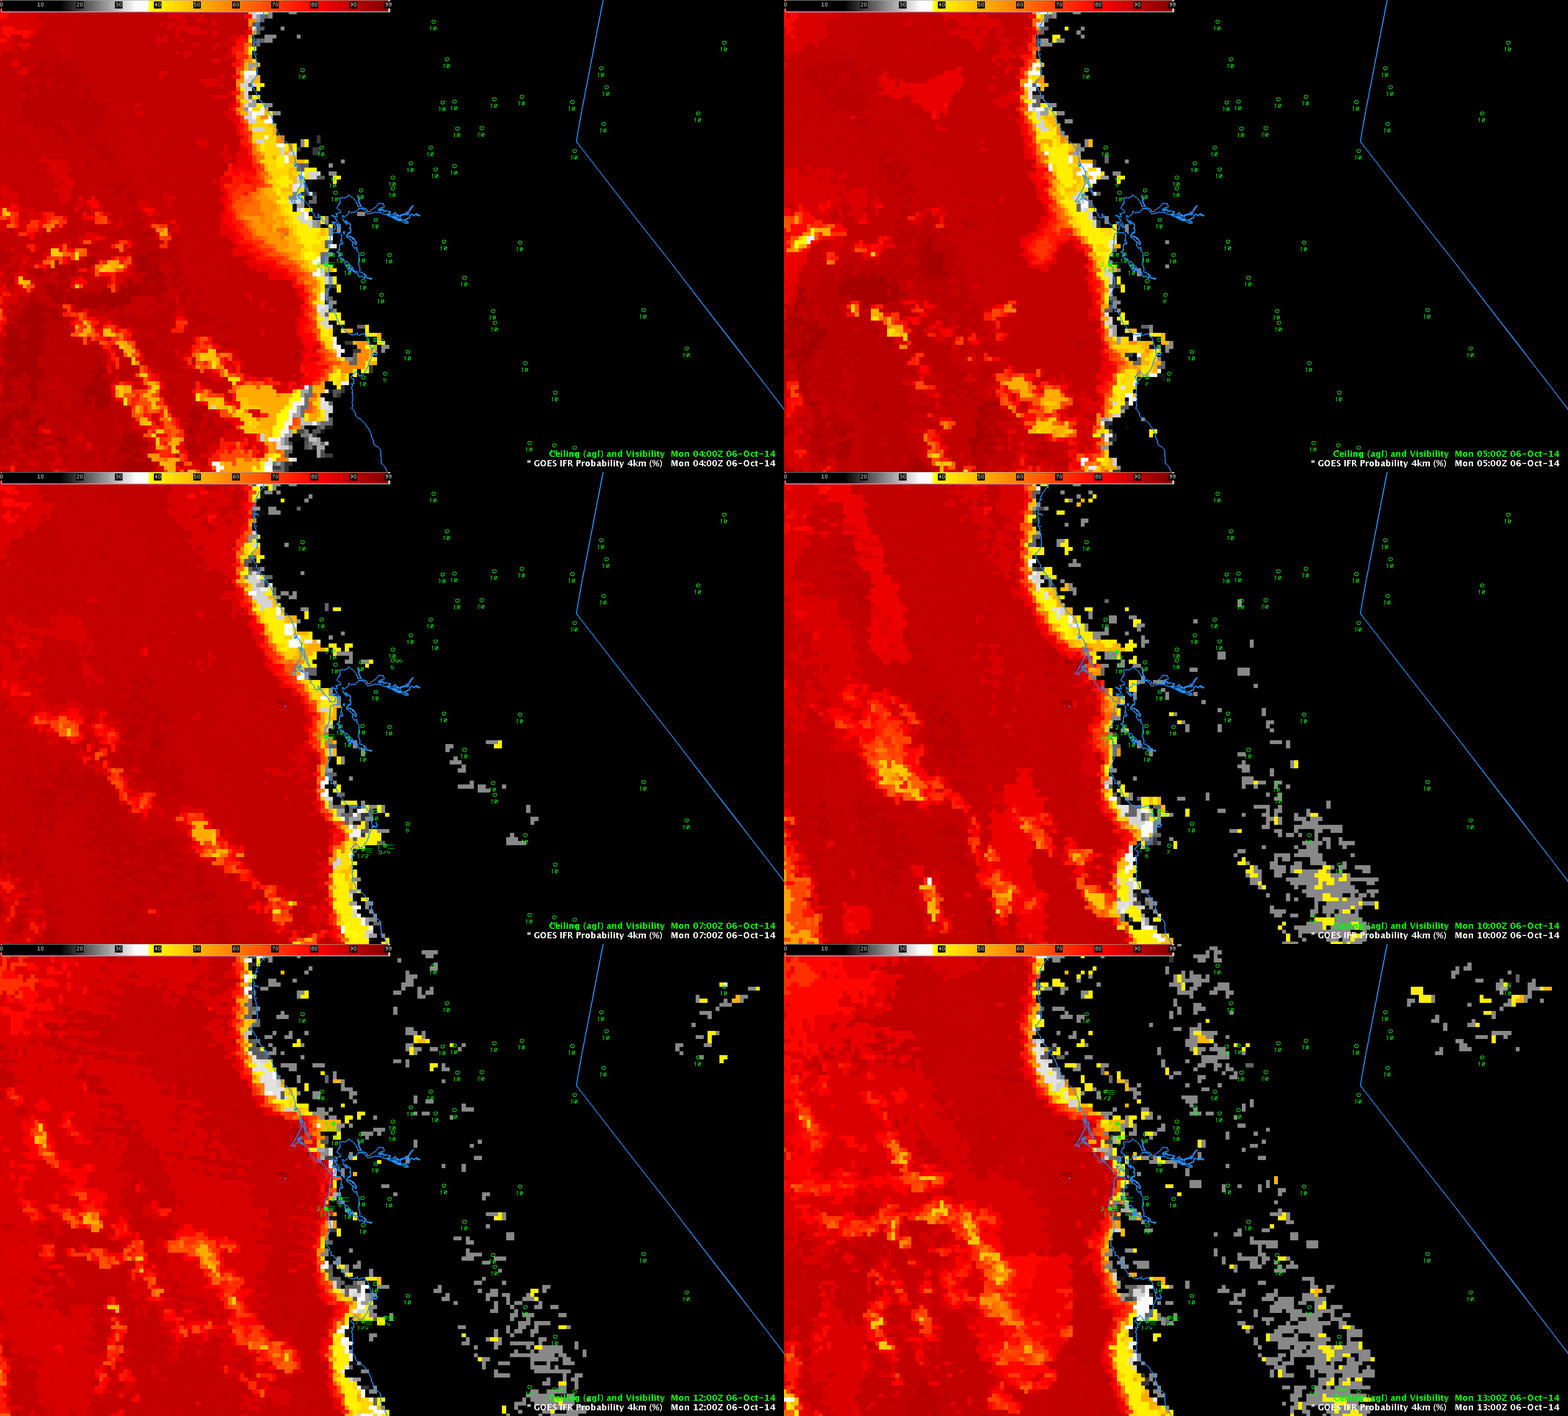
The great strength of GOES data is its ability to monitor continuously the West Coast. Trends are therefore more easily observed. The hourly loop, below, shows that along much of the west coast, marine stratus stayed off shore through the night. Higher IFR Probabilities are also confined to regions where ceilings and visibilities were reduced. This is an improvement on the brightness temperature difference fields for the same time that have strong signals over much of the central Valley (for example, at 0500 and 1300 UTC, as well as at 0915 UTC, above).

