GOES-13 Color-Enhanced Brightness Tempreature Difference Fields (10.7 µm – 3.9 µm), hourly from 0200 through 1100 UTC, 15 September 2014 (Click to enlarge)
Brightness Temperature Difference Fields from GOES-13 show large regions over Pennsylvania and surrounding states during the early morning hours of September 15th. (Note that the image at 0515 UTC, not in the loop above, shows the effect of stray light). If you look at the ceilings and visibilities in the imagery above, you will note that many regions where stratus/fog are indicated by the brightness temperature difference field (over upstate NY, for example), do not in fact show anything near IFR conditions. Always recall that the satellite is seeing the top of the cloud deck; whether or not that cloud extends to the surface is beyond the capability of present satellite systems. (You can infer it sometimes, of course, especially if the signal is confined to a narrow river valley, as occurs in the animation above: The Ohio River along the northern panhandle of West Virginia shows up very well).
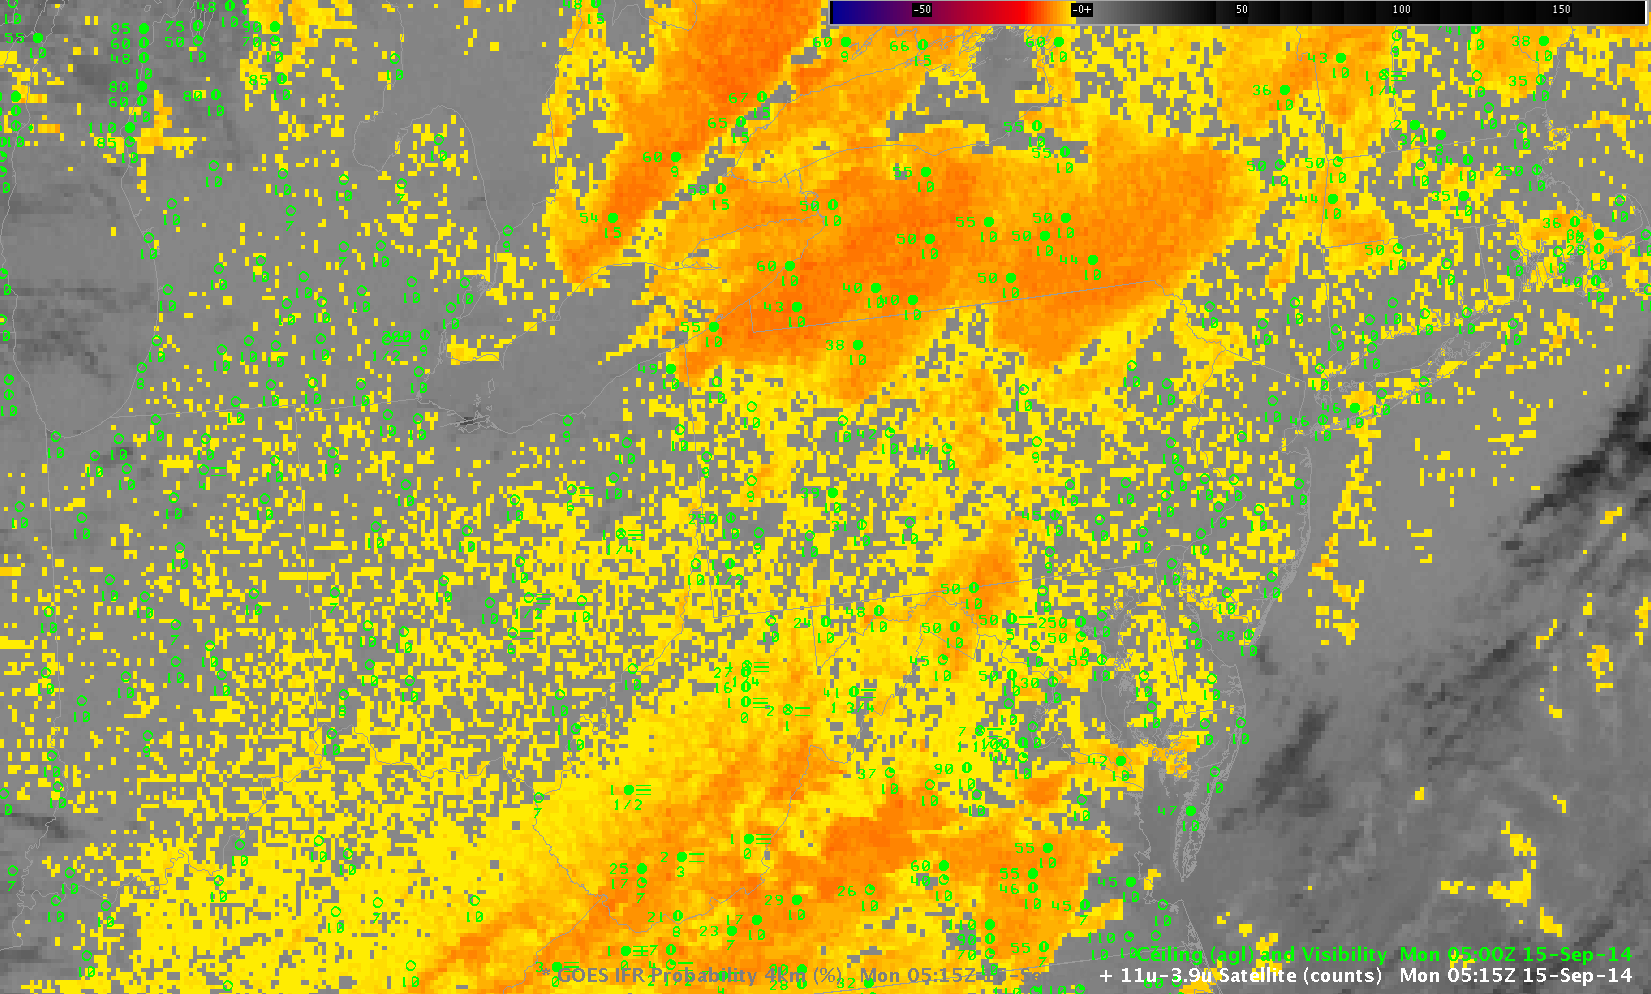
GOES-13 IFR Probability Fields, hourly from 0200 through 1100 UTC, 15 September 2014 (Click to enlarge)
IFR Probability fields for the same time do a better job of highlighting only where reduced ceilings and visibilities are present. For example, the region of stratus over upstate New York is screened out, as well as the region over southern and southeastern Virginia. Probabilities are also quite high over the Ohio River Valley, where river fog is likely occurring. Note that IFR Probabilities over southwestern Indiana at the end of the animation have the characteristic look (a flat field) associated with IFR Probabilities created without the benefit of satellite data.
MODIS data were able to provide a a high-resolution image of this scene in the middle of the night. As with GOES, MODIS identified the large region of stratus over upstate New York and over southeastern Virginia, and the IFR Probabilities correctly screened out those stratus clouds. River Valleys show up distinctly along the Ohio River downriver from Pennsylvania; smaller IFR Probabilities surround the rivers. Sometimes MODIS data can give an early alert to the development of fog; in the present case, when MODIS overflew the region, fog development was at sufficiently large a scale that GOES-13 could also detect it.
MODIS Color-Enhanced Brightness Tempreature Difference Fields (11 µm – 3.9 µm) and IFR Probability Fields at 0722 UTC 15 September 2014 (Click to enlarge)
Suomi NPP data also viewed the developing river fogs, both in the day/night band, and in the brightness temperature difference (11.35 µm – 3.74 µm), below. At present, IFR Probabilities are not computed from Suomi NPP satellite data.
Suomi NPP Color-Enhanced Brightness Tempreature Difference Fields (11.35 µm – 3.74 µm) and Day Night band visible imagery at 0653 UTC 15 September 2014 (Click to enlarge)