Suomi NPP 11.35 µm Infrared Imagery at 0609 and 0752 UTC, 10 July 2014 (Click to enlarge)
The orbital geometry of Suomi NPP allowed two high-resolution images of Pennsyvlania early in the morning of the 10th of July 2014. Can you tell from the imagery above if there is fog/stratus in the river valleys of Pennsyvlania? Are the relatively cool clouds from Pittsburgh northeastward towards Elmira, NY obstructing visibilities? Based on the IR (11.35 µm for Suomi NPP) imagery alone, above, that is a difficult question to answer. Historically, the brightness temperature difference between the longwave IR (11.35 µm) and the shortwave IR (3.74 µm) has been used to indentify water-based clouds. Imagery from Suomi NPP, below, highlights where water-based clouds (like stratus) exist. If the clouds are the same temperature as the surrounding land (likely the case for river fog), a single 11.35-µm image is of little help in identifying the clouds.
Suomi NPP 11.35 – 3.74 µm Brightness Temperature Difference at 0609 and 0752 UTC, 10 July 2014 (Click to enlarge)
The Day-Night band can also highlight where clouds exist, because lunar illumination reflects well off clouds. A 3/4-full moon ably illuminates the scene at 0609 UTC, but that moon has set at 0747 UTC and the Clouds are harder to see.
Suomi NPP Day/Night Band at 0609 and 0752 UTC, 10 July 2014 (Click to enlarge)
Both the Day/Night band and the Brightness Temperature Difference Fields (and any Infrared image) gives information about the top of the cloud. Fog existence is difficult to discern only from satellite data because the bottom of the cloud is not sampled. This is why a fused product (such as IFR Probability) that includes surface information (in the case of IFR Probability from the Rapid Refresh Model) is desirable. MODIS data can be used to compute IFR Probability, and a MODIS-carrying Aqua pass occurred in between the two Suomi NPP Passes shown above.
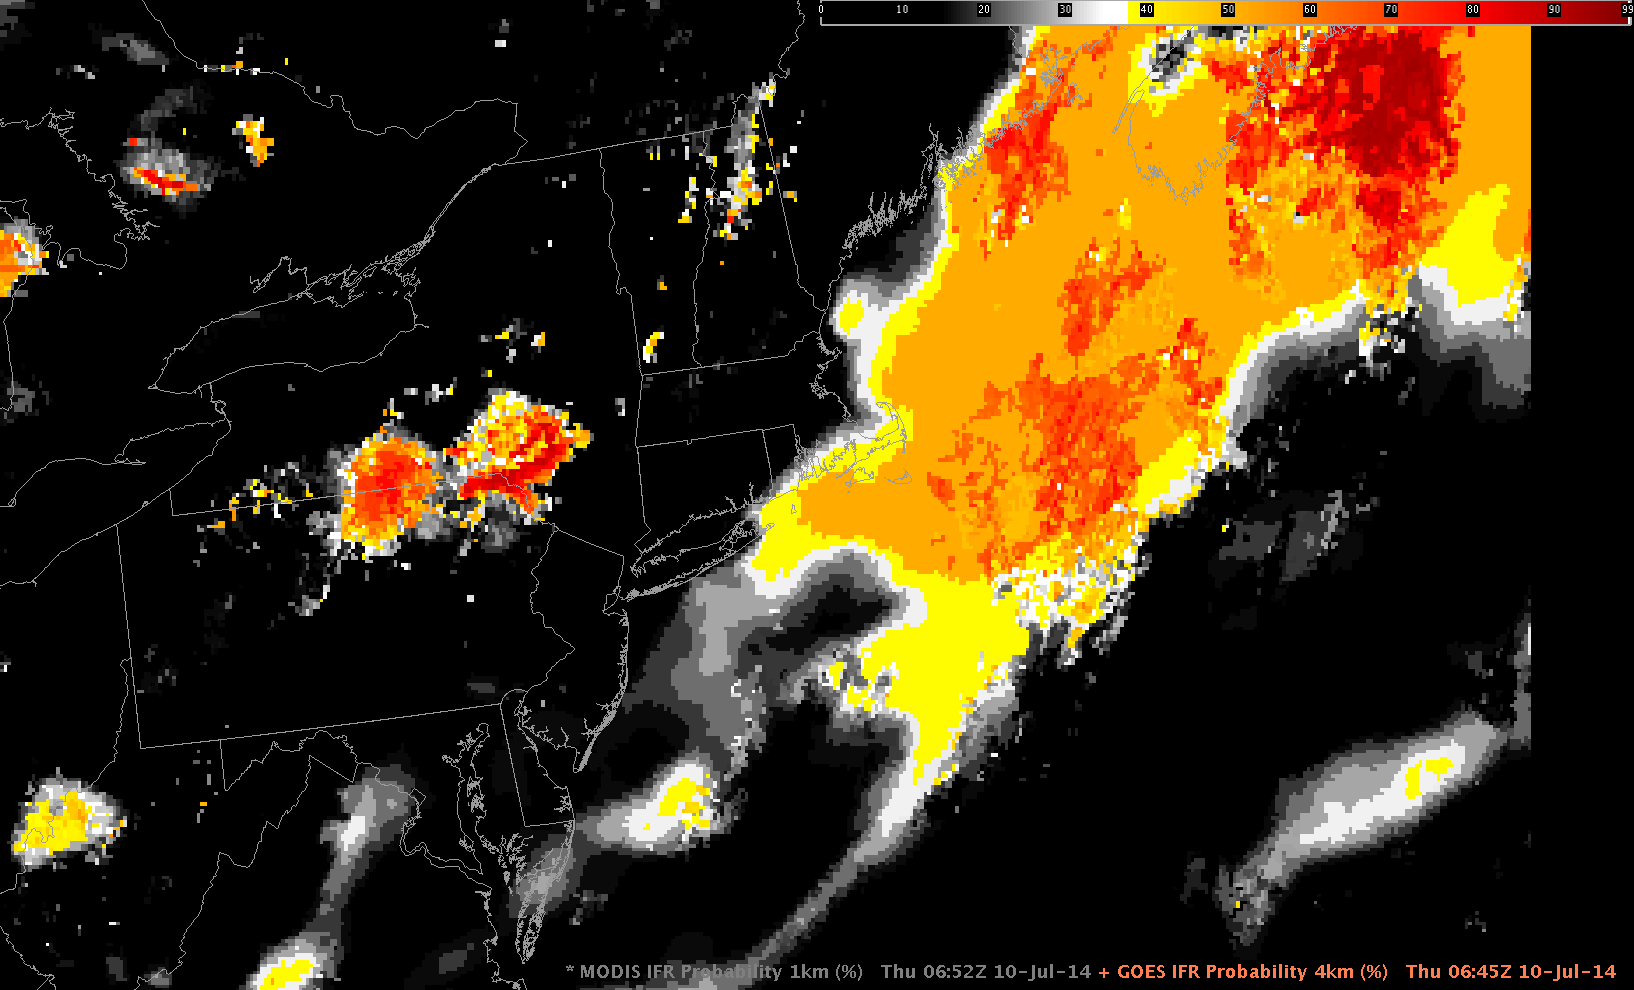
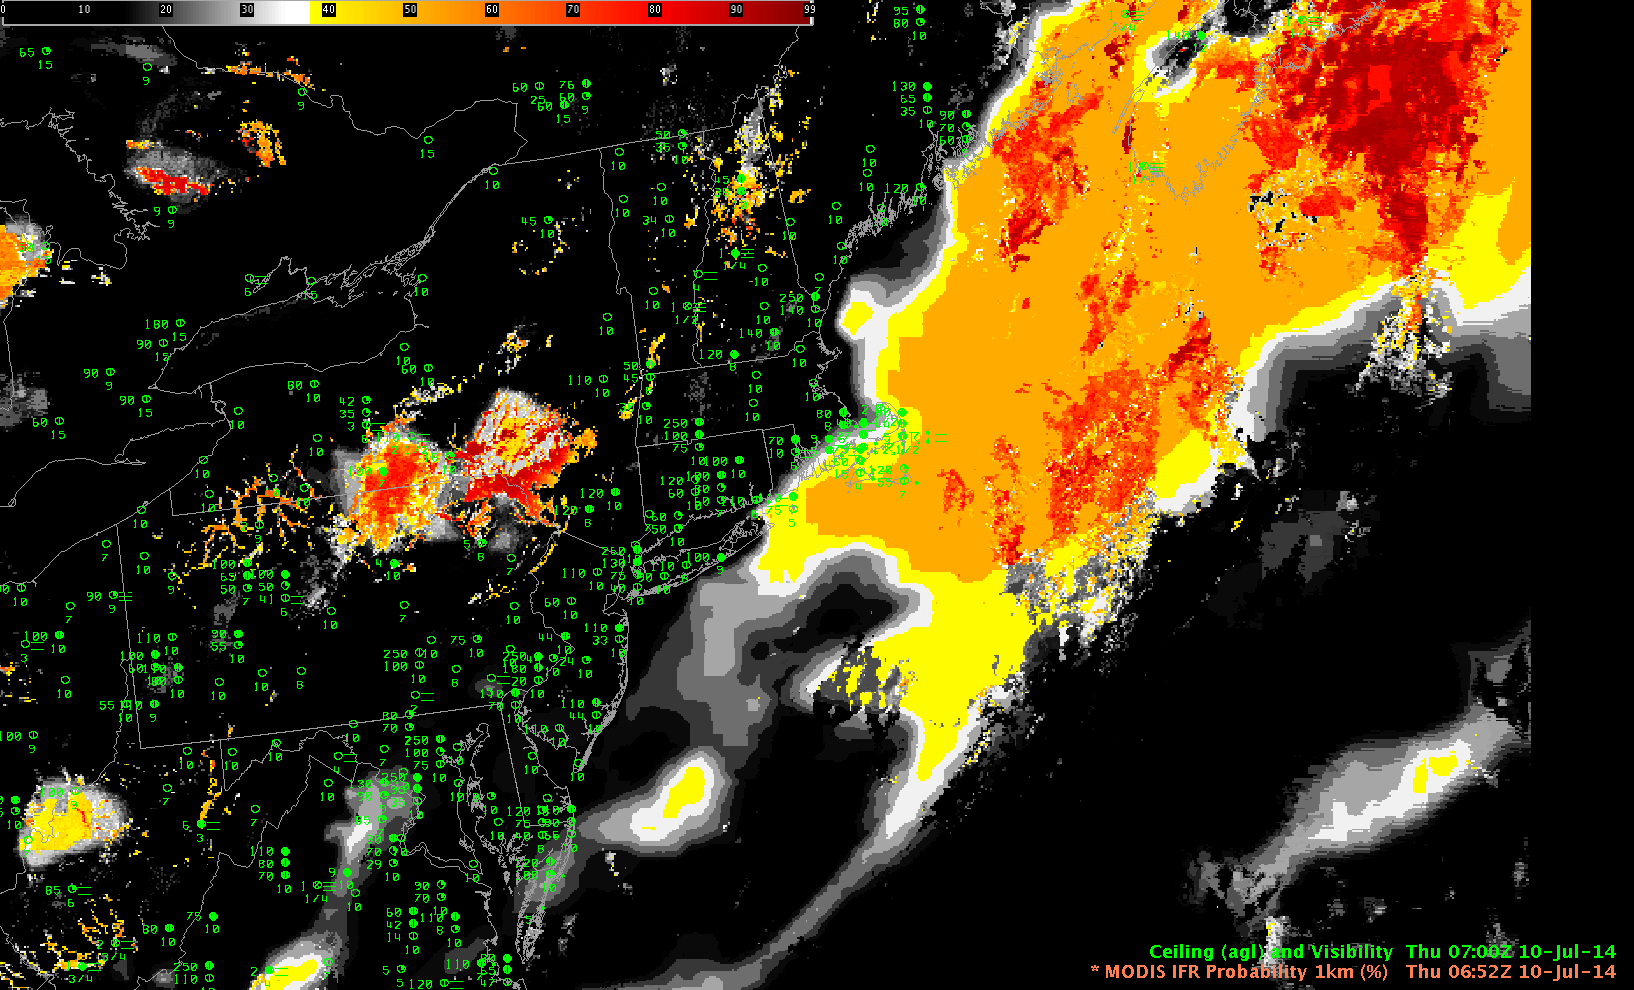
MODIS 11 – 3.9 µm Brightness Temperature Difference and IFR Probability at 0652 UTC, 10 July 2014 (Click to enlarge)
In the two images above, note how the IFR Probability Fields de-emphasize the low cloud areas that stretch northeastward from Pittsburgh towards Elmira. This is likely mid-level stratus. River Fog over northeast Pennsylvania is highlighted in the IFR Probability fields (and in the brightness temperature difference field). This image, which shows the GOES-based IFR Probability field at 0645 UTC, highlights the power of MODIS’ superior spatial resolution in the early detection of small-scale fog. The large region of reduced visibility around Elmira NY (meager surface observations suggest this large region of fog verified) appears in both MODIS- and GOES-based IFR Probability fields. Only the MODIS-based IFR Probability field, however, has a distinct river-valley signal over northeast Pennsylvania.
MODIS and GOES IFR Probability both suggest IFR conditions may be occurring over the Atlantic Ocean. The brightness temperature difference field shows no low cloud signal there because of a cirrus shield. IFR Probability gives a signal of fog here based on information from the Rapid Refresh.