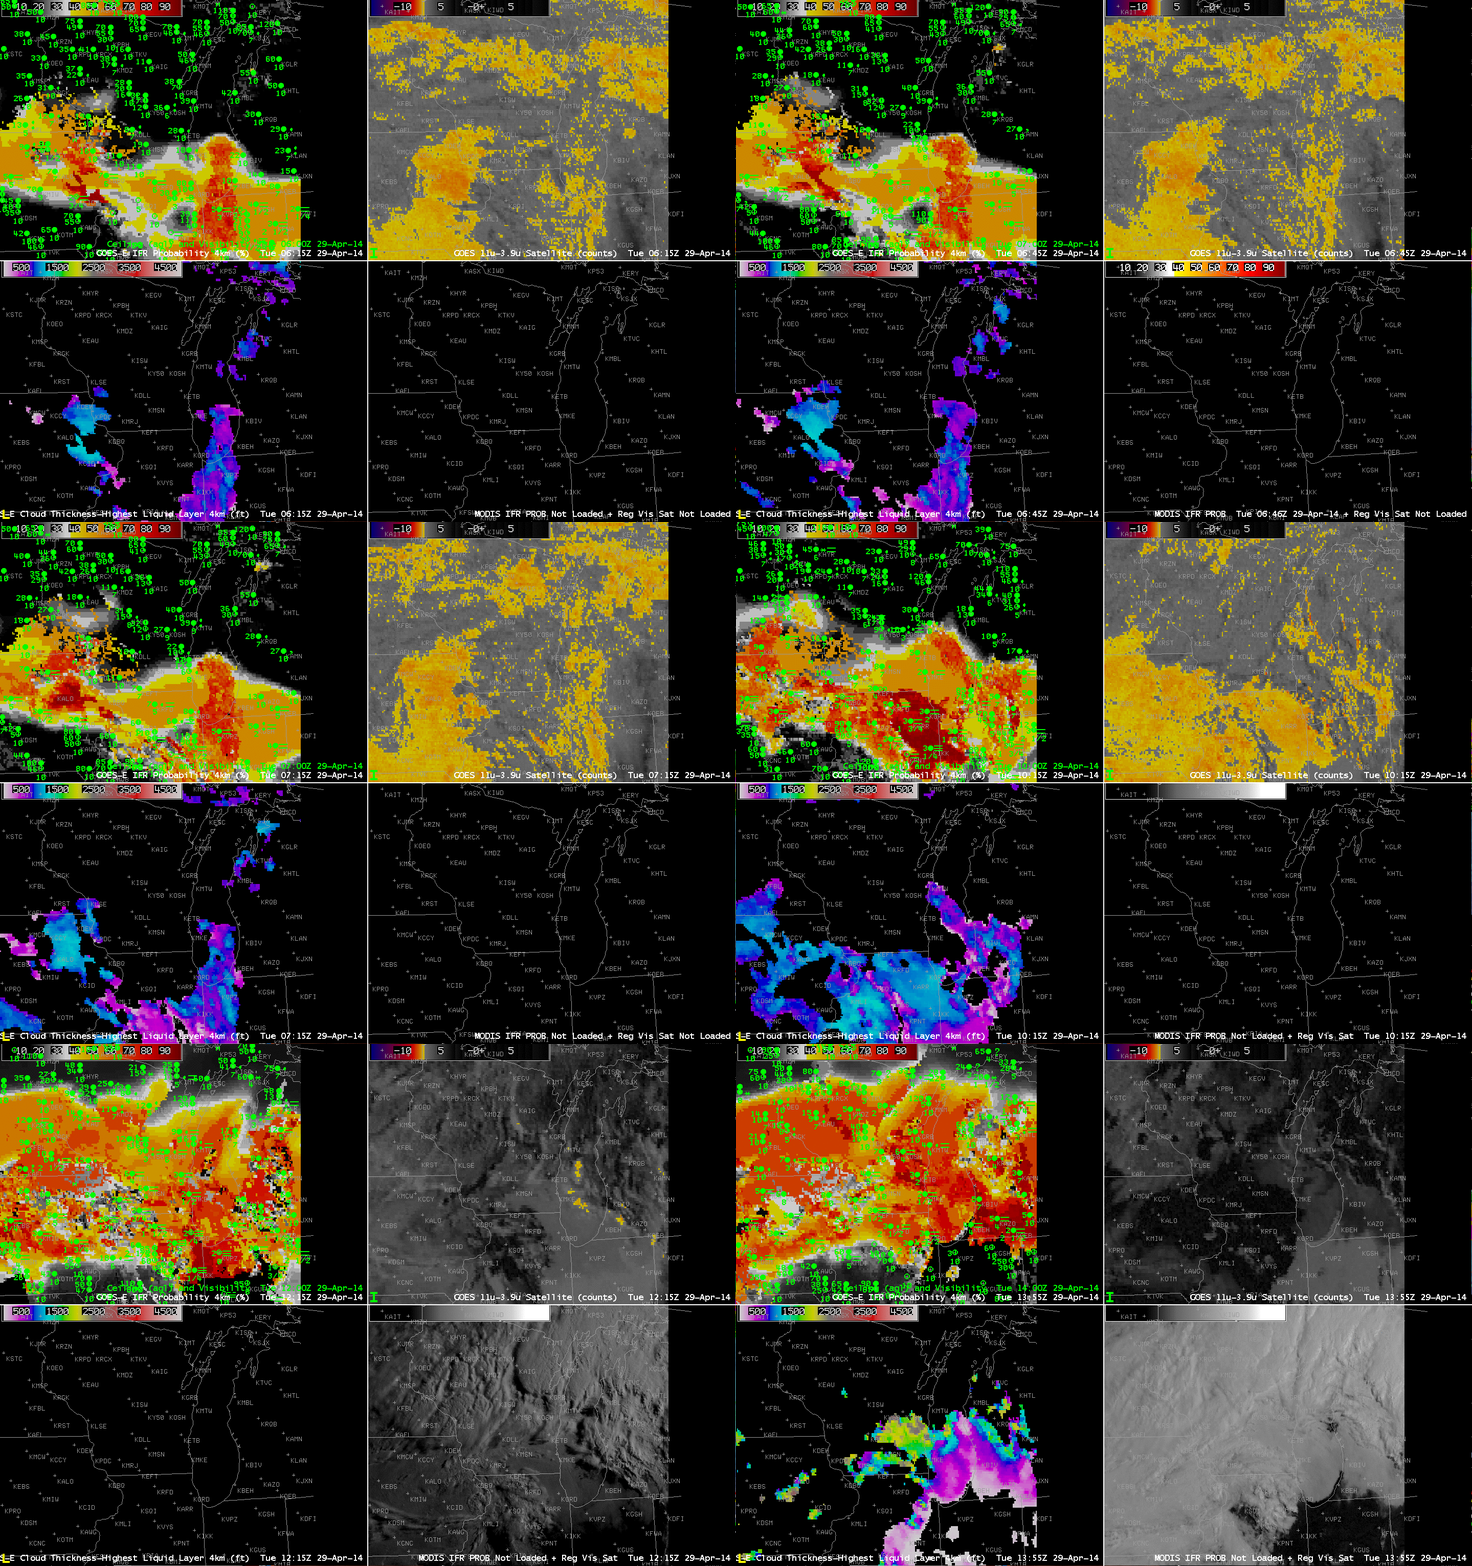
GOES-R IFR Probabilities computed from GOES-East (Upper Left), GOES-East Brightness Temperature Differences (10.7 µm – 3.9 µm) (Upper Right), GOES-R Cloud Thickness (Lower Left), GOES-R IFR Probabilities computed from MODIS, or GOES-East Visible Imagery, times as indicated on 29 April 2014 (click to enlarge)
The GOES-R IFR Probability fields computed from GOES-East captured the onset of Lake fog that moved onshore over eastern Wisconsin on April 29th. Multiple cloud layers associated with a strong extratropical cyclone precluded the use of the brightness temperature difference product (the heritage method of detecting fog/low stratus). However, the IFR Probability field aligns well with the reductions in visibility associated with the Lake fog. The character of the IFR Probability field can be used to infer whether of not satellite data predictors are being used. For example, the relatively flat field over southeast Wisconsin at the start of the animation is a region where satellite predictors are not used. The use of satellite predictors generally leads to a pixelated field. A flatter field as over southeast Wisconsin reflects the smoother model fields that are driving the probability field computation.
Cloud thickness is computed in regions where the highest cloud, as seen by the satellite, is a water-based cloud. And that is also usually the region where satellite predictors are used in the computation of IFR Probabilities. Note in the animation above how cloud thickness generally overlays regions of IFR Probability that are pixelated. Cloud thickness is not computed where only model data are used to compute IFR Probabilities. (Cloud thickness is also not computed in the hour or so around sunrise and sunset, during twilight conditions).
The slow northward movement of the fog bank is apparent in the first part of the animation above, from 0615 through 0745 UTC. Note also how the MODIS IFR Probability fields give a very similar solution to the GOES-13-based fields at 0745 UTC. Differences in resolution are apparent over southwest Wisconsin, however, where river valleys are more accurately captured by the MODIS fields.
In the visible imagery at the end of the animation (1355 UTC), the rapid saturation of moisture-laden air moving northward from Indiana over the cold waters of southern Lake Michigan is very apparent.
