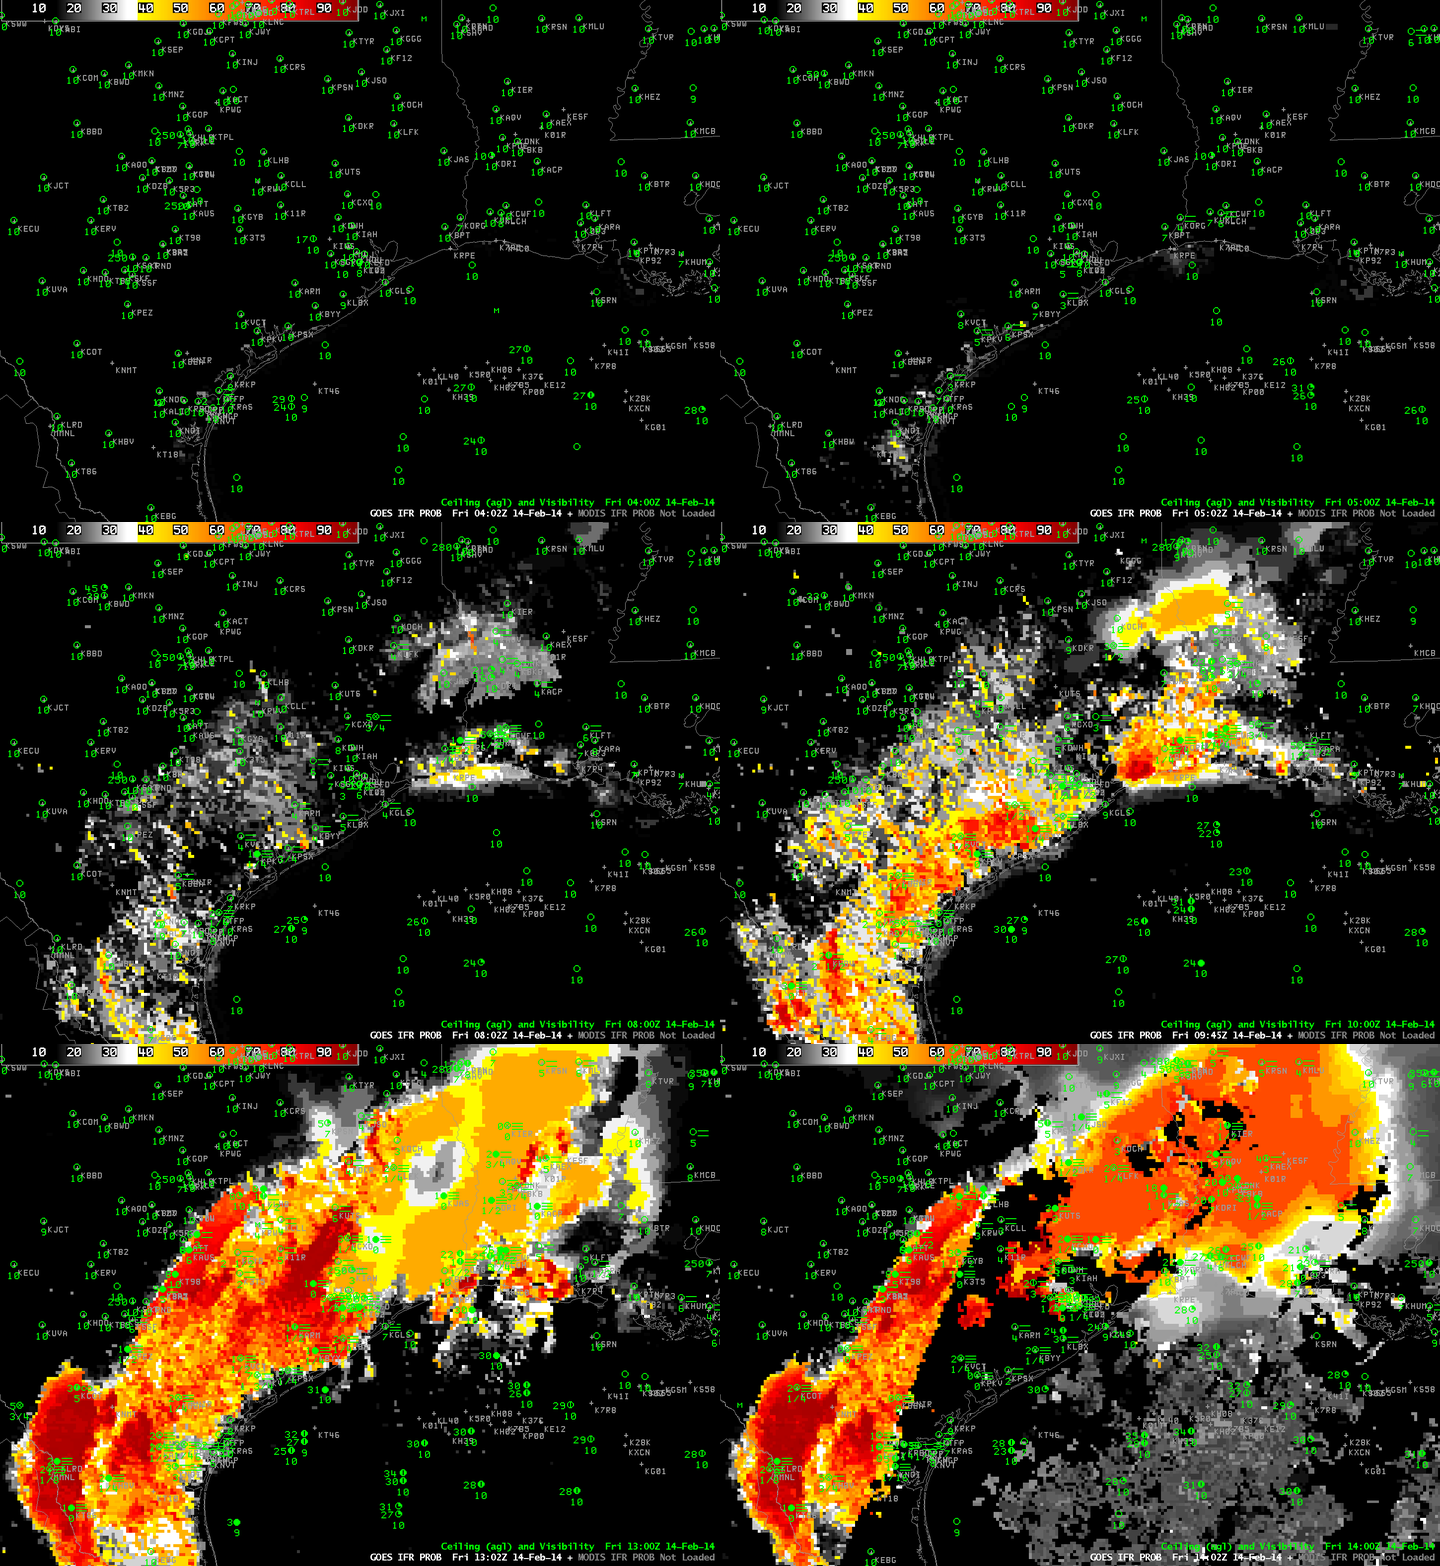
Fog and Low clouds resulted in IFR conditions along a long swath of the western Gulf Coast today. IFR Probability fields warned of the development of these conditions long before a strong signal appeared in the traditional brightness temperature difference fields. The animation above, of hourly GOES-R IFR Probability fields (and surface observations of ceiling and visibility). There are indications by 0615 and 0702 that fog/low stratus is developing, and those indications are matched by some observations of IFR conditions. By 0915 UTC, widespread IFR conditions are present from southwest Louisiana southwestward through coastal Texas.

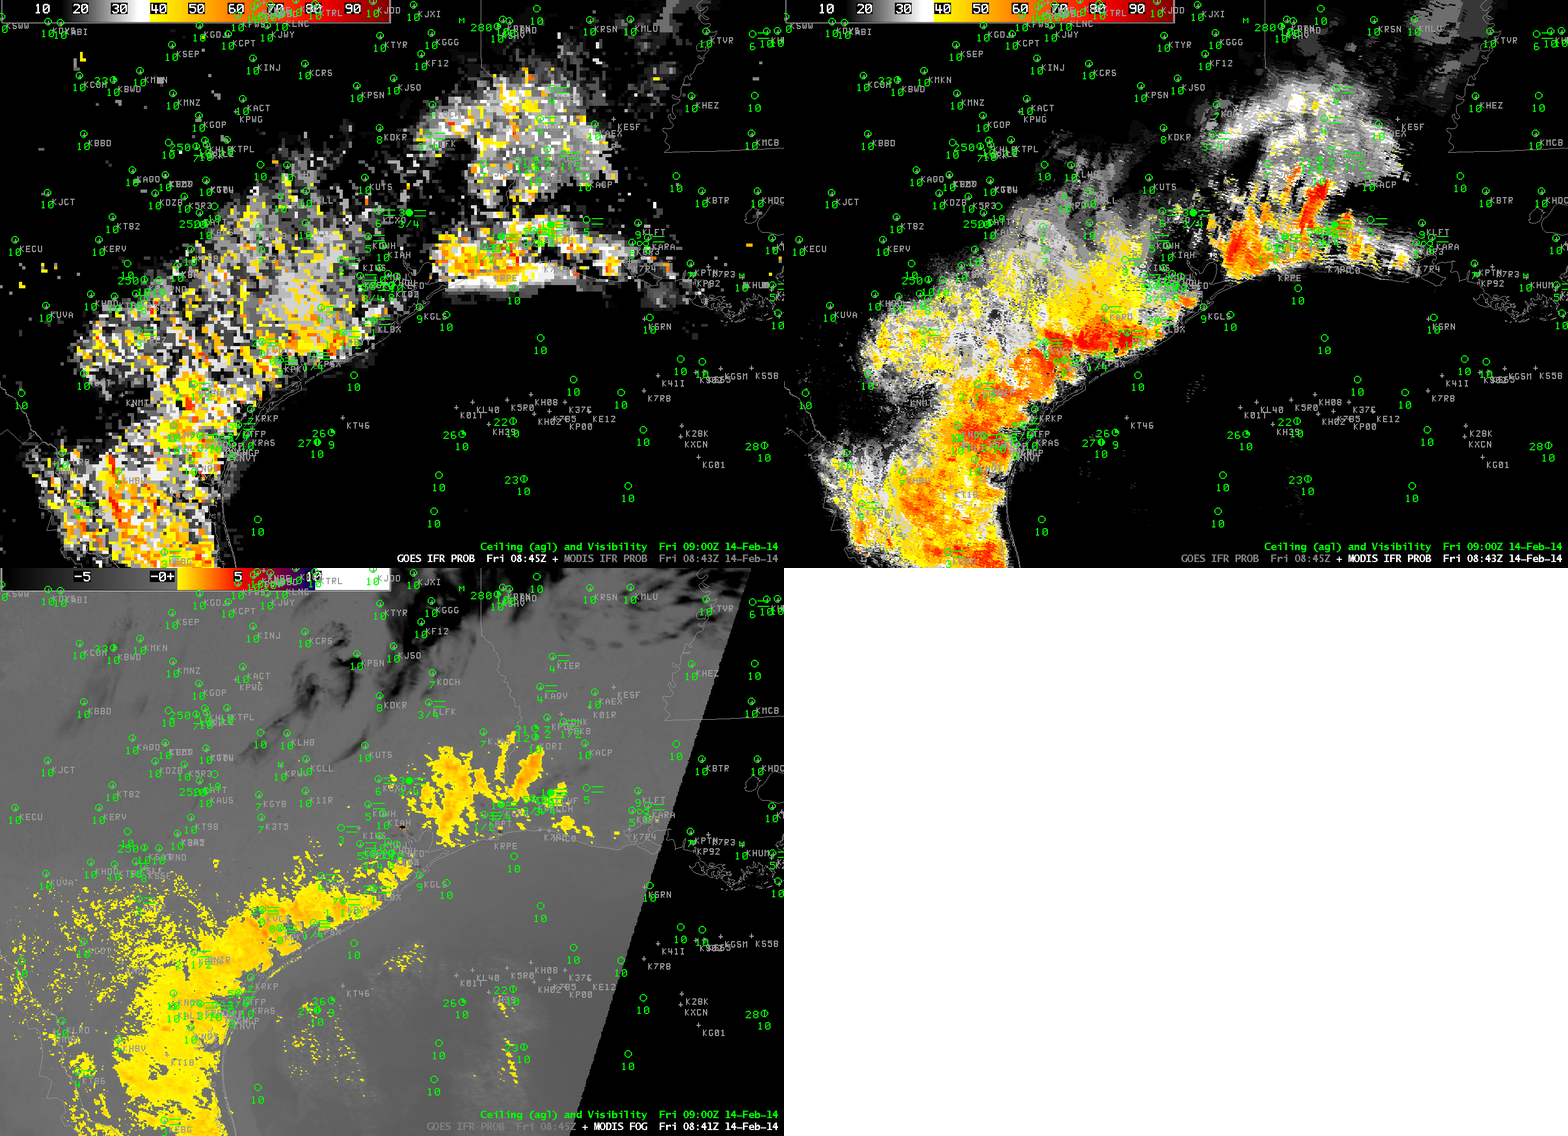
GOES-R IFR Probabilities, MODIS IFR Probabilities, and MODIS Brightness Temperature Difference fields, all from ~0845 UTC 14 February 2014 (click image to enlarge)
MODIS data can be used to generate IFR Probabilities as well, as shown above. The MODIS-based and GOES-based fields both generally overlap regions with developing IFR conditions. The MODIS-based Brightness temperature difference product (called MODIS FOG in the image annotation) shows little signal in central Louisiana/east Texas (near Lufkin, for example) or southwest of Houston, two places where near-IFR conditions are developing (and where the IFR Probability fields have a signal).

GOES-R IFR Probabilities, MODIS IFR Probabilities, and MODIS Brightness Temperature Difference fields, all from ~0845 UTC 14 February 2014 (click image to enlarge)
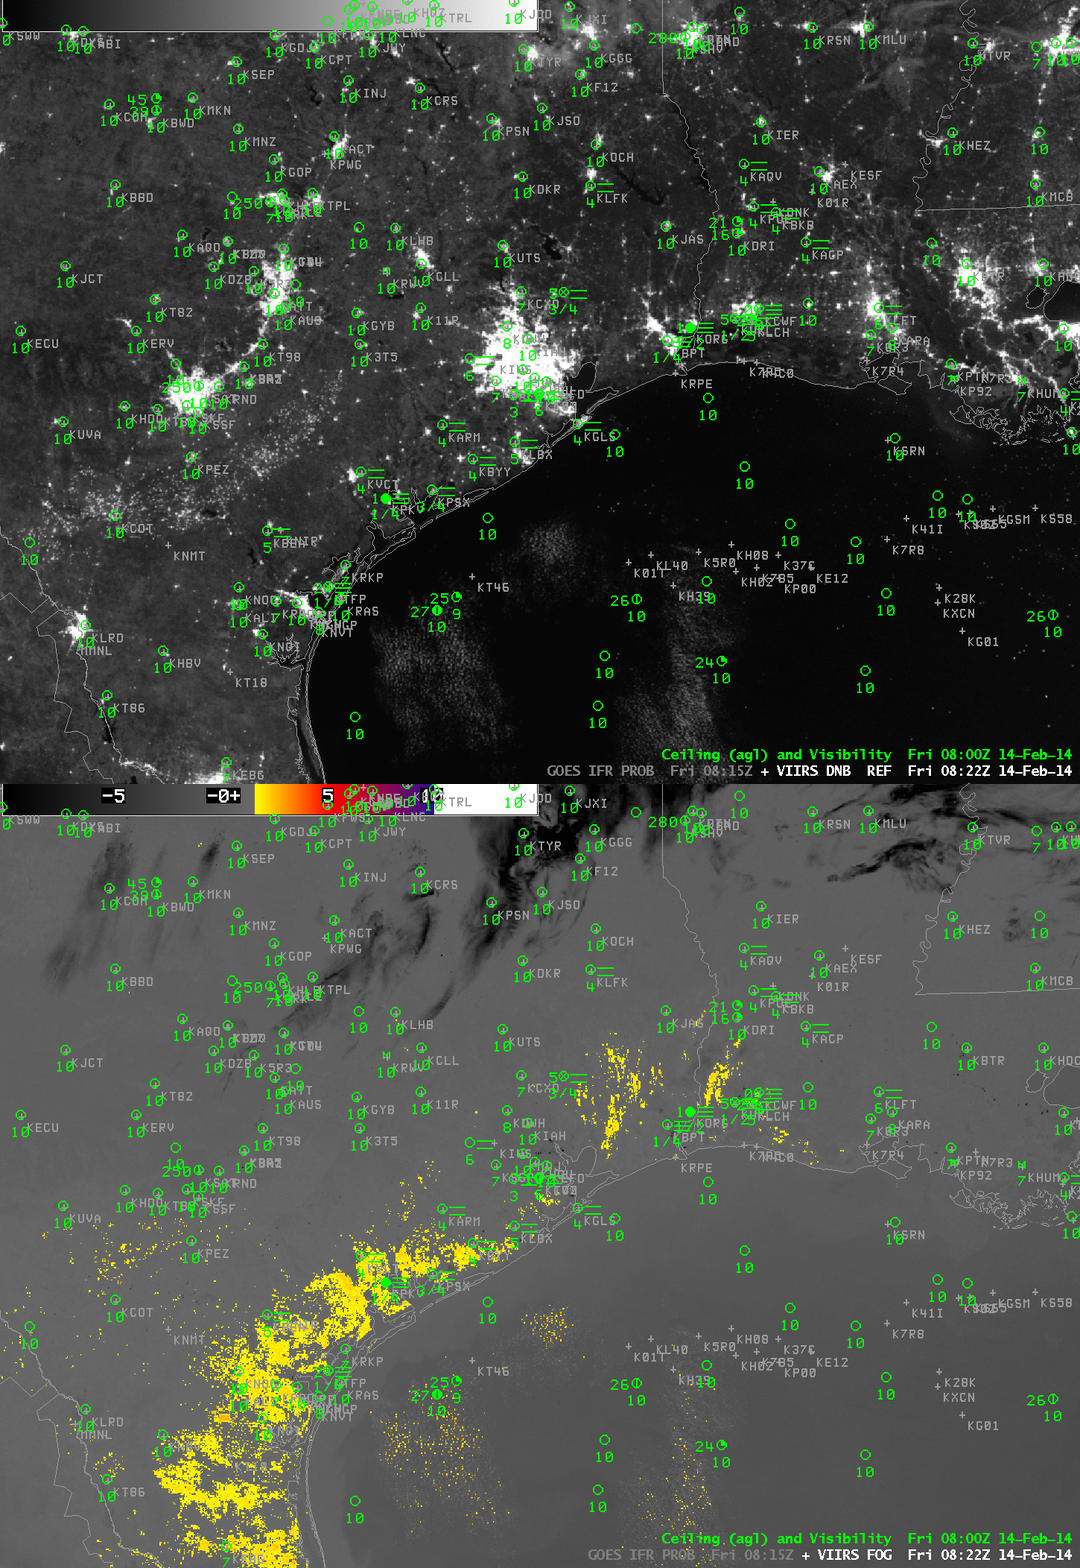
Suomi/NPP data (Brightness Temperature Difference fields, and the Day/Night band) from the same hour (0822 UTC) as the MODIS data similarly underpredicts the areal extend of the developing IFR conditions.

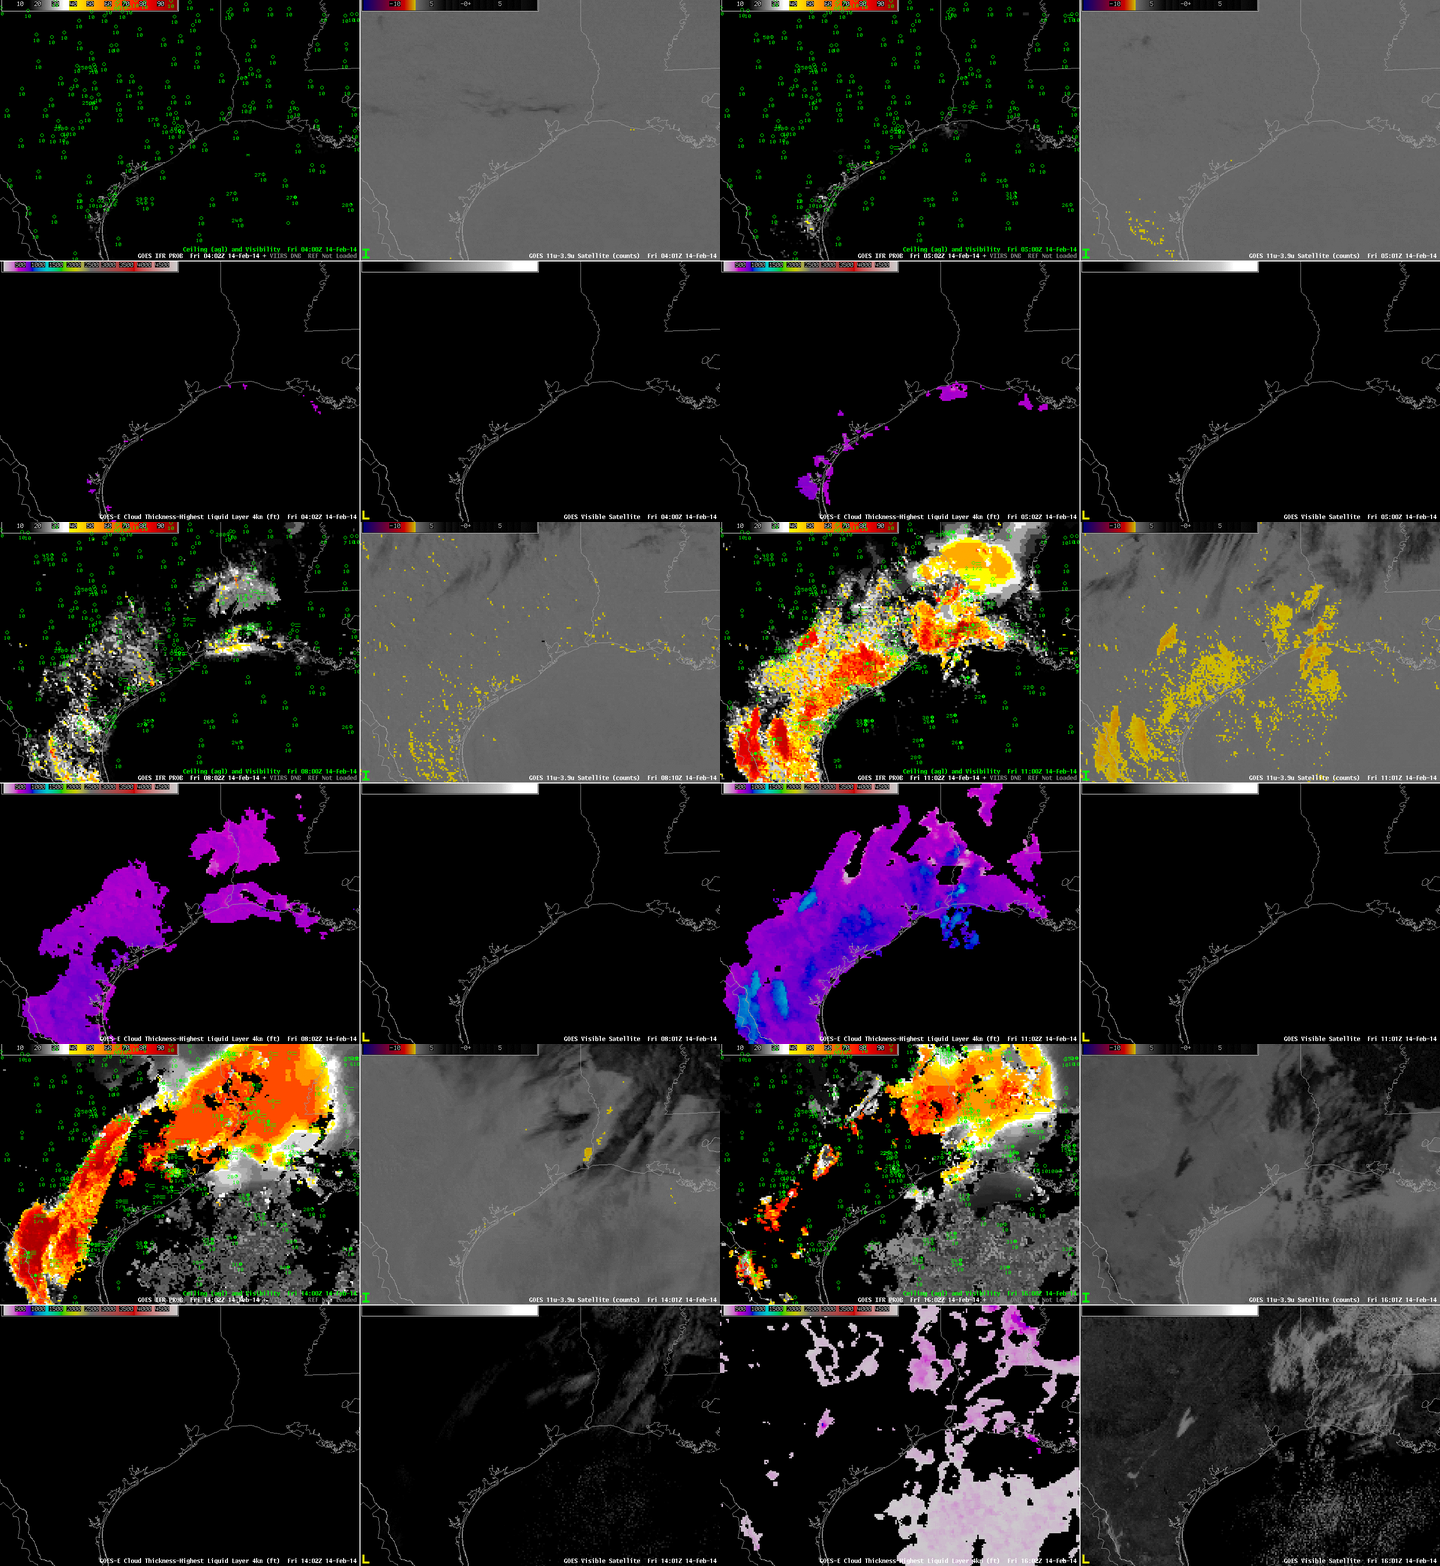
GOES-Based GOES-R IFR Probabilities (Upper Left), GOES-East Brightness Temperature Difference Fields (Upper Right), GOES-R Cloud Thickness (Lower Left), GOES-East Visible Imagery (Lower Right), hourly from 0400 UTC through 1600 UTC 14 February 2014 (click image to enlarge)
The animation above shows hourly views of GOES-R IFR Probability and GOES-East Brightness Temperature Difference fields. There is little discernible signal in the brightness temperature difference field until about 0915 UTC (several hours after the IFR Probability field has been suggesting fog development). Thus the GOES-R IFR Probability field is giving better lead time is diagnosing where visibility restrictions might occur/be occurring. In addition, the GOES-R Cloud Thickness product shows that the thickest fog/stratus field just before sunrise is just east of Austin/San Antonio, and that is the last region to clear out after sunrise.
The presence of high clouds has an effect on both the IFR Probability fields and the brightness temperature difference field. When high clouds are present (in the brightness temperature difference enhancement used, high clouds are dark), IFR Probabilities drop in value and the field becomes flatter because satellite data cannot be used in the computation of the IFR Probability Field.

