Monthly Archives: October 2012

GOES-R Probabilities evolve as the night progresses

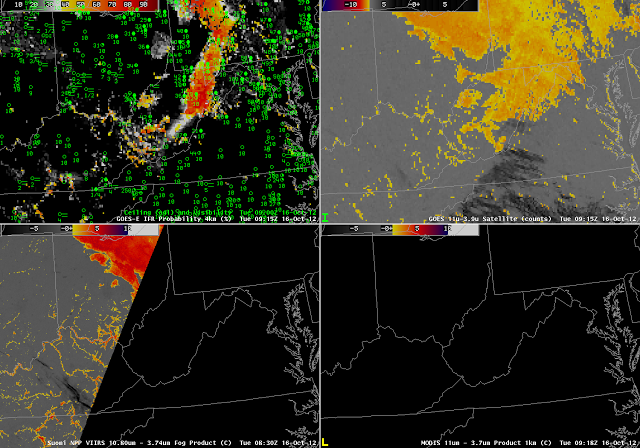
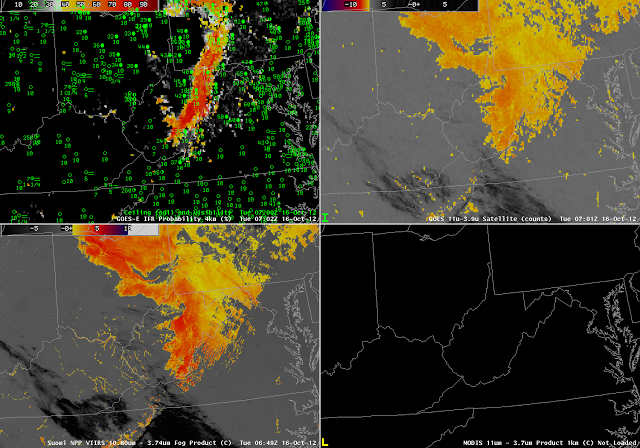
GOES-R IFR Probabilities computed from GOES-14 (upper left), GOES-14 heritage brightness temperature difference product (upper right), VIIRS heritage brightness temperature difference product (lower left), MODIS heritage brightness temperature difference product (lower right), all from near 0700 UTC.

MODIS and VIIRS yield satellite information that can be used to detect fog/low stratus at high spatial resolution.  In the exa,ple above, the VIIRS brightness temperature difference product highlights many river valleys as possibly cloud-filled over eastern Kentucky, southern Ohio and southwestern West Virginia.  The coarser resolution of the GOES satellite pixel precludes such fine-scale detection.  Note, however, that both satellite platforms detect the presence of stratiform water clouds over north-central Ohio where surface observations show only mid-level cloudiness.  IFR probabilities are confined to the spine of the Appalachians from the Laurel Mountains near Johnstown (PA) southward towards southern West Virginia.  How do things evolve with time?
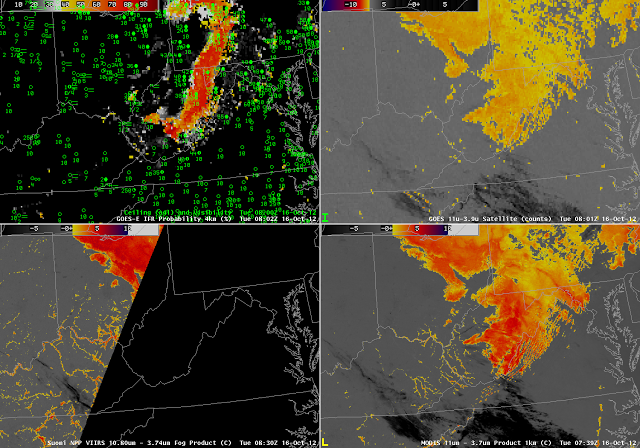
As above, but from near 0800 UTC

As above, but from near 0915 UTC

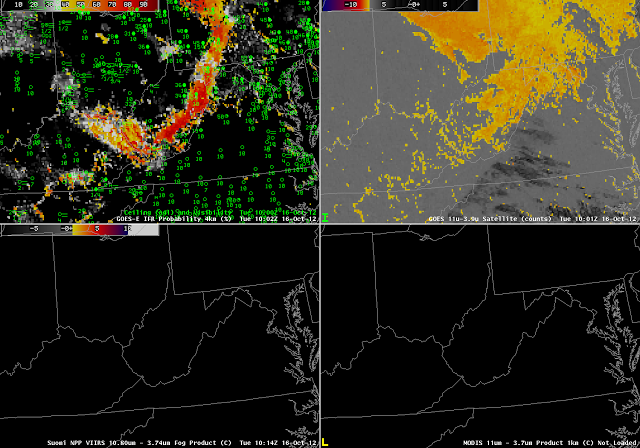
As above, but from near 1000 UTC

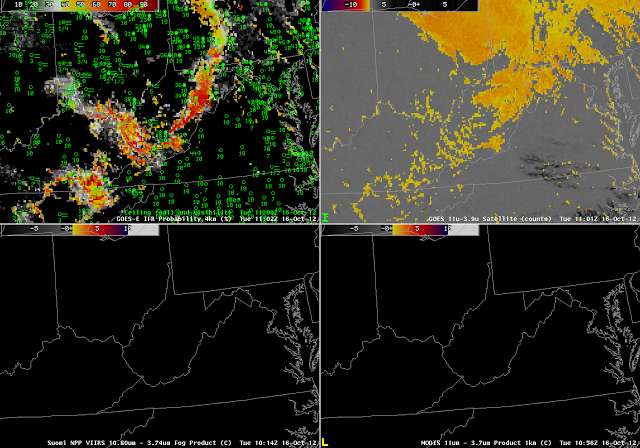
As above, but from near 1100 UTC

The power of GOES imagery in this case is to show the evolution of the fog/low stratus field.  Even at this only-hourly timestep, the development of regions of IFR conditions is evident, and those developing conditions occur in tandem with increasing probabilities in the GOES-R IFR Probability field.  Throughout the night, the GOES brightness temperature difference field flags the unimportant (from an aviation standpoint) stratus deck over northcentral Ohio, and the IFR probability field, which field also uses Rapid Refresh Model data, discounts the satellite signal.  By 1100 UTC, the river valley signal has strengthened enough in the GOES imagery to appear, and a corresponding increase in IFR probability occurs.

IFR Probability can also be computed using MODIS data (below). The 0739 UTC MODIS data, shown at the top of this blog post, highlights — as does GOES — the stratus deck over northern Ohio.  The MODIS-based IFR probabilities, however, do not highlight that cloud-deck, by design.  Note also that the higher-resolution MODIS imagery, because it detects river valley fogs at 0739 UTC, also has a strong IFR probability signal there.  Pixel resolution on GOES-R will be intermediate between MODIS and present GOES.
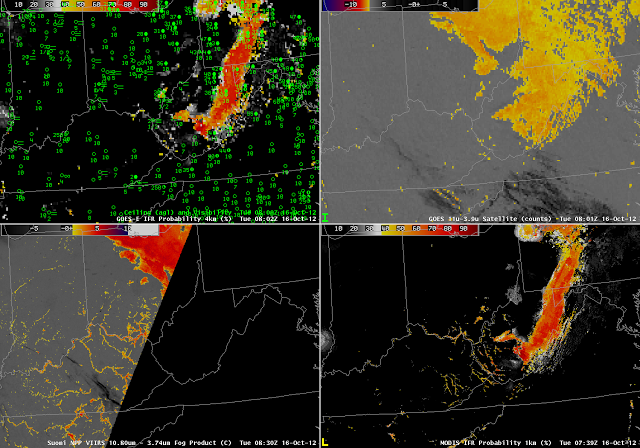
As at top, for near 0800 UTC, but with MODIS-based IFR probabilities in the lower right

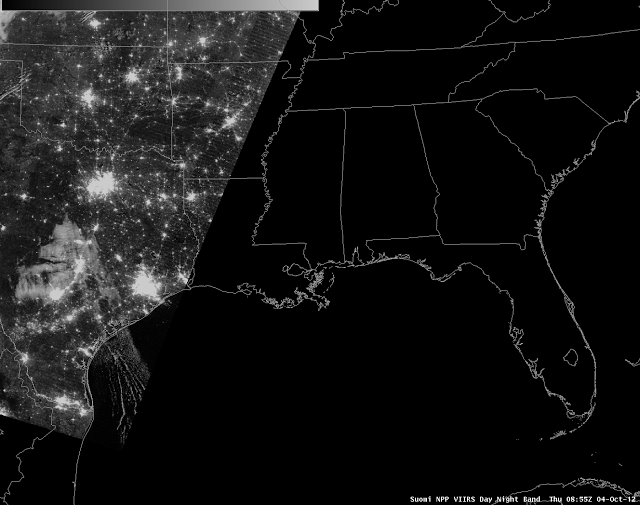
Day/Night band and fog detection

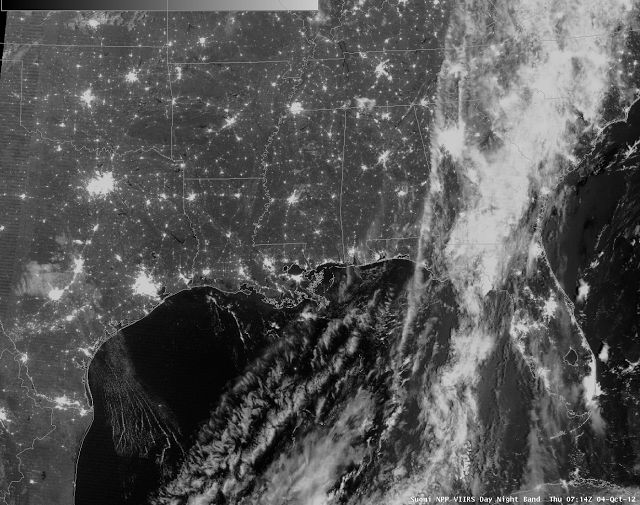
Day/Night band from VIIRS on Suomi/NPP from 0714 UTC on 4 October 2012

The day/night band imagery, above, shows fog/low clouds in the Hill Country west of San Antonio and Austin in south-central Texas.  Additionally, there are low clouds over the Gulf of Mexico, with cloud street structures that suggest a south-southeasterly wind bringing moisture inland from the Gulf.  The 0855 UTC day/night band image over the same domain, below, shows an expansion of the fog/low cloud signal.

Day/Night band from VIIRS on Suomi/NPP from 0855 UTC on 4 October 2012
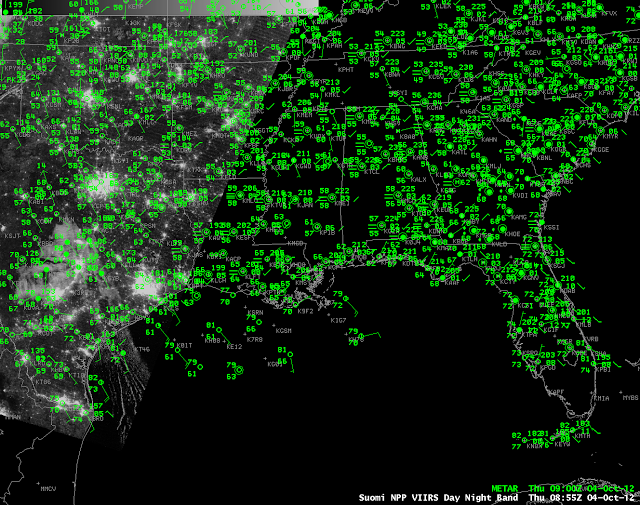
Day/Night band from Suomi/NPP with observations overlain.

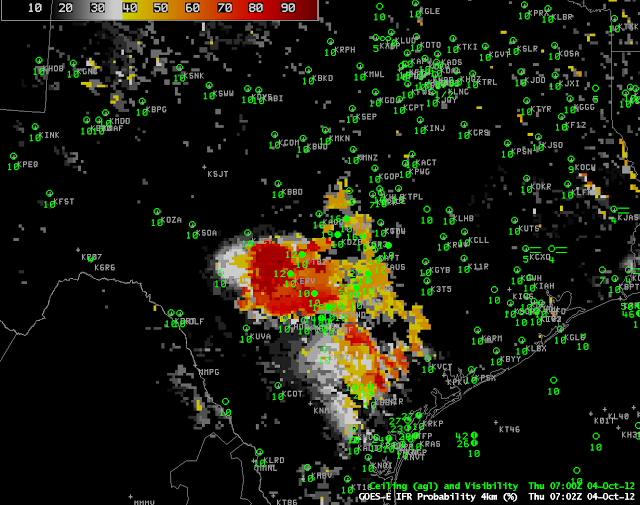
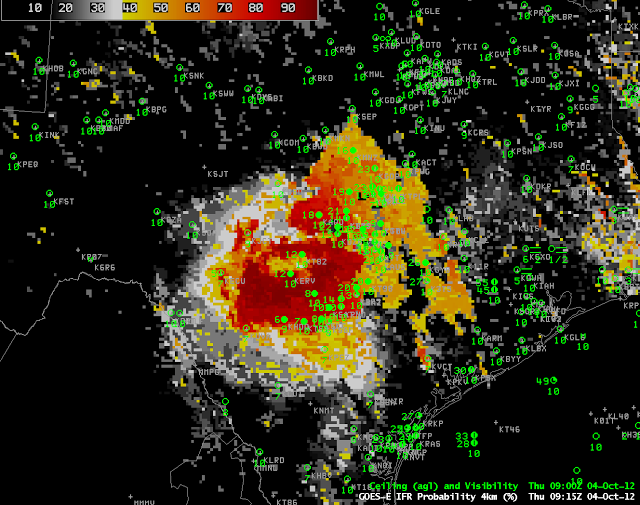
Observations suggest that the northern edge of the cloud streets over the extreme western Gulf of Mexico is the edge of a moisture gradient, and that that gradient extends inland to where the fog and low stratus are occurring.  How did the GOES-R IFR Probability field perform on this day?  The 0702 UTC (below) and 0915 UTC IFR probability fields show an increas in the areal extent of higher probabilities over the course of the night, consistent with the overnight cooling and the continued feed of moisture from the Gulf.  By 0900 UTC, IFR observations are common in and near the region where IFR probabilities are high.  This is a good example of how the Day/Night band and IFR Probabilities can be used in concert to understand the evolution of the fog/low stratus field over south Texas.

FLS detection over the upper midwest

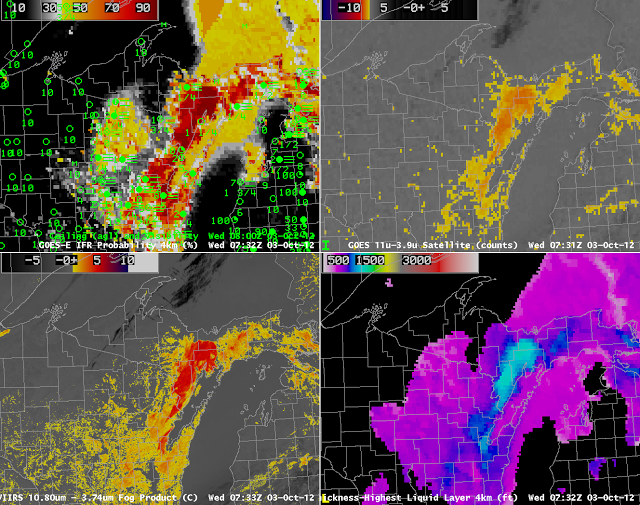
0730 UTC GOES-R IFR Probabilities computed from GOES-14 (Upper left), Traditional Brightness Temperature difference (10.7 µm – 3.9 µm) from GOES-14 (Upper Right), Brightness Temperature Difference (11.35 µm – 3.74 µm) from VIIRS on Suomi/NPP (Lower left),  Thickness of highest Liquid Water Cloud Layer (Lower Right)

Low cloud formation over northern and northeastern Wisconsin early in the morning of October 3rd 2012 demonstrated some strengths of the fused GOES-R Fog/Low Stratus product.  Note that the 0732 UTC GOES-R IFR Probability has a pocket of higher probabilityes over north-central Wisconsin (near Vilas and Oneida Counties) in a region where the traditional brightness temperature difference has a weak signal, and in a region where surface observations indicate fog is present. This region is a good example of how the model RH data can amplify weak satellite signals where fog/low clouds are present but the satellite signal alone may not be strong enough to detect it.

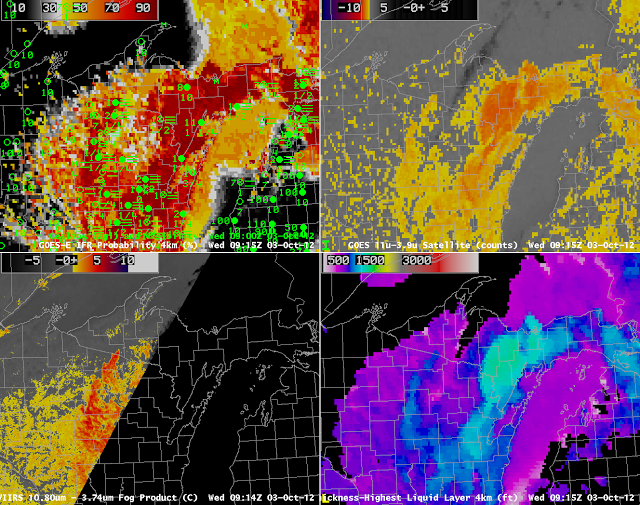
0915 UTC GOES-R IFR Probabilities computed from GOES-14 (Upper left), Traditional Brightness Temperature difference (10.7 µm – 3.9 µm) from GOES-14 (Upper Right), Brightness Temperature Difference (11.35 µm – 3.74 µm) from VIIRS on Suomi/NPP (Lower left),  Thickness Of highest Liquid Water Cloud Layer (Lower Right)

At 0915 UTC, the region of IFR conditions in north-central Wisconsin persists.  At this time, however, the satellite signal also increases showing a signature consistent with low clouds/fog, and therefore GOES-R IFR probabilities significantly increase.  Two things should be clear.  First, the GOES-R IFR probability predicted the presence of Fog/Low Stratus before satellite signal was strong enough to detect it alone (a benefit of using a fused data product) and could be used better to nowcast the evolving boundary layer.  Second,  GOES-R IFR Probabilities when the model signal (in this case, the Rapid Refresh) is strong and the satellite signal is weak are lower than when both model and satellite signals are strong.  This is always the case.

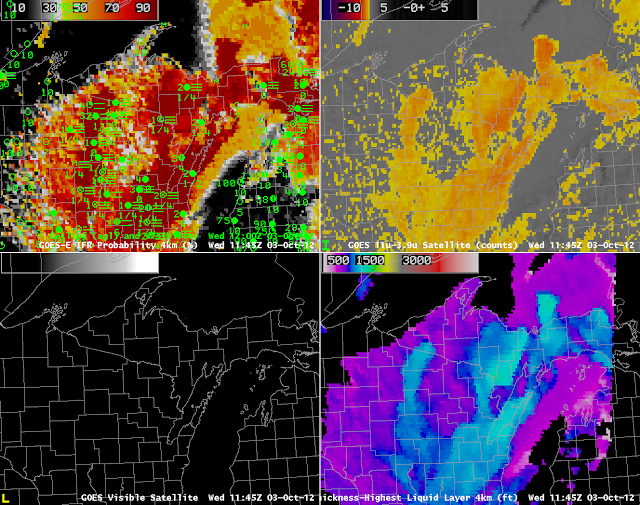
1145 UTC GOES-R IFR Probabilities computed from GOES-14 (Upper left), Traditional Brightness Temperature difference (10.7 µm – 3.9 µm) from GOES-14 (Upper Right), Visible Imagery (0.62 µm) from GOES-14 (Lower left),  Thickness Of highest Liquid Water Cloud Layer (Lower Right)

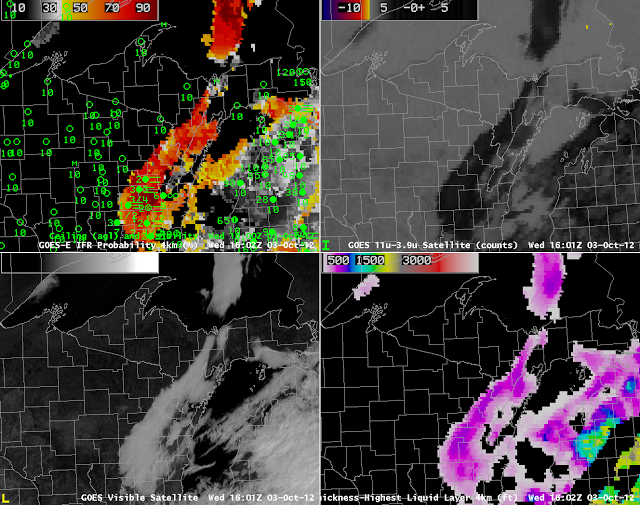
The 1145 UTC shows the last pre-dawn estimate of Cloud Thickness over north-central Wisconsin (the terminator is apparent, running north-south through the Straits of Mackinac).  Estimated cloud thickesses over Vilas and Oneida counties are between 1000 and 1150 feet, vs. 1250 feet over Green Bay and more than 1300 feet over southern Upper Michigan.  Predictably, then, the fog/low stratus over north-central Wisconsin dissipates before the fog/low stratus over northeast Wisconsin and eastern Upper Michigan (see below).

1602 UTC GOES-R IFR Probabilities computed from GOES-14 (Upper left), Traditional Brightness Temperature difference (10.7 µm – 3.9 µm) from GOES-14 (Upper Right), Visible Imagery (0.62 µm) from GOES-14 (Lower left),  Thickness Of highest Liquid Water Cloud Layer (Lower Right)

Difficulties detecting FLS over arid regions using satellite alone.

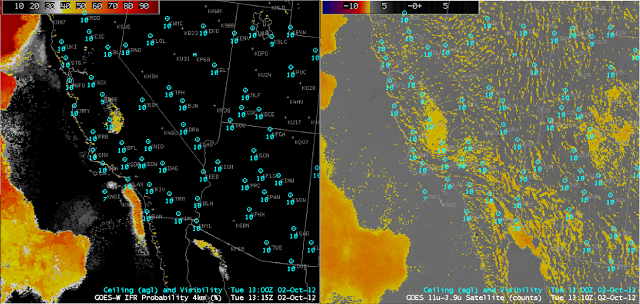
GOES-R IFR probabilities (top left) and the traditional 3.9-11 micron brightness temperature difference (top right) from GOES-West on October 2, 2012 at 13:30 UTC. The blue circles are surface observations with the surface visibility (in miles) below. 
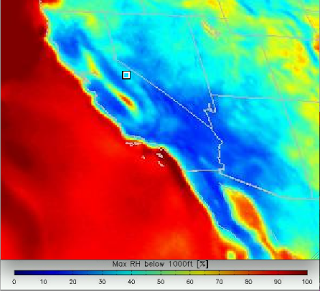
The maximum relative humidity in the lowest 1000ft layer above ground level from the Rapid Refresh forecast model valid at 13:15 UTC on October 2, 2012.
The traditional 3.9-11 micron brightness temperature difference (BTD) used to detect liquid stratus clouds exploits the emissivity differences at the 3.9 and 11 micron wavelengths. Liquid water clouds typically emit less at 3.9 microns than at 11 microns and this difference can be used to differentiate them from other types of clouds. This method works well when the liquid stratus clouds are the highest cloud layer and are distinguishable from the background surface characteristics. However, fog/low stratus (FLS) detection over arid regions can be difficult using satellite data alone because the very dry land surface typically has a low surface emissivity at the 3.9 micron wavelength as well, resulting in a satellite signal very similar to that of liquid stratus clouds. This is shown in the top right image above where the arid regions of the SW U.S. have a similar BTD signal as the status clouds offshore California even though all the surface observations in the area indicate no clouds are present. 
The GOES-R IFR product (top left image above) can greatly reduce the false satellite signal caused by the land surface by incorporating model relative humidity (RH) data. For the GOES-R IFR product the satellite data is combined with the maximum RH found in the lowest 1000 ft layer above ground level from the Rapid Refresh RH profiles using a naive bayesian probabilistic model. FLS generally occurs when the low-level RH is relatively high (> 80%). The low level RH in arid regions is usually very low (< 30%), so even when the satellite signal is strong, indicating FLS may be present,  the weak model signal works to lower the probability that FLS is present. 
However, sometimes the low-level RH can be elevated over dry land surfaces when clouds are not present. When this occurs, the relatively high model signal along with the relatively high satellite signal (from the land surface) indicate there is a greater chance that FLS may be present so the GOES-R IFR probabilities are slightly elevated. This is shown in the top left image above where an area of elevated GOES-R IFR probabilities in central California indicate that there is a roughly 40% chance that IFR conditions are present even though the surface stations report clear skies. The low-level modeled RH from the Rapid Refresh model (bottom image above) indicates a sliver of elevated RH (> 80%) in central California. This area of elevated low-level RH combined with the relatively higher satellite signal (from the land surface) resulted in the GOES-R IFR probabilities being slightly elevated. GOES-R IFR probabilities around 40% are considered to be relatively low and, combined with the surrounding surface observations, forecasters should feel pretty confident that this is indeed a false signal and that FLS is not present.

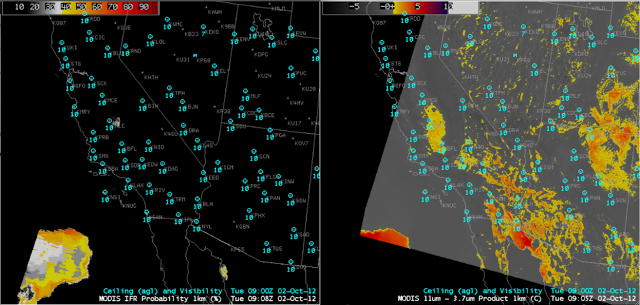
GOES-R IFR probabilities (left) and the traditional 11-3.9 micron brightness temperature difference (right) from MODIS on October 2, 2012 at 9:05 UTC. The blue circles are surface observations with the surface visibility (in miles) below.

The higher spatial resolution (1 km) MODIS instrument shows in more detail the elevated traditional BTD satellite signal caused by the arid land surface (right image) over the SW U.S. The GOES-R IFR probabilities applied to MODIS (left image) again show how the GOES-R IFR product significantly reduces the false FLS signal that is seen in the traditional BTD product.