 |
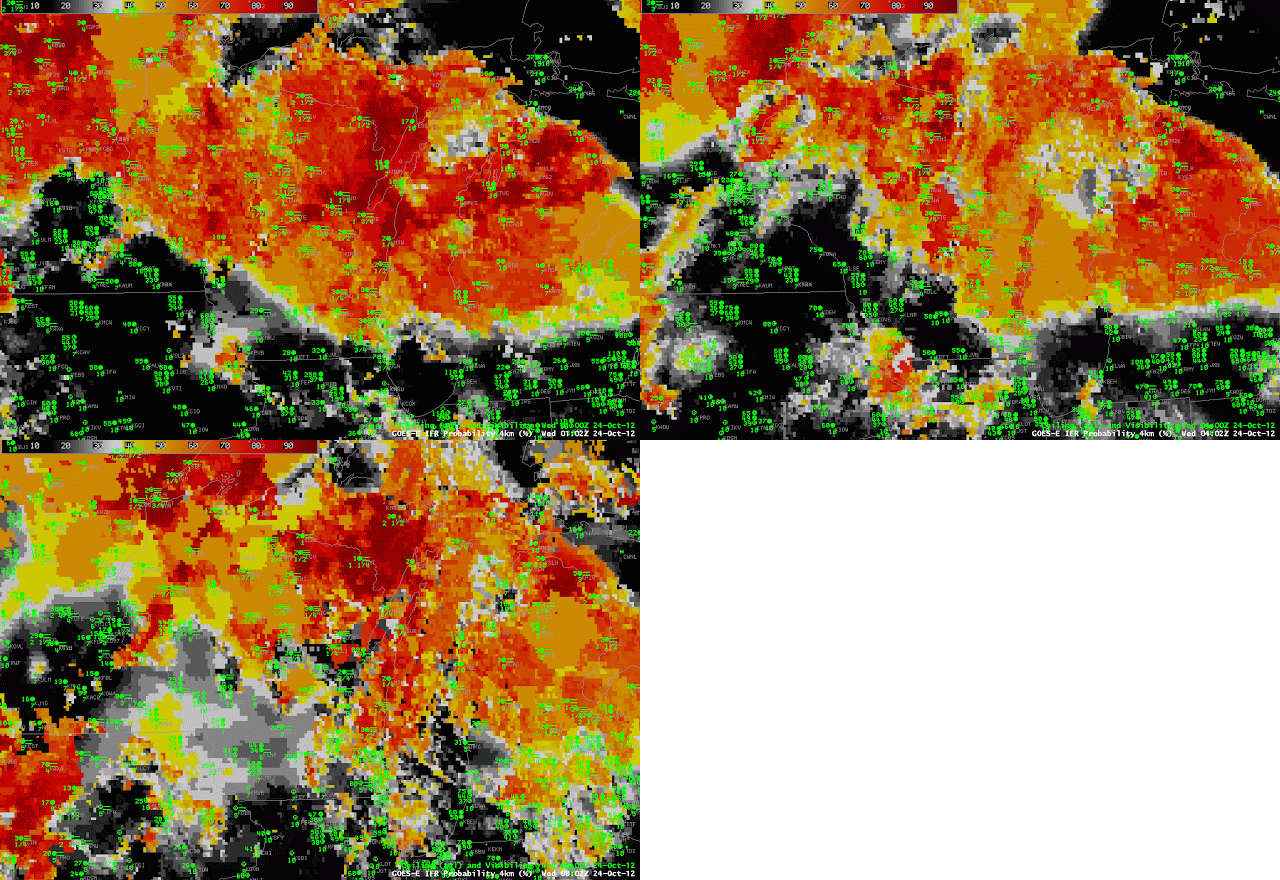
| GOES-R IFR Probabilities at 0100, 0400 and 0800 UTC on 24 October 2012 |
Dewpoints in the low 60s (Fahrenheit) surging into the upper Midwest in late October heighten the chances of fog, and the GOES-R Fog/Low Stratus product did a commendable job of showing where the fog might be occurring. The loop above shows the IFR Probabilities over Wisconsin, Iowa and Minnesota as well as visibility/ceiling observations. The northwest-southeast edge of higher probabilities over southern to west-central Wisconsin at 0100 UTC matches the observations well: IFR conditions prevail in regions north and east of that line. Note also, at 0400 UTC, the skinny region of enhanced IFR probabilities that hugs the western shore of Lake Michigan. Lake Michigan lake surface temperatures are in the low 40s, so dewpoints above 50 will result in a dense advection fog. Heightened probabilities continue at 0800 UTC over northern and eastern Wisconsin, in agreement with observations.
 |
| Heritage Fog Detection, brightness temperature difference, at 0100, 0400 and 0800 UTC on 24 October |
The Brightness temperature difference field historically has been used to diagnose the presence of low clouds, and the animation above shows the importance of using fused products — that include some kind of influence from surface observations as occurs in the Rapid Refresh — to clarify exactly where the low clouds that obstruct visibility are common. Consider the field at 0100 UTC. The IFR probability delineates between higher visibility over southern/western Wisconsin and lower visibilities north and east. No such delineation occurs in the tradiational product because the brightness temperature difference alone cannot indicate the ceiling.
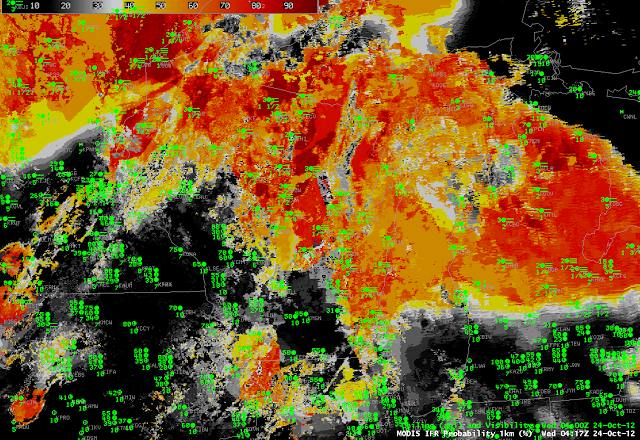
MODIS data is also used to create IFR Probability fields, and the 0417 UTC imagery is shown below.
 |
| MODIS-based GOES-R IFR Probabilities, 0417 UTC 24 October. |
