 |
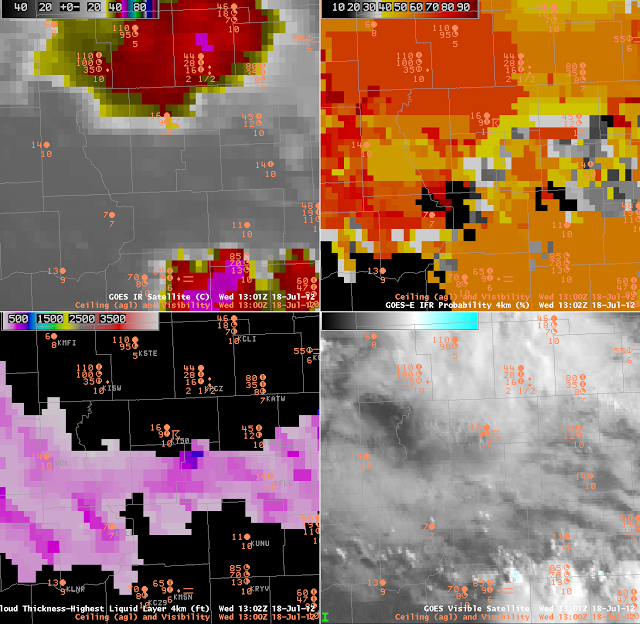
| GOES-East Enhanced 10.7-micrometer imagery (Upper left), GOES-R IFR Probability (upper right), GOES-R Cloud Phase (lower left), GOES-East Visible imagery (lower right) |
This blown-up version of satellite-based (and fused) products over central Wisconsin on the morning of 18 July 2012 shows how the use of different predictors in the GOES-R IFR probability field can be discerned from the character of the field produced. This was a morning with MVFR/IFR conditions over central Wisconisin (600-foot ceilings at Marshfield (KMFI) and 700-foot ceilings at Wisconsin Dells (KDLL), for example). IFR probabilities were high in the regions where IFR conditions were observed, but note how smooth the field is in the northwest and southeast part of the GOES-E IFR probability image. In the regions under the anvil cirrus (cold cloud-tops as depicted in the 10.7 micrometer image, upper left), the GOES-R IFR Probability algorithm will rely on model data. In this case, the relative humidity in the RAP forecast has more influence because the high clouds mean the satellite signal is not from a fog/low stratus layer and therefore does not influence the IFR probabiltiies. The layer relative humidity in the model is likely higher in the northwestern part of the image (where GOES-R IFR probabilities are in the 70% range) than in the southeastern part of the image (where GOES-R IFR probabilities are in the 50% range). Over the central part of the GOES-R IFR Probability image, the absence of high clouds allows satellite information to be used, and a more variable field results that has a mirror in the variability of the satellite observations in that area. This region is also where Cloud Thickness diagnoses can be made.
