Fog over upstate New York and northern Pennsylvania

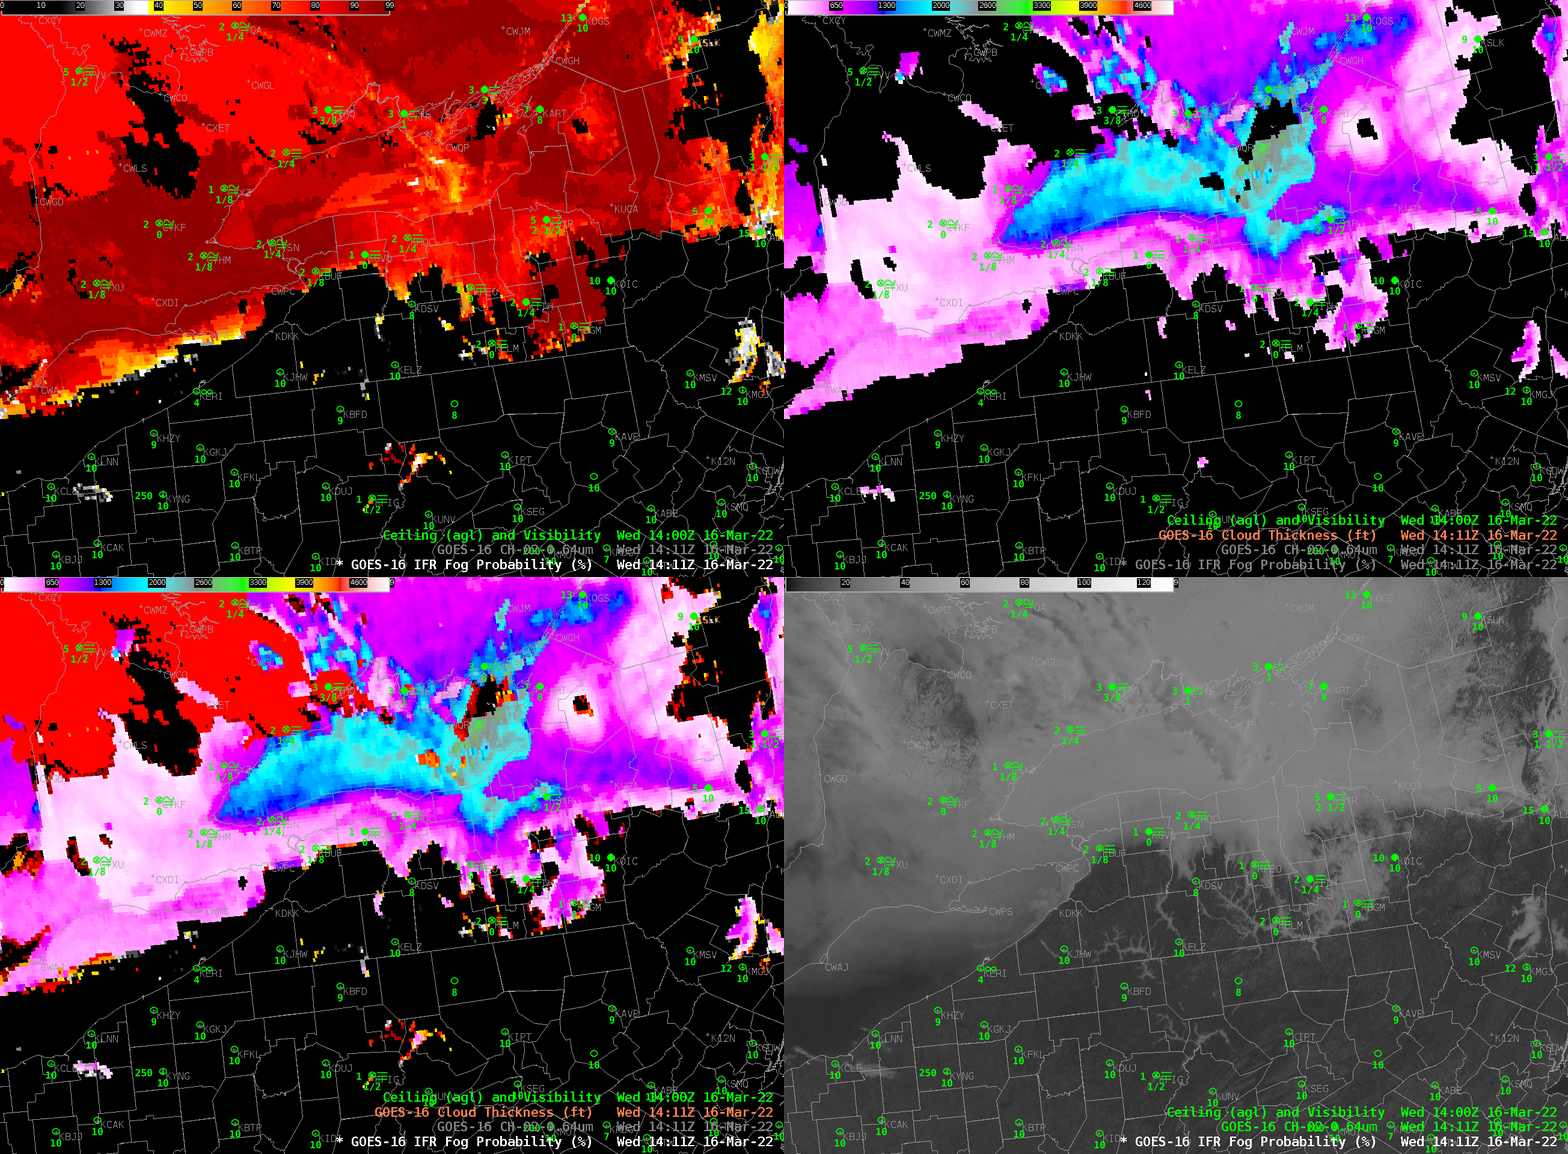
GOES-16 Band 2 Visible (0.64 µm) imagery, IFR Probability fields, GOES-R Cloud Thickness, 1411 UTC on 16 March 2022. Surface observations of ceilings and visibilities at 1400 UTC are also included. (Click to enlarge)

The toggle above shows early-morning (1411 UTC, i.e., 9:11 AM EDT) Fog in valleys over northern Pennsylvania and the southern tier of upstate New York. IFR Probability fields neatly overlap the regions of reduced ceilings and visibilities, with some exceptions in the narrow river valleys where visible imagery (with 0.5-km resolution at nadir) can easily resolve tendrils of fog; infrared data (with nadir resolution of 2 km) used by IFR Probability struggles to identify fog in those regions. The thickest fog is indicated over Lake Ontario.

Cloud Thickness fields can be used to estimate when fog will dissipate. If you observe the last image before sunrise (Cloud Thickness is not computed for a time period when the sun rises — or sets — because of rapid changes in the reflected component of shortwave infrared — 3.9 µm — solar radiation). Note in the image the diagnosed thinness to the fog over the river valleys. You might expect that fog to dissipate first. Cloud Thickness is not computed in regions of multiple cloud layers, such as, in this case, southwestern Ontario, where only the IFR Probability field is shown.
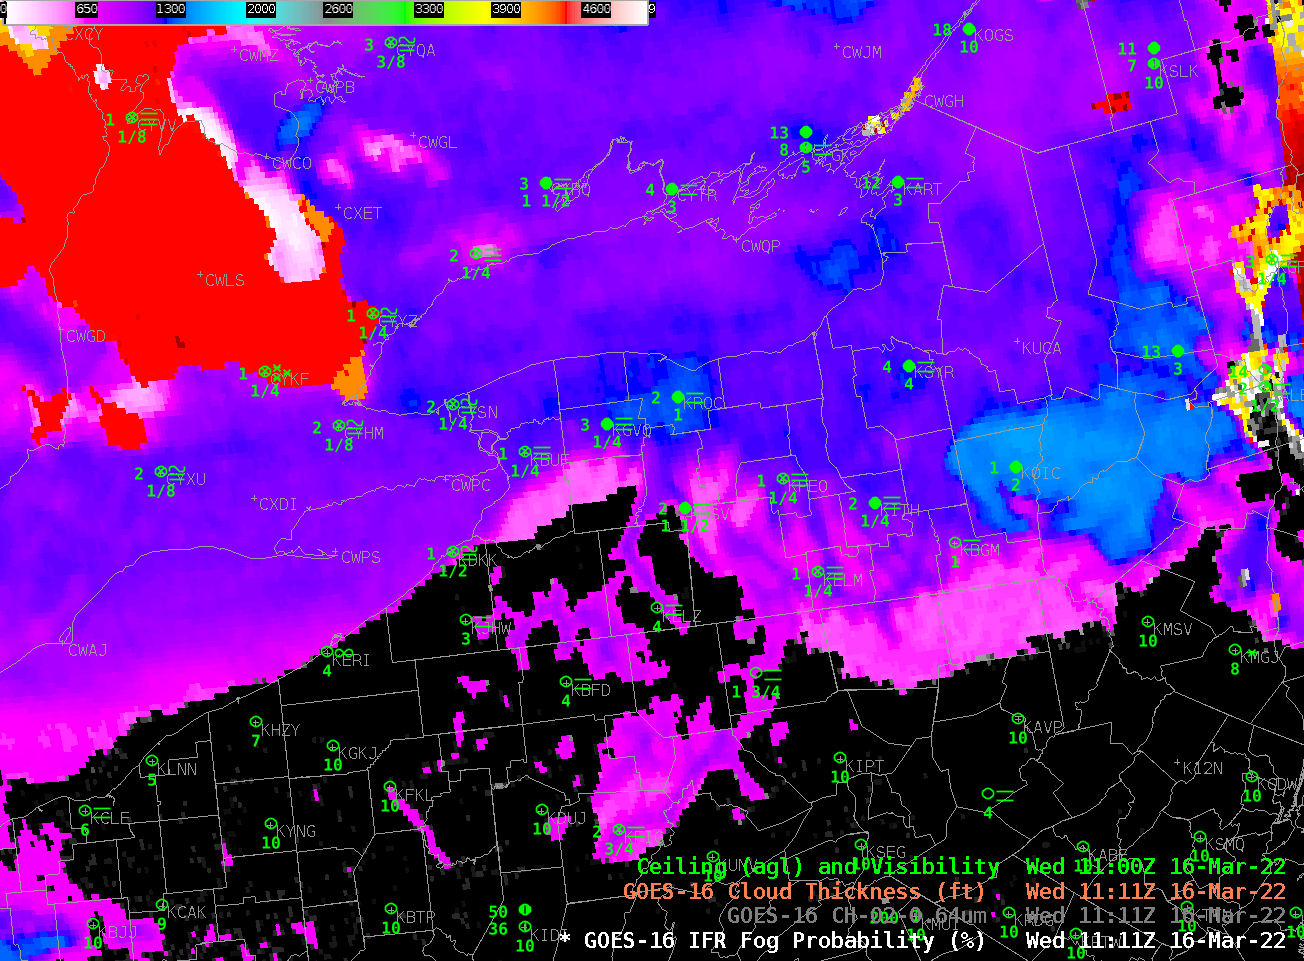
GOES-16 IFR Probability and Cloud Thickness, 1111 UTC on 16 March 2022, along with observations of ceiling heights and visibilities (Click to enlarge)

What did things look like at 1700 UTC, after the daily rise in temperature had caused substantial erosion of fog? The image below shows fog persisting over Lake Ontario, where IFR Probabilities are uniformly high. IFR conditions persist north of the lake but the southern shore of Lake Ontario shows less obstruction; one might (correctly!) infer southerly winds over the region. Indeed, Rochester and Buffalo both show southerly winds and dewpoints near 40. Toronto on the north shore of Lake Ontario has light southeast winds and fog at this time. There is a noteworthy east-west boundary in IFR Probability to the south of Wiarton, Ontario (METAR CYVV with 2-mile visibility and a 3500-foot ceilings, the station just south of the Bruce Peninsula). Careful inspection of the visible imagery there reveals an east-west cirrus cloud, so that IFR Probability is being computed mostly with output from the Rapid Refresh model there; the model is indicating low-level saturation so IFR Probabilities are large. Just to the south, clouds are not indicated, so IFR Probabilities are small.
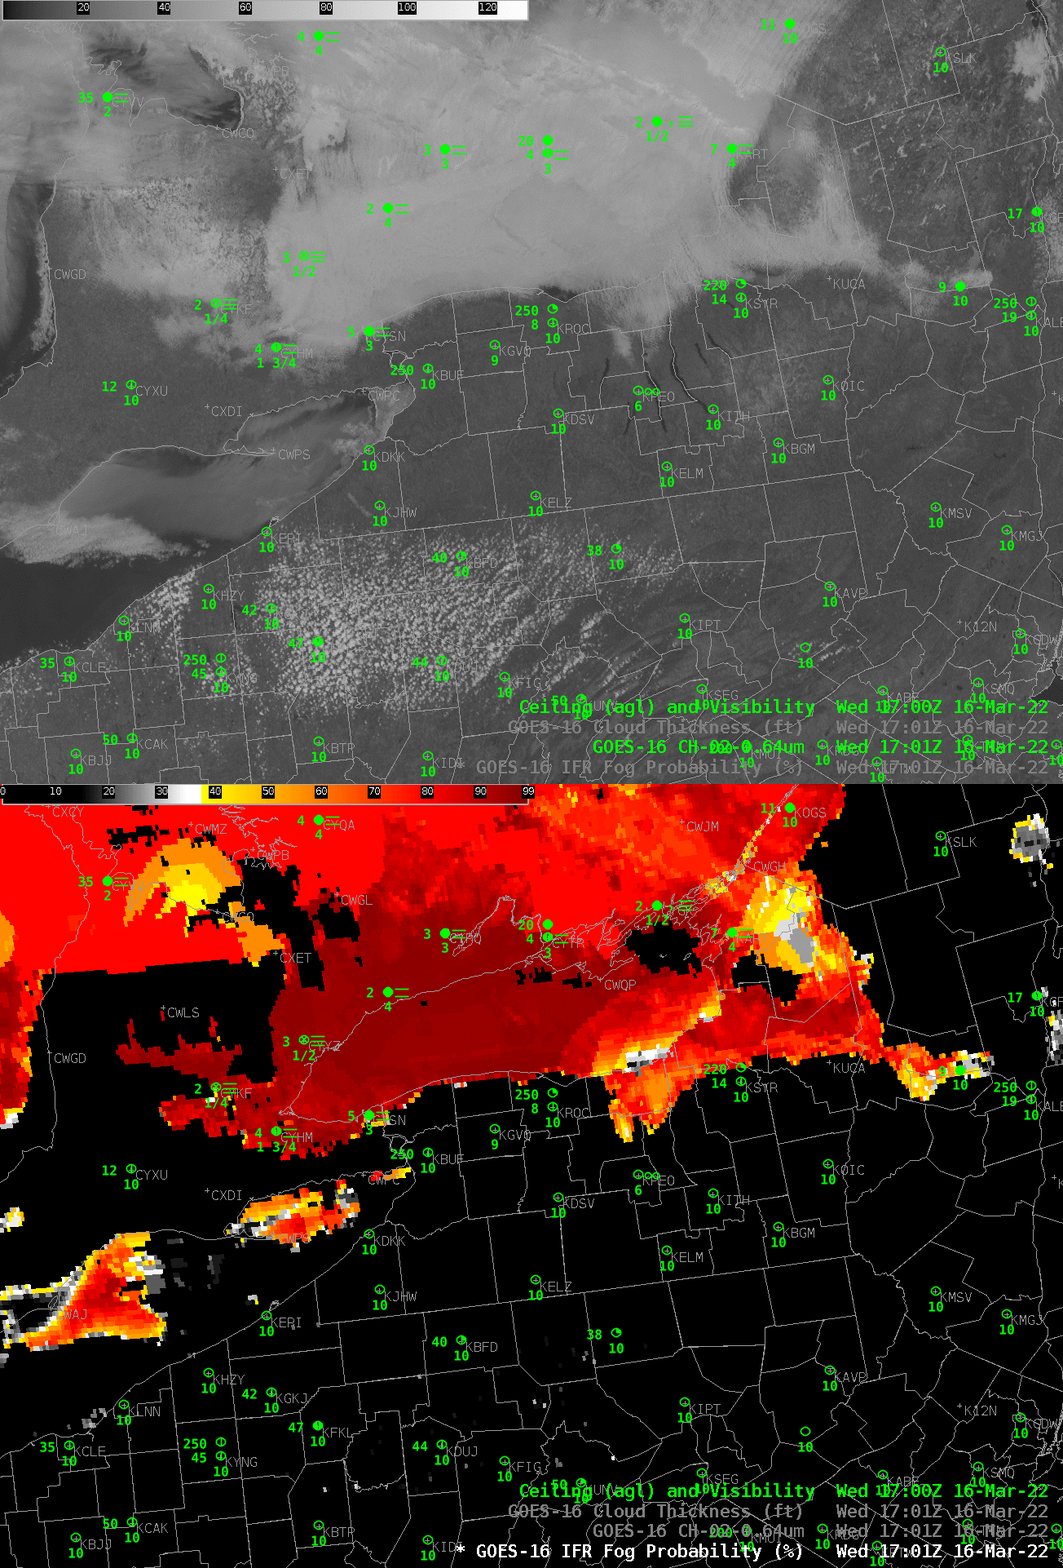
GOES-16 Band 2 Visible (0.64 µm) imagery and IFR Probability fields, 1701 UTC on 16 March 2022. Surface observations of ceilings and visibilities at 1700 UTC are also included. (Click to enlarge)

There are many ways to detect low clouds/fog day and night. In this case, a lack of high clouds over Pennsylvania meant that the Night Microphysics RGB gave a good signal where stratus clouds were present. IFR Probability allows for a consistent signal from night into day — and it includes a consistent signal where high clouds prevent the Night Microphysics RGB from indicating low clouds (Click here to see a toggle between the Night Microphysics RGB and GOES-R IFR Probability (with surface observations) at 1111 UTC).

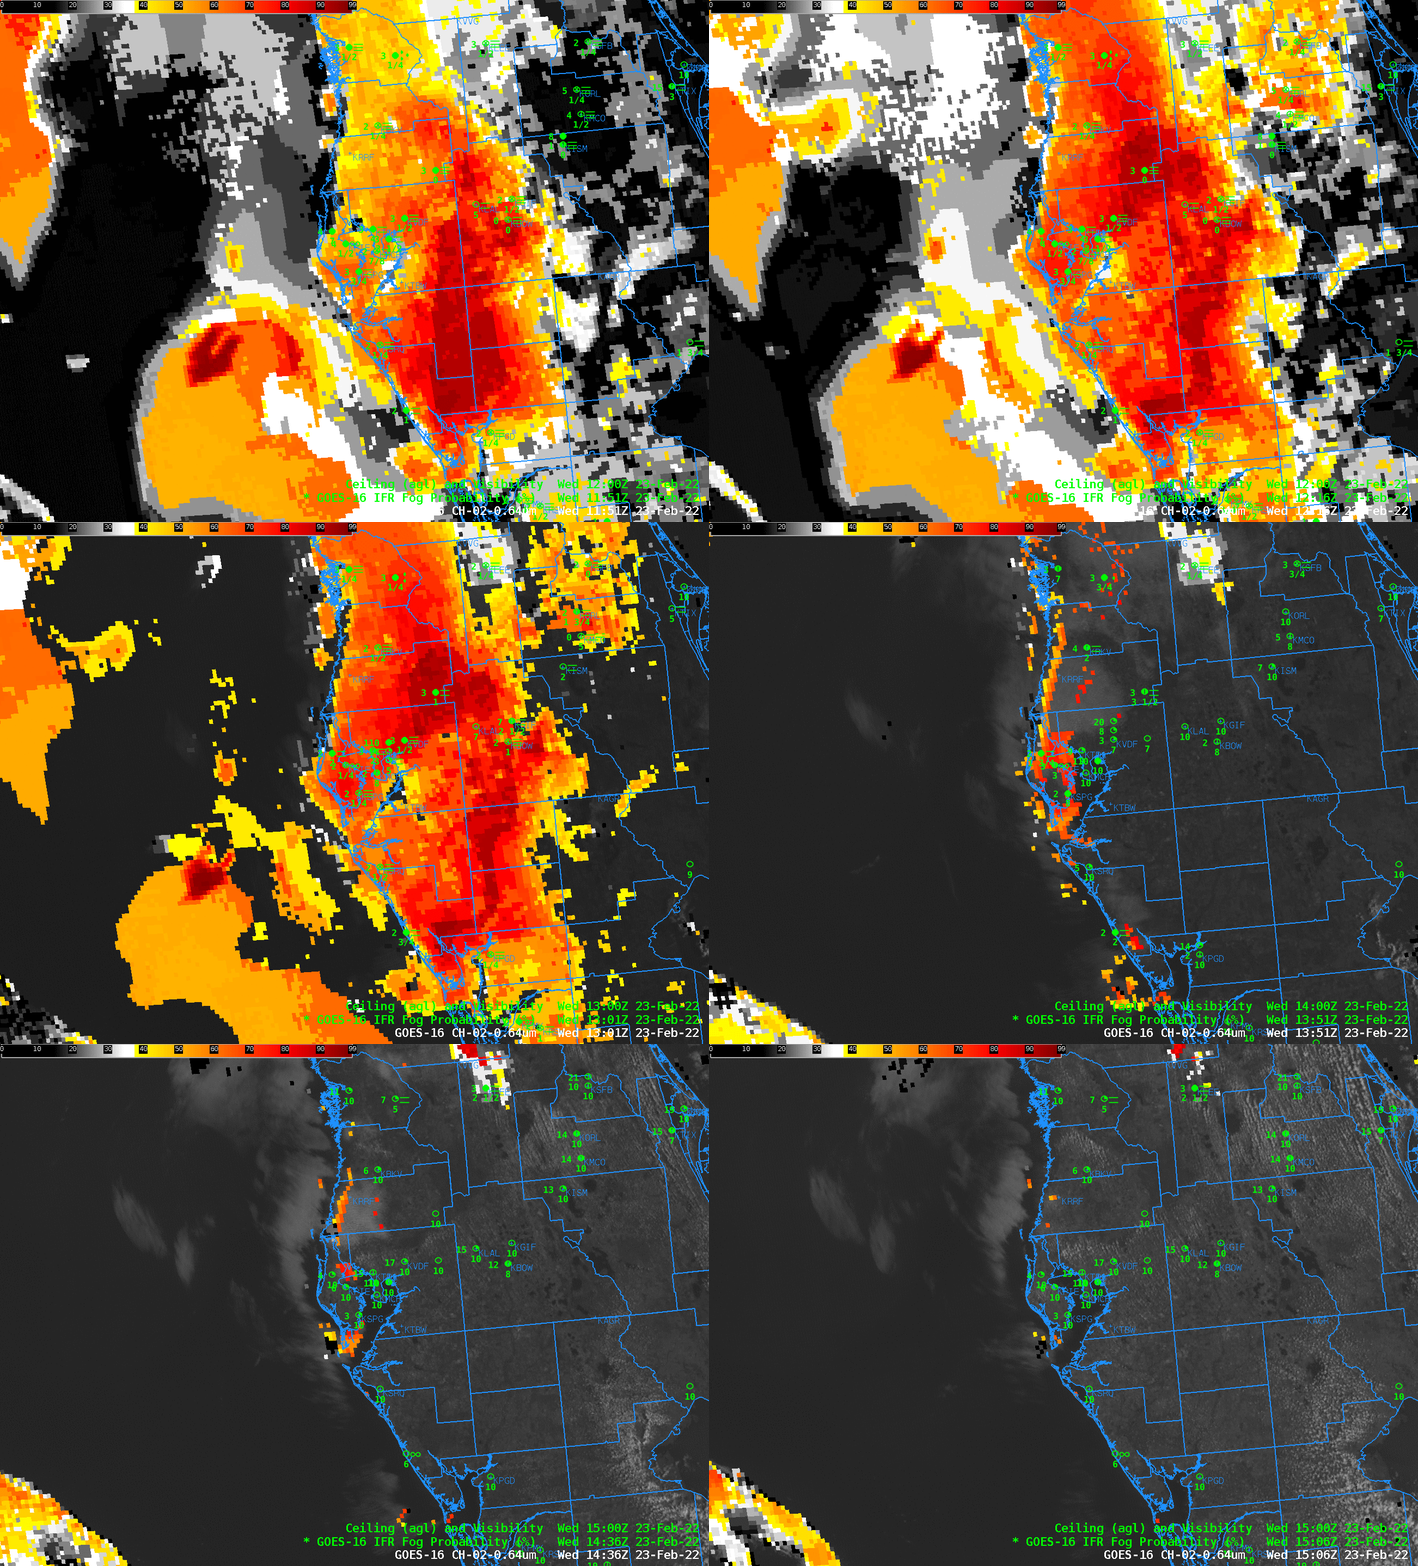
Fog around Tampa Bay

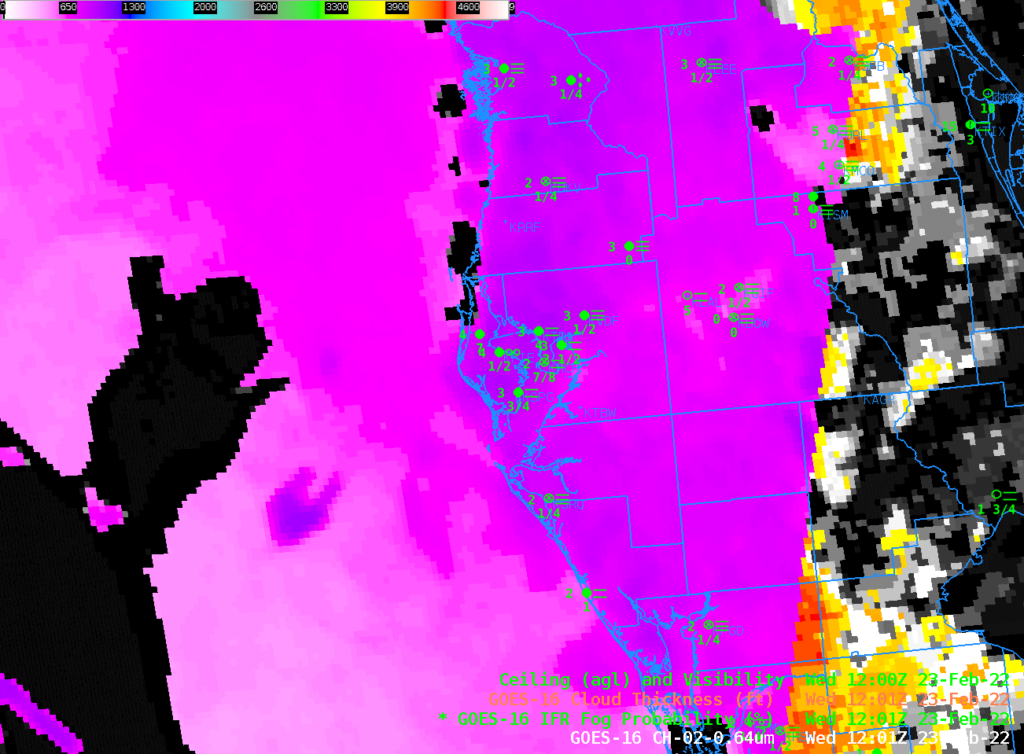
The animation below shows IFR Probability fields layered on top of visible imagery. Early morning fog that reduced visibilities and ceilings to sub-IFR conditions are indicated over much of the middle of the Florida peninsula. (Note that the IFR Probabilty color enhancement was altered so that it was transparent for values < 20%, allowing the visible imagery beneath to appear).

GOES-16 IFR Probability Fields and Visible Band 2 (0.64 µm) imagery, 1151 – 1506 UTC (Click to enlarge)

GOES-16 Cloud Thickness fields, below, depict a shallow fog: thickness values in general are under 1000 feet. This scatterplot relates the last pre-sunrise Cloud Thickness — in meters! — to burn-off time; a value of 1000 feet will burn off very quickly as observed above.

Cloud Thickness at 1201 UTC on 23 February 2022 (Click to enlarge)

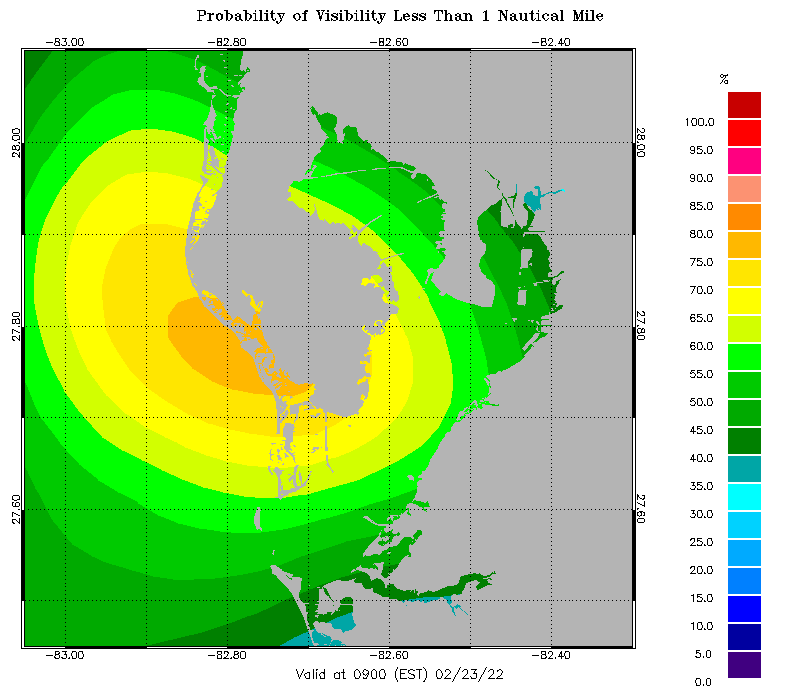
This website includes forecasts of visibility over Tampa Bay (and there are links to other coastal regions). The forecast below, for 1400 UTC 23 February / 0900 EST 23 February, has a maximum in predicted low visibility probability in about the right location. This forecast for the 24th suggests fog will be mostly offshore on the 25th.

Probability of low visibilities over/around Tampa Bay, valid 0900 EST on 24 February 2022 (Click to enlarge)

Fog over the southeast US

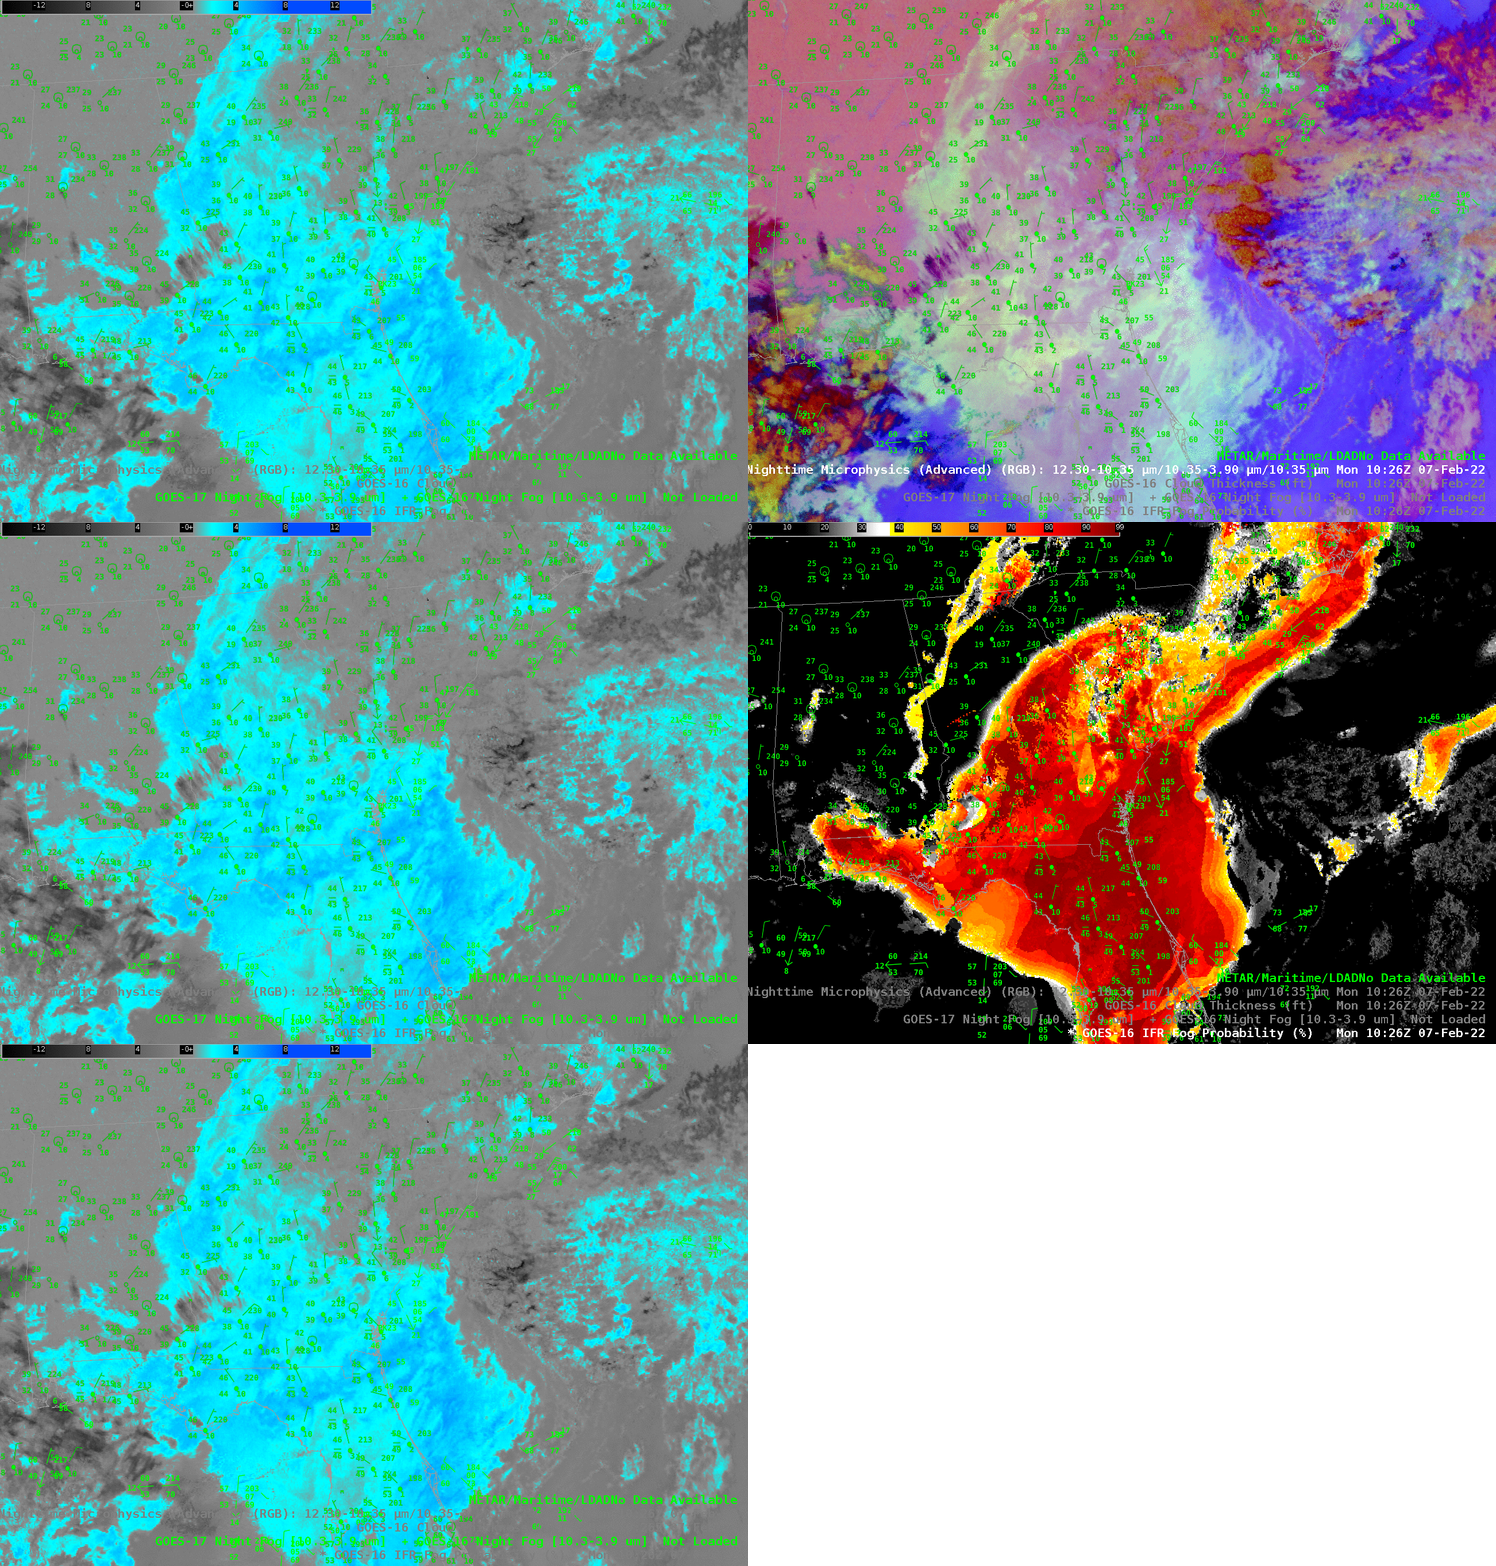
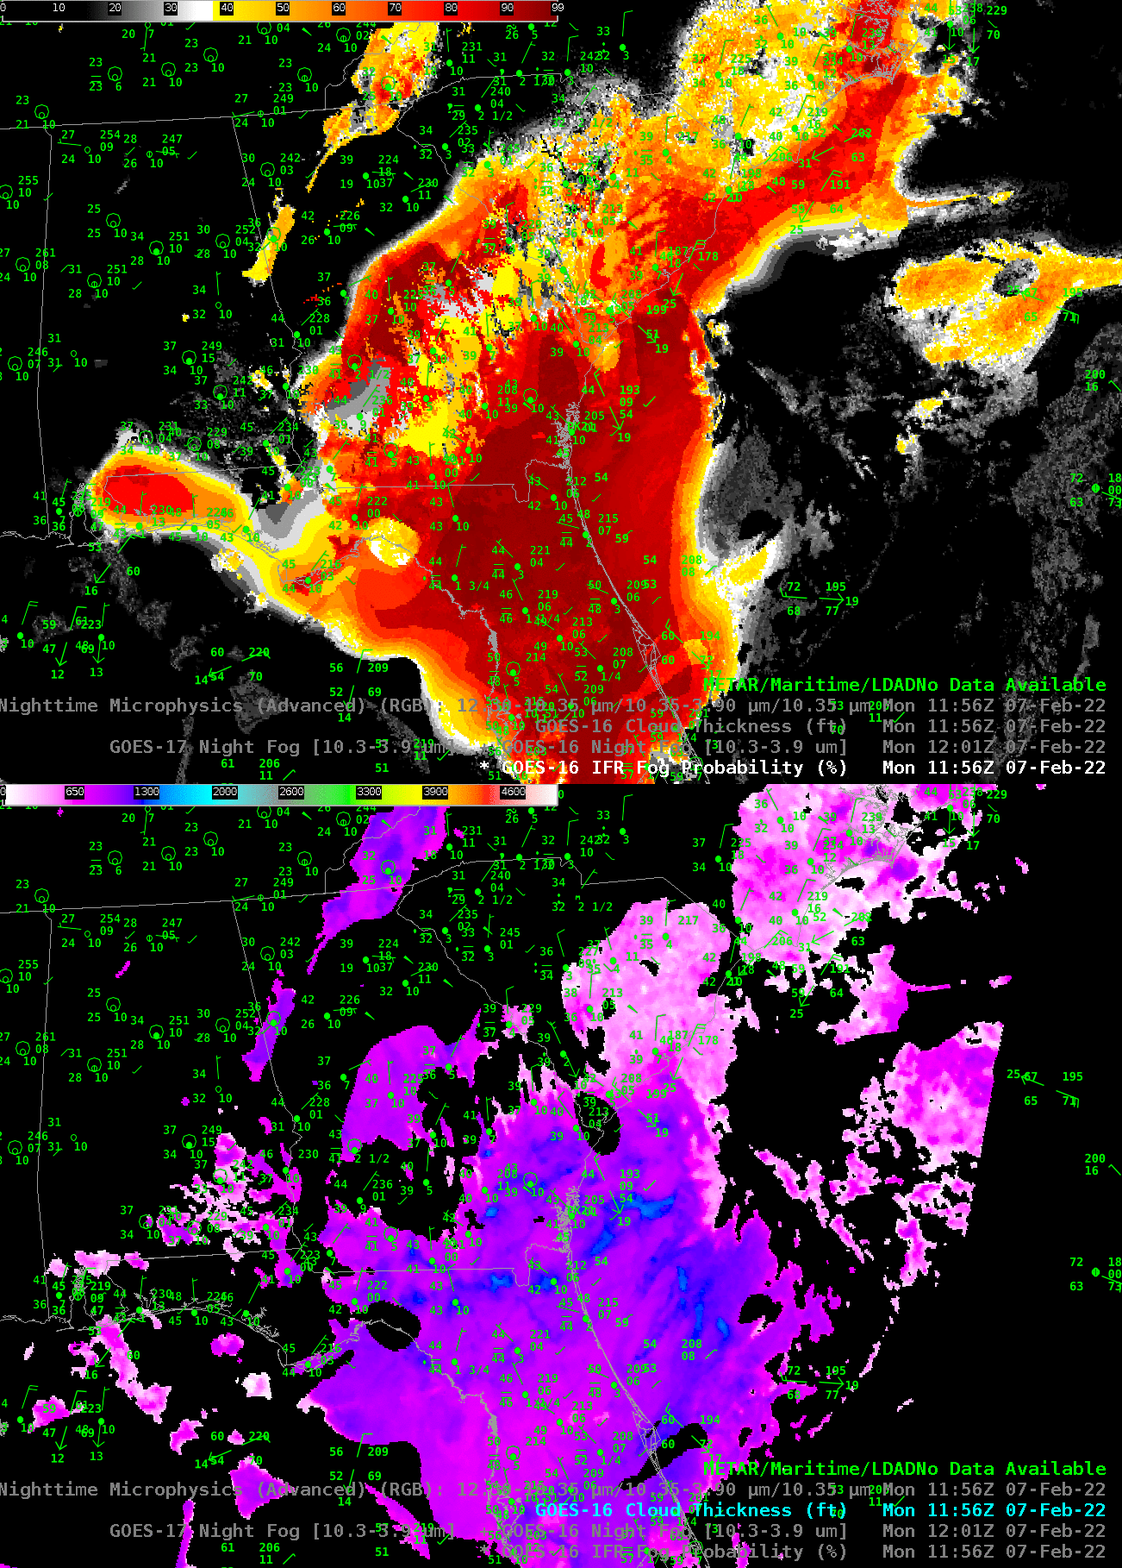
Low pressure just off the coast of South Carolina (0900 UTC map analysis) brought wide-spread fog and low ceilings to the southeastern United States on 7 February. The toggle below shows the Night Fog Brightness Temperature Difference (BTD, 10.3 µm – 3.9 µm) field that is often used to highlight regions where clouds made up of water droplets are widespread. The night time microphysics RGB includes as its green component the Night Fog BTD, and the correlation between the blue/cyan enhancement in the BTD and the cyan/yellowish color in the RGB is obvious. A challenge in using those two fields for low fog/stratus detection arises where multiple cloud layers might exist such that the BTD is not highlighting low cloud — because mid-level or high clouds block the satellite view of low clouds. This shortcoming is mitigated in IFR Probability fields by including information (from the Rapid Refresh model) on low-level saturation. Thus, IFR Probability fields suggest a greater likelihood for low clouds over coastal South Carolina (for example). If low-level saturation is *not* indicated in the model, IFR Probabilities will show minimal values, as over central Georgia (near Atlanta, especially), for example.

GOES-16 Night Fog Brightness Temperature Difference (10.3 µm – 3.9 µm), Night time microphysics RGB, and GOES-R IFR Probability, 1026 UTC on 7 February 2022 (Click to enlarge)

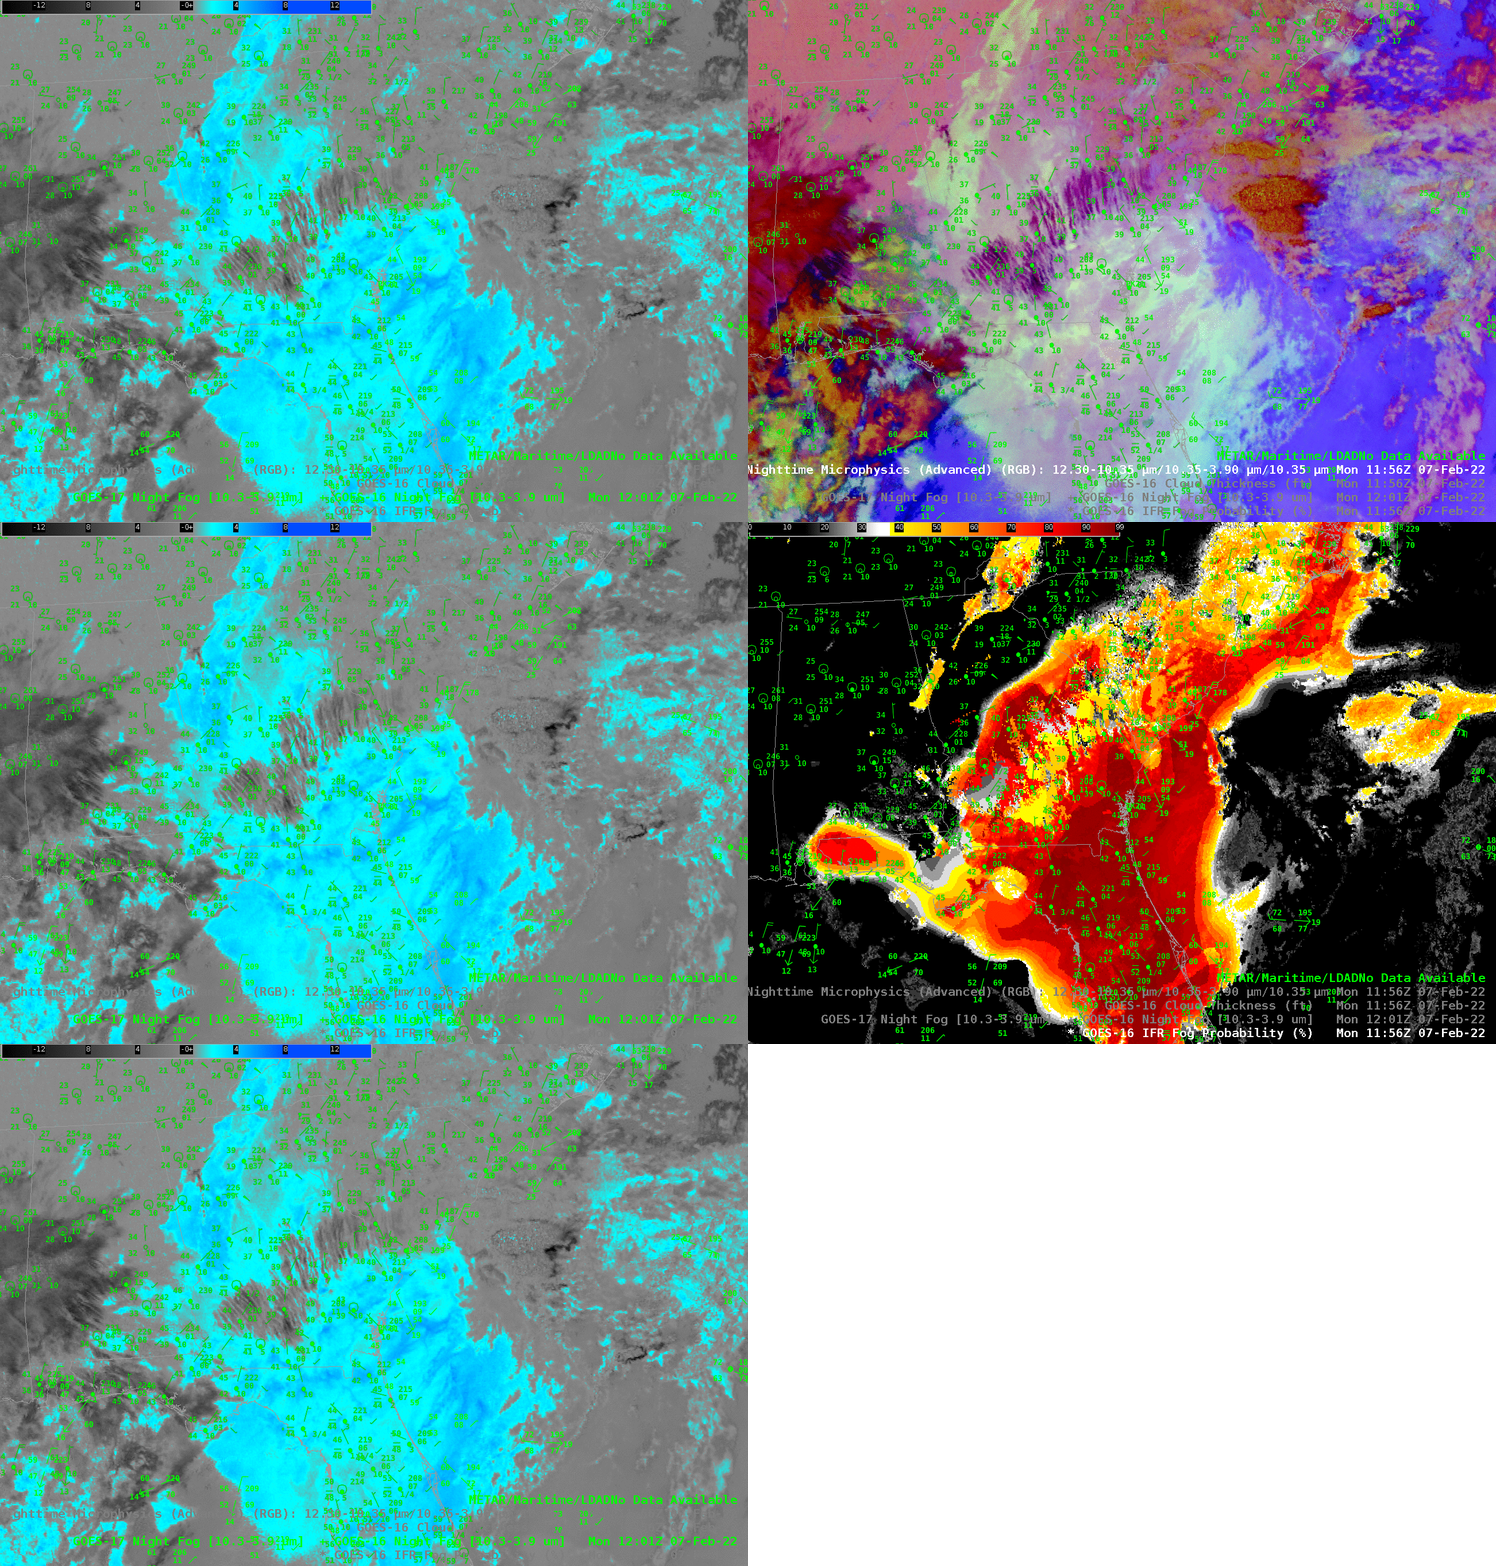
At 1156 UTC, a similar distribution to the three fields continues. Note how the presence of cirriform clouds over south-central Georgia affects the fields. The Night Fog BTD and Night Microphysics RGB both change radically, and IFR probabilities reduce — in part because the algorithm is less confident that low clouds exist. The small IFR Probabilities continue around Atlanta’s airline hub, important information from an aviation standpoint!

GOES-16 Night Fog Brightness Temperature Difference (10.3 µm – 3.9 µm), Night time microphysics RGB, and GOES-R IFR Probability, 1156 UTC on 7 February 2022 (Click to enlarge)

The toggle below compares IFR Probability with GOES-R Cloud Thickness. This is close to the time around sunrise/sunset when GOES-R Cloud Thickness are not computed because of quickly changing reflected solar shortwave infrared (3.9 µm) radiation; indeed, the cutoff can be viewed in the SSW-NNE terminator line over the Atlantic at the eastern edge of this image. If the low clouds on this day were strictly radiation (a dubious claim in the presence of rain!), then this scatterplot could be used to help decide when conditions might clear.

GOES-R IFR Probability and GOES-R Cloud Thickness fields, 1156 UTC on 7 February 2022 (Click to enlarge)

IFR Probability for situational awareness over the Pacific Northwest

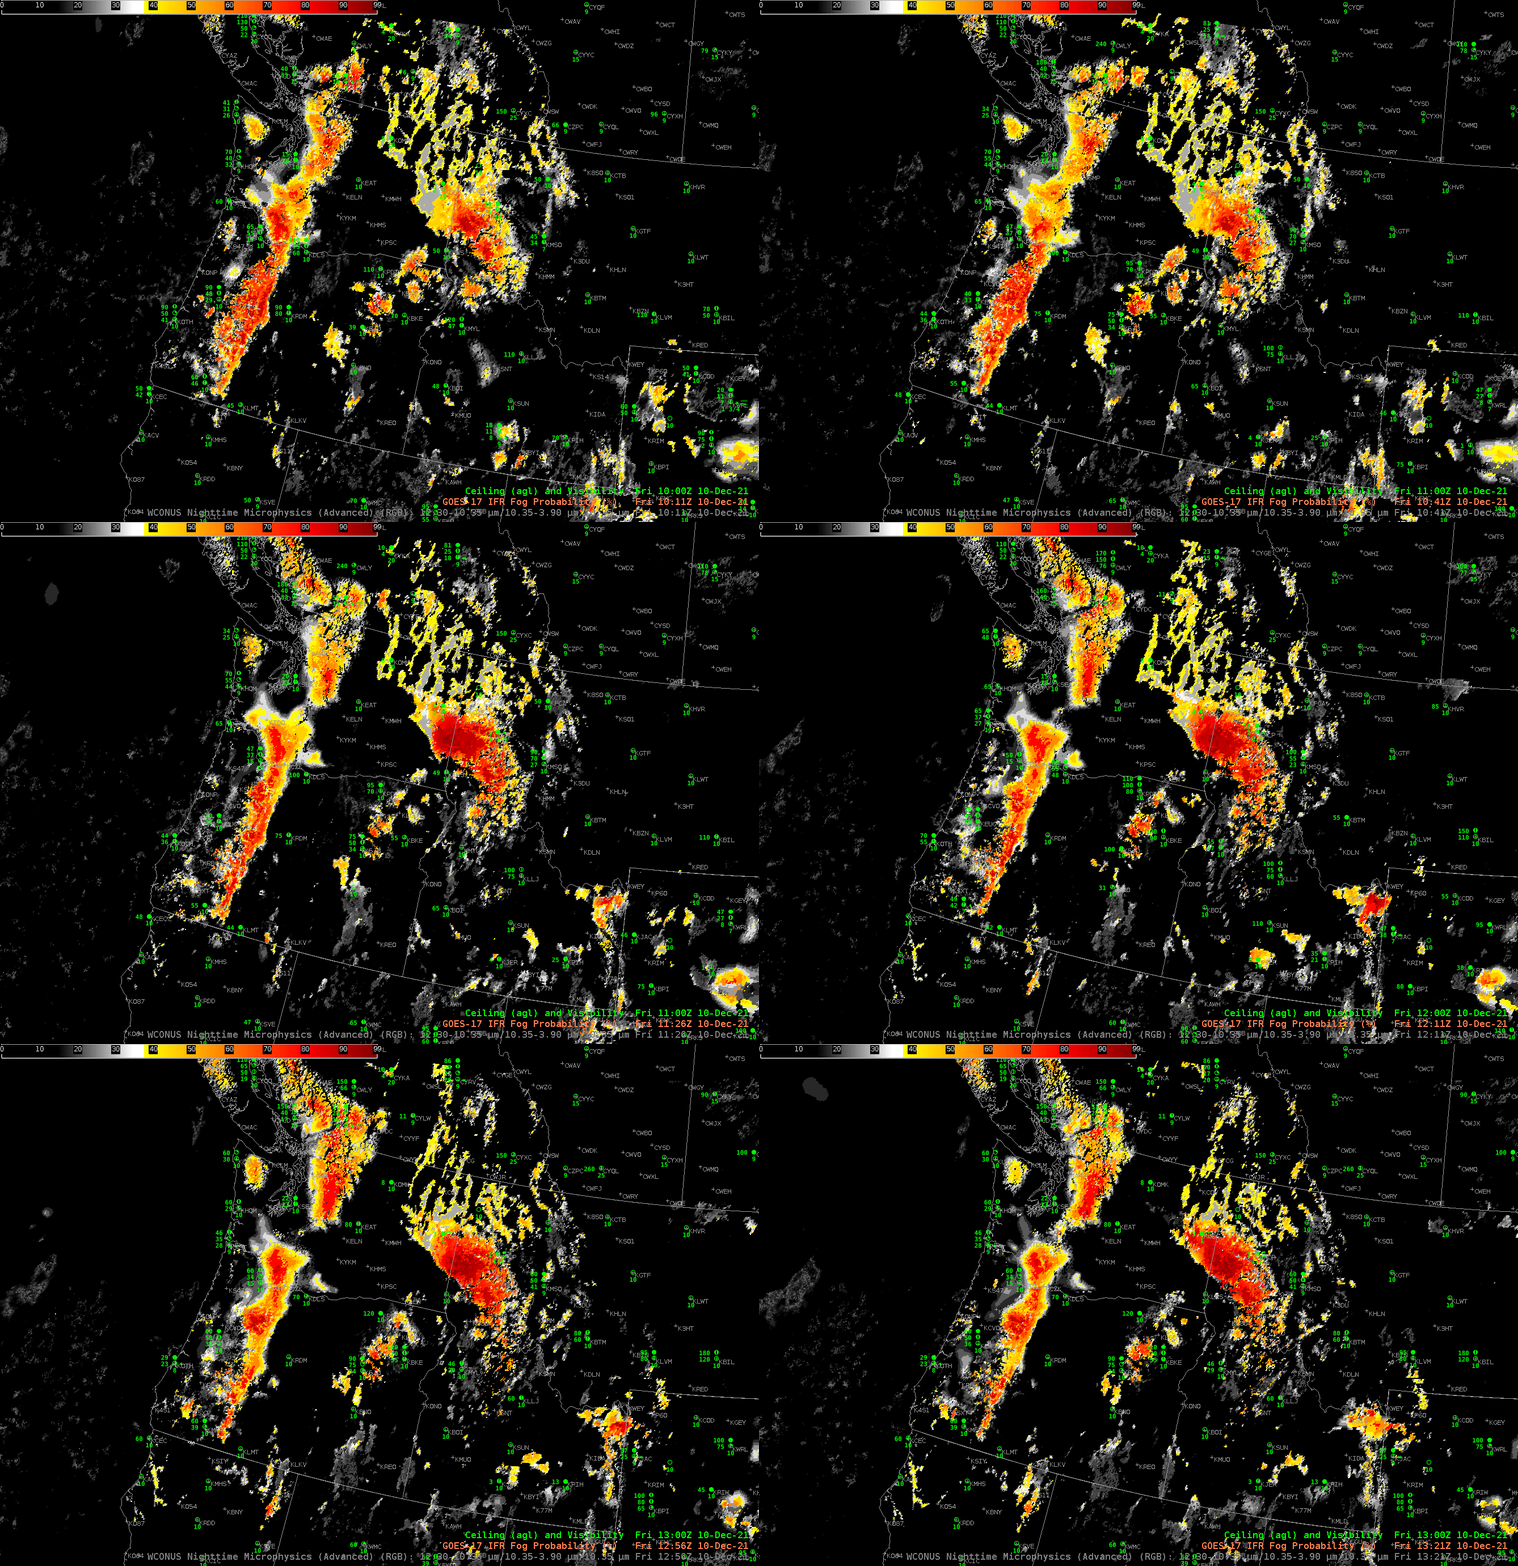
GOES-17 IFR Probability fields, 1011-1321 UTC on 10 December 2021; Surface observations of ceilings (above ground level) and visibility are also included (Click to enlarge)

The animation above shows GOES-17 IFR Probabilities over the Pacific Northwest. This is a good situational awareness tool for fog/low stratus because it highlights regions where IFR conditions are most likely. That is, it is a quantitative product. The product also has knowledge of terrain height; if low clouds exist in regions where terrain might be rising into the clouds (for example to the northeast of Seattle WA, and to the east of Portland OR, and in Olympic National Park), IFR probabilities are heightened (pun not really intended).

The Nighttime microphysics RGB, shown below, can also be used for qualitative situational awareness. In this case, the region of low clouds over western Washington, around Spokane (where observations show IFR conditions) and to the north, is highlighted as expected (the yellow color that is structured so that individual valleys are obvious). IFR Probabilities north of Spokane are not large, however, suggesting that model simulations there (from the Rapid Refresh model) do not show low-level saturation. (Observations at KOMK — Omak Washington — show near-IFR conditions). Another strength of IFR Probability is that it supplements satellite data where the satellite cannot view low clouds. High clouds to the east of Seattle and Portland are obscuring the view of low clouds in that region where IFR Probabilities are large and where ceilings and visibilities are likely reduced.

GOES-17 Nighttime Microphysics RGB (PACUS sector), 1011 – 1321 UTC on 10 December 2021 (Click to enlarge)

IFR Probability now archived in NOAA CLASS

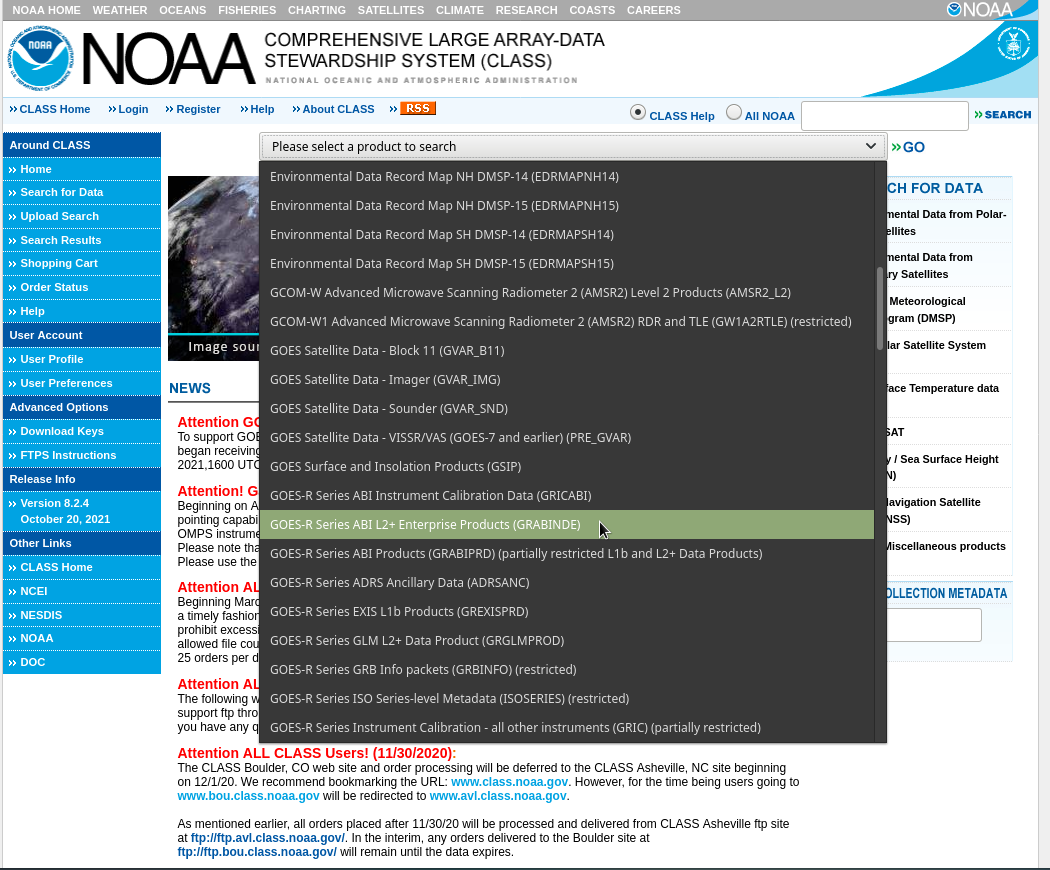
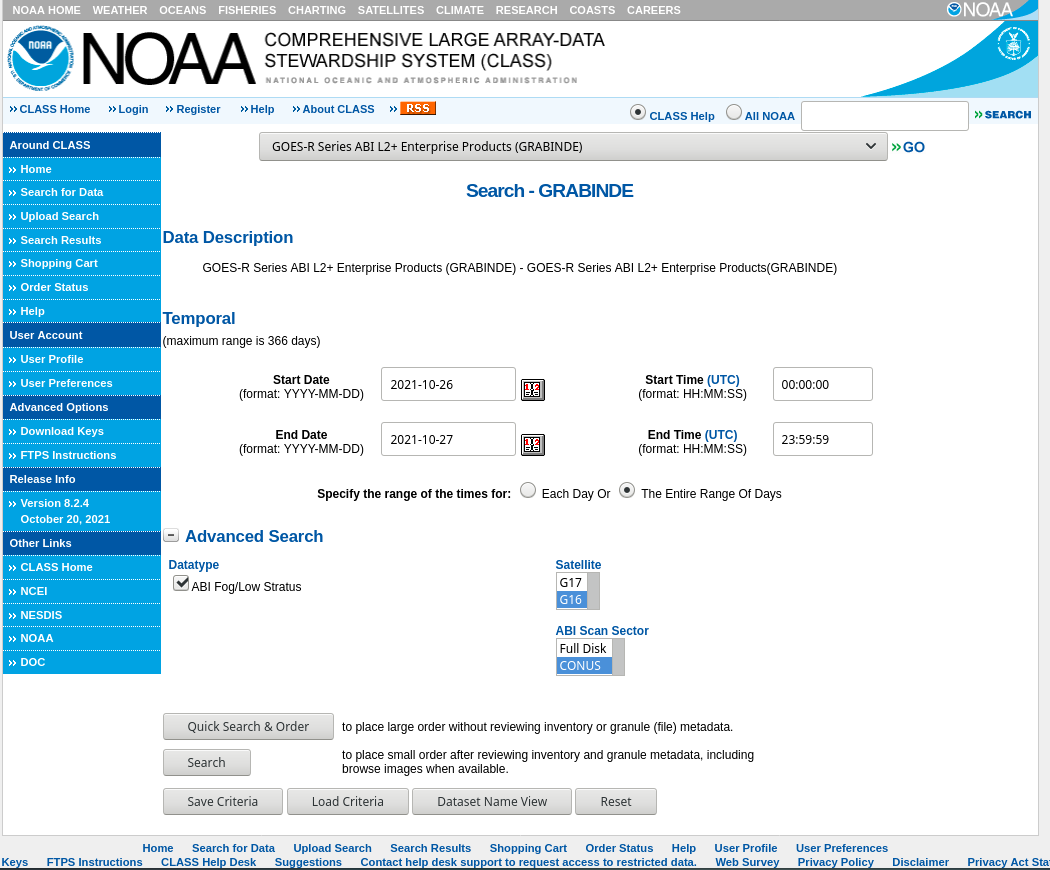
Starting 21 October 2021, GOES-R IFR Probability fields are archived (for both GOES-16 and GOES-17, Full Disk and CONUS/PACUS domains) at NOAA CLASS. These fields are available under the drop-down menu: Choose ‘GOES-R Series L2+ Enterprise Products (GRABINDE)’, as shown below.

Product Search drop-down menu from the landing page of NOAA CLASS

Clicking on ‘>>Go‘ after selecting the product takes a user to the page below, from which page ABI Fog/Low Stratus products can be obtained.

Product Selection page at NOAA CLASS for GOES-17/GOES-16 Fog/Low Stratus products (including Cloud Thickness and IFR Probability fields)

The files retrieved from CLASS will be netCDF files with a filename structure such as this:

ABI-L2-GFLSC-M6_v3r0_g16_s202110220811172_e202110220813545_c202110220814421.nc

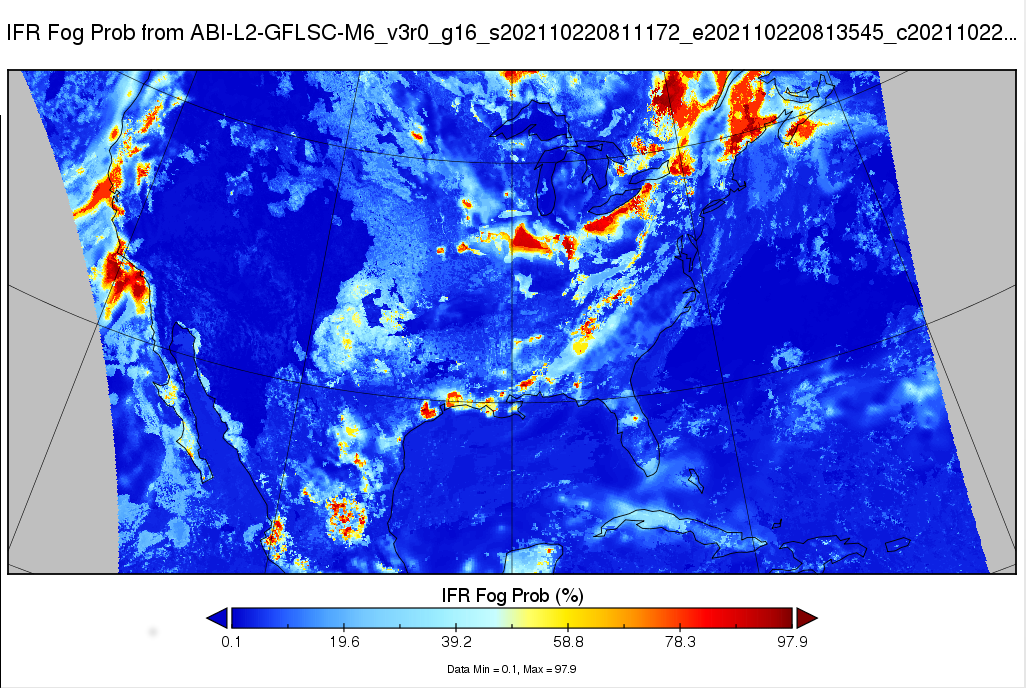
The file name above is for GOES-16 data from 0811 UTC on 22 October 2021. Such data can be displayed in (for example) Panoply, as shown below. Additionally, one could configure an AWIPS session to accept the fields.

IFR Probability fields, 0811 UTC on 22 October 2021 (GOES-16 CONUS) (Click to enlarge)

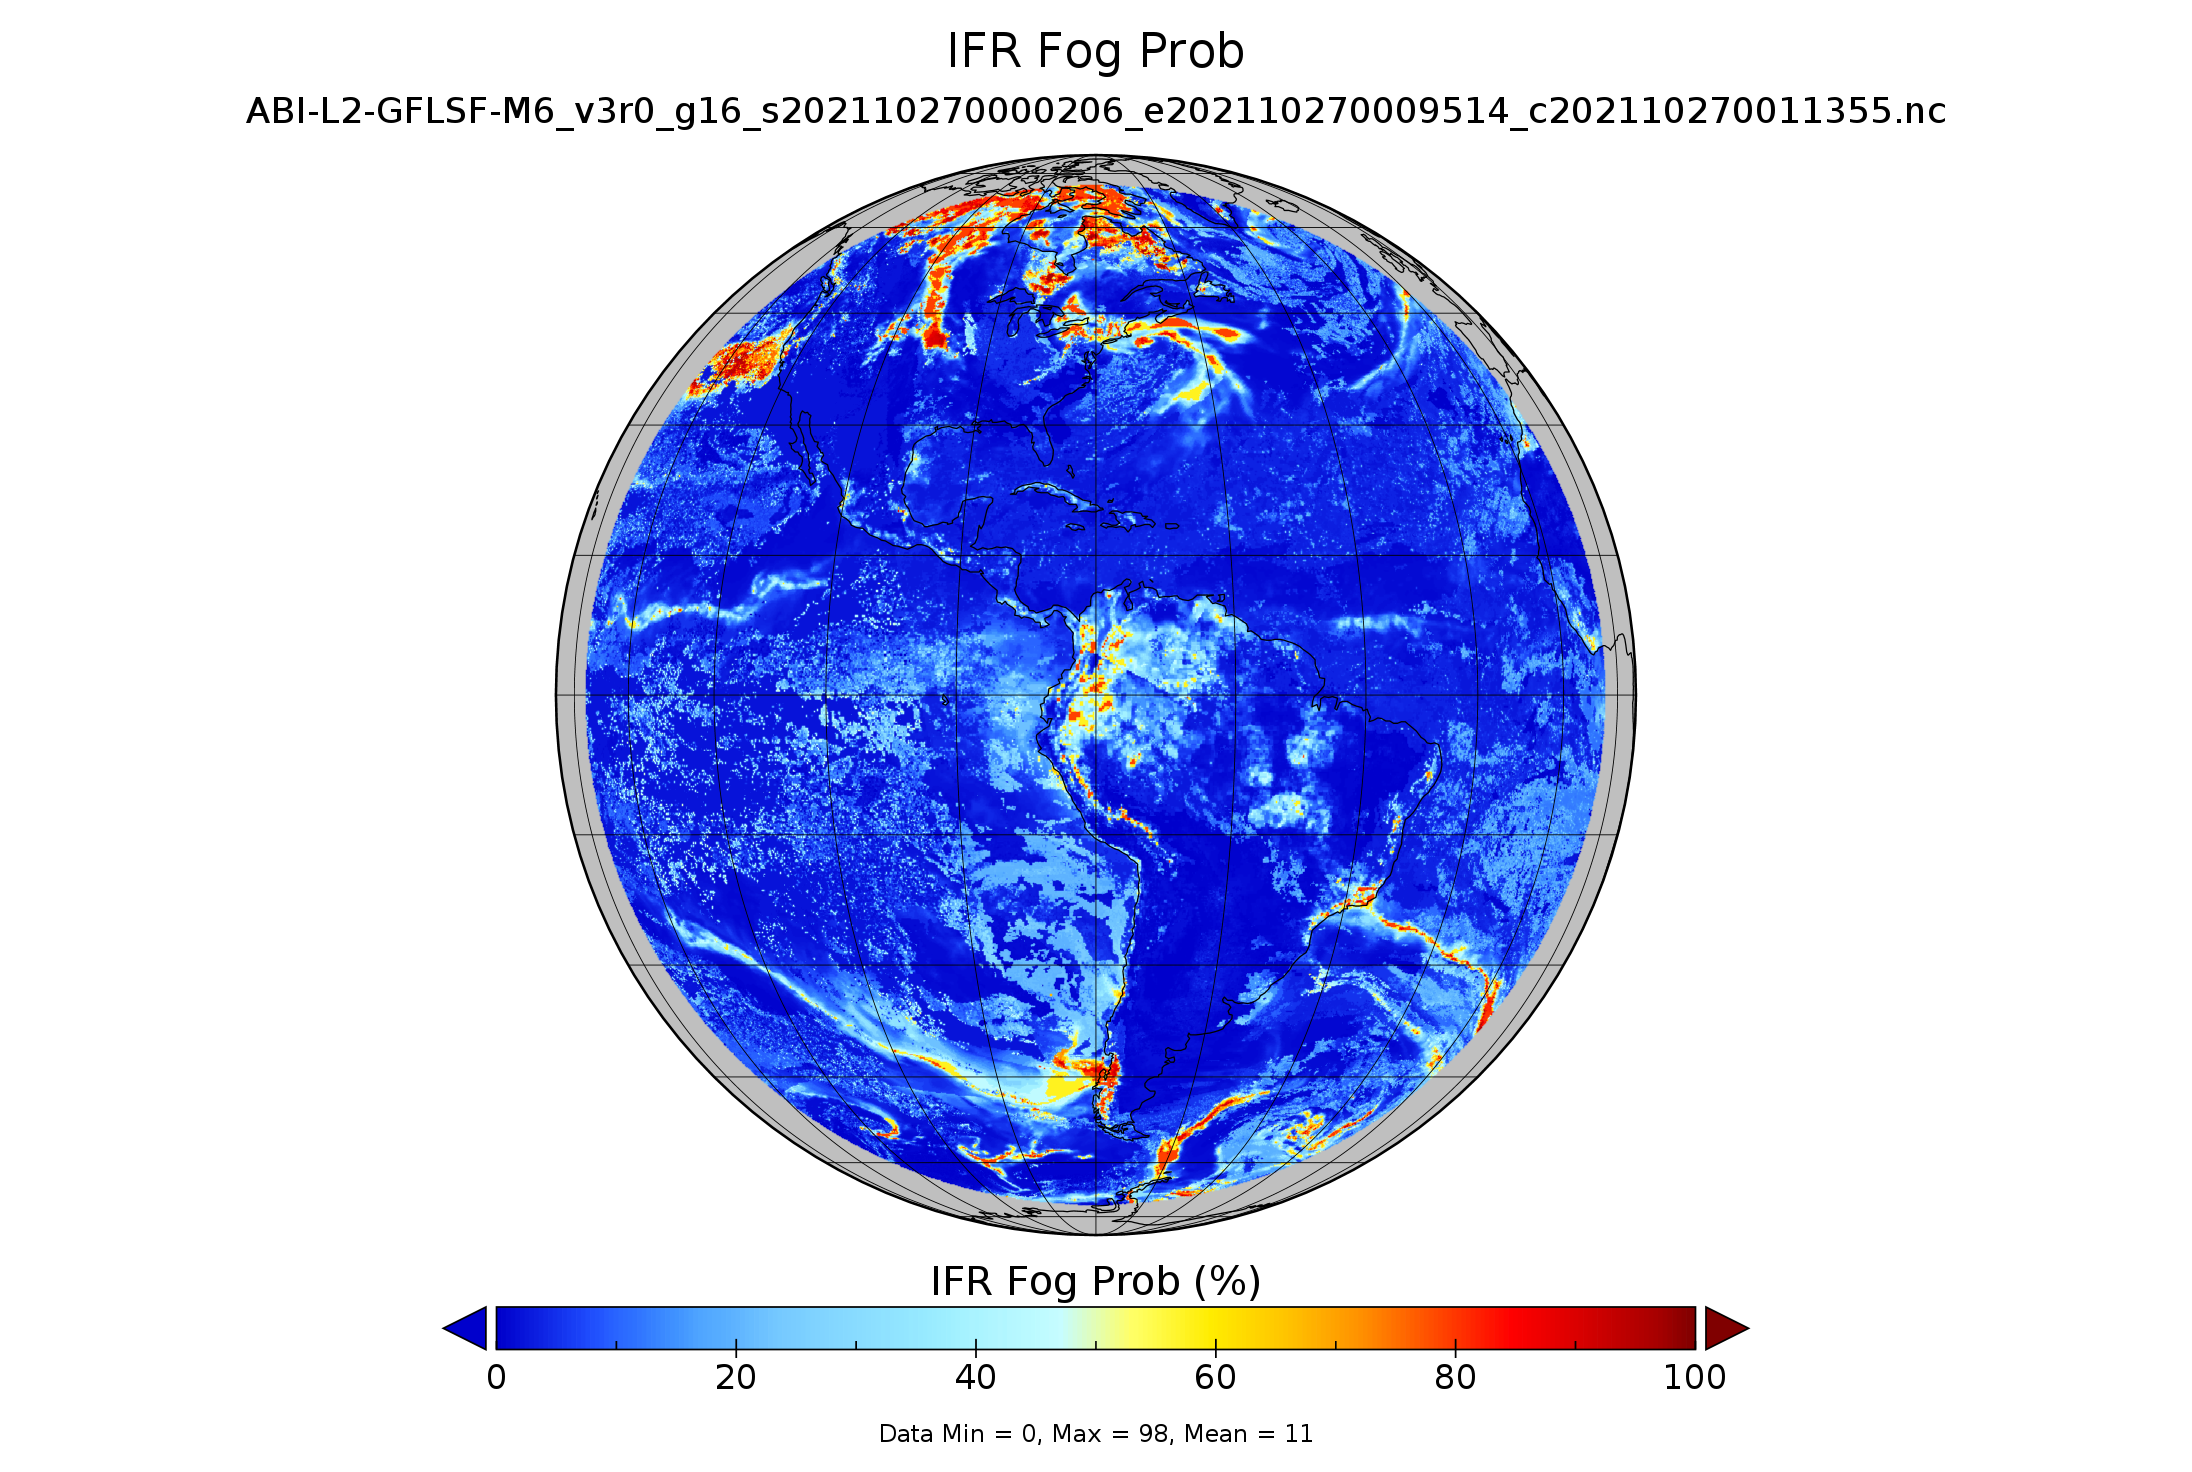
The netCDF files include many different 2-dimensional fields: IFR Probability, MVFR Probability, Low IFR Probability, Cloud Thickness, Maximum Relative Humidity between the surface and 500 feet AGL, Maximum Relative Humidity between the surface and 3000 feet AGL, Band 7 (3.9) Emissivitiy, and many more. A Full Disk image below (courtesy Tim Schmit, NOAA STAR), shows IFR Probability values on 27 October 2021 at 0000 UTC.

Global distribution of GOES-16 IFR Probability, 0000 UTC on 27 October 2021 (Click to enlarge)

Alaskan IFR Probability with GOES-17

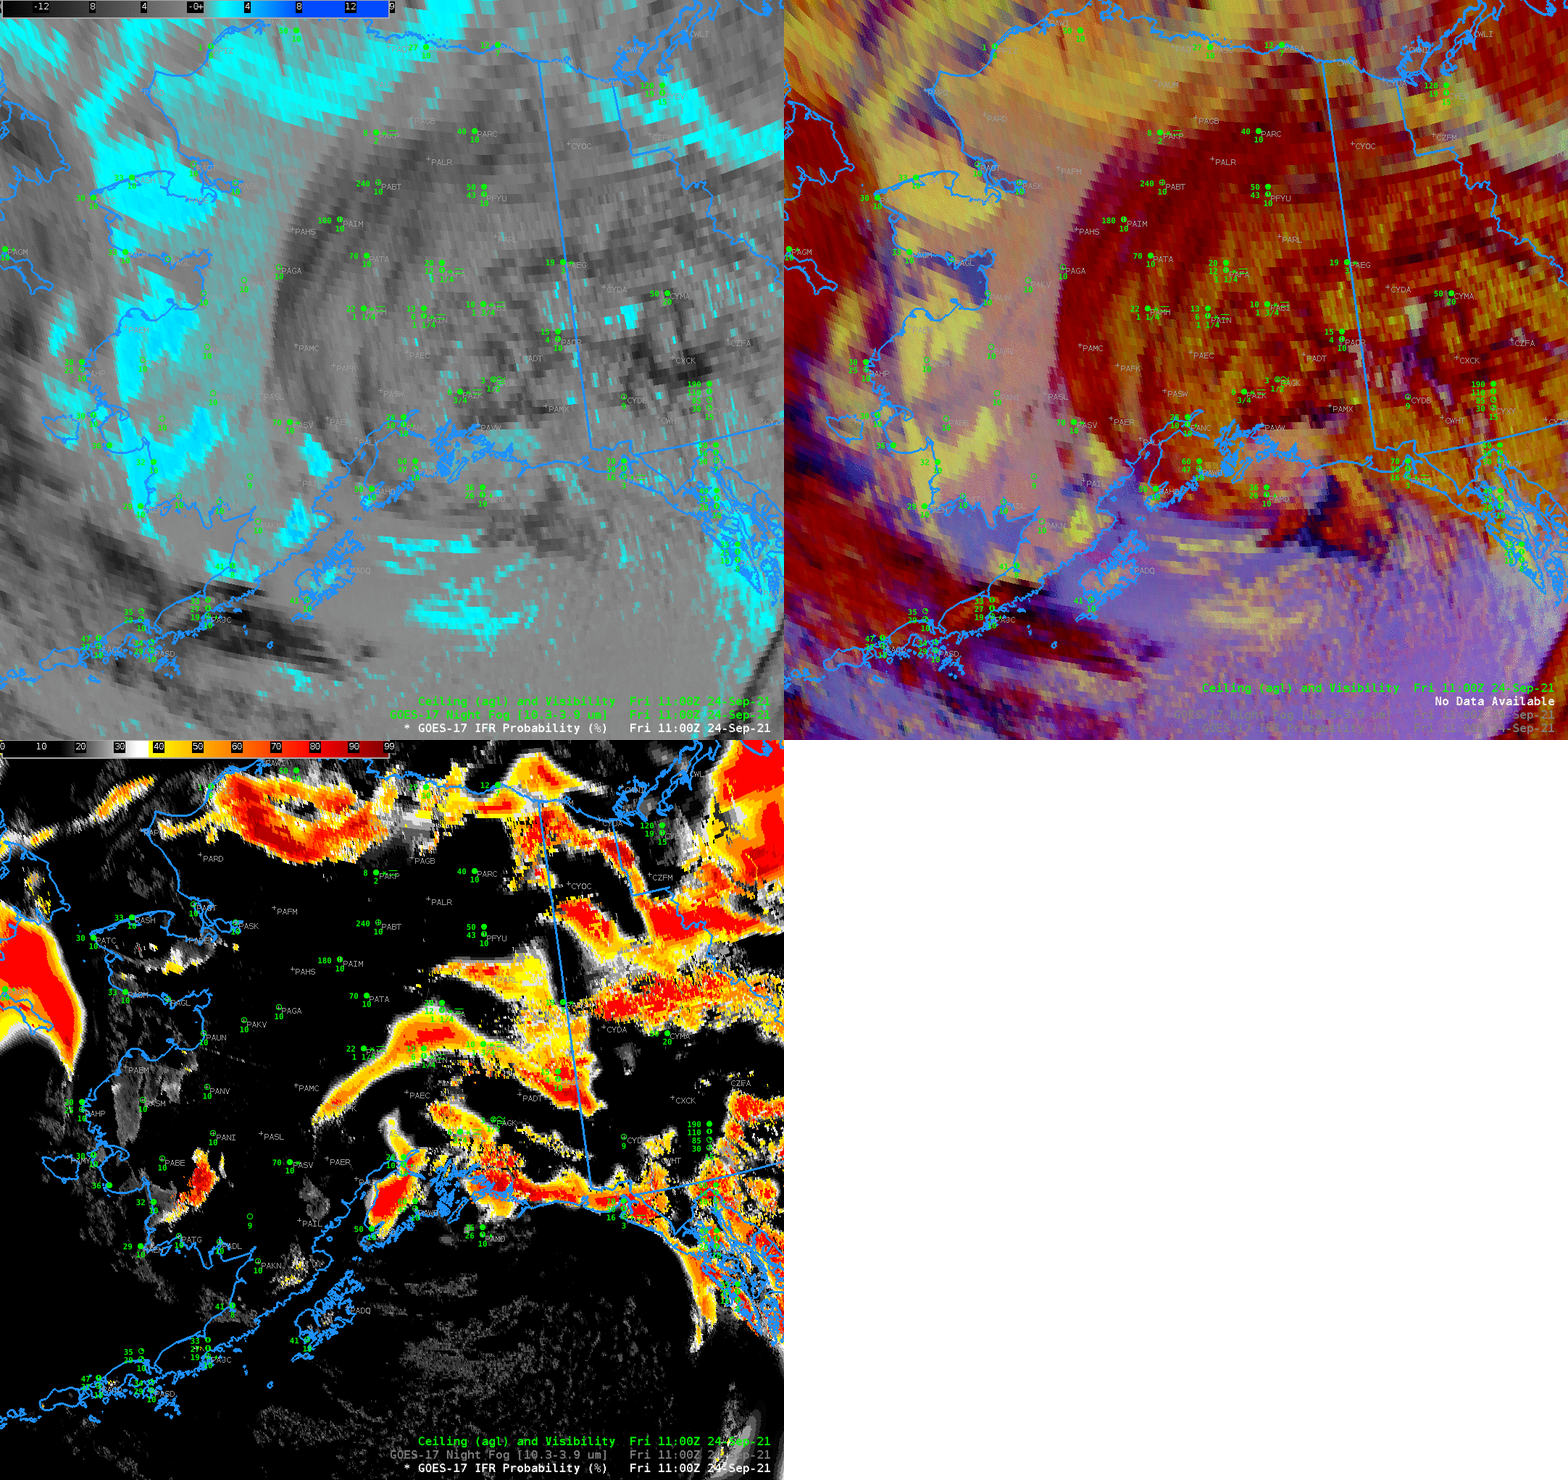
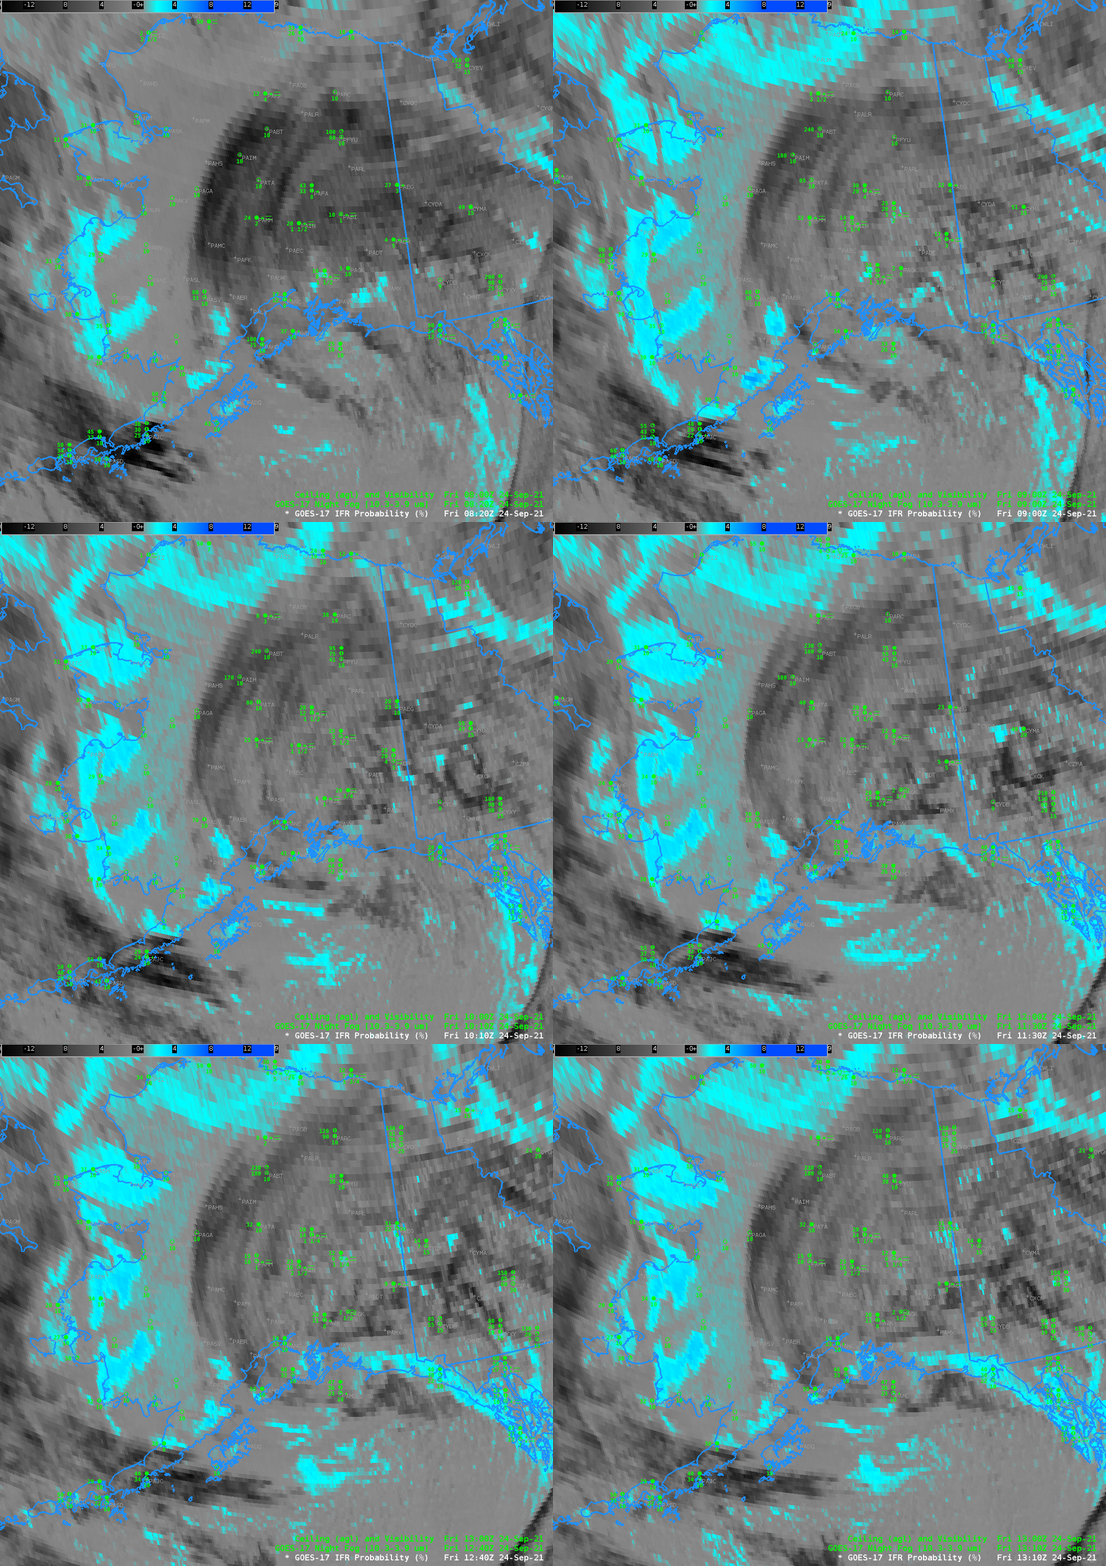
GOES-17 Night Time Brightness Temperature (10.3 µm – 3.9 µm), Night TIme Microphysics RGB and GOES-17 IFR Probability, 1100 UTC on 24 September 2021 (Click to enlarge)

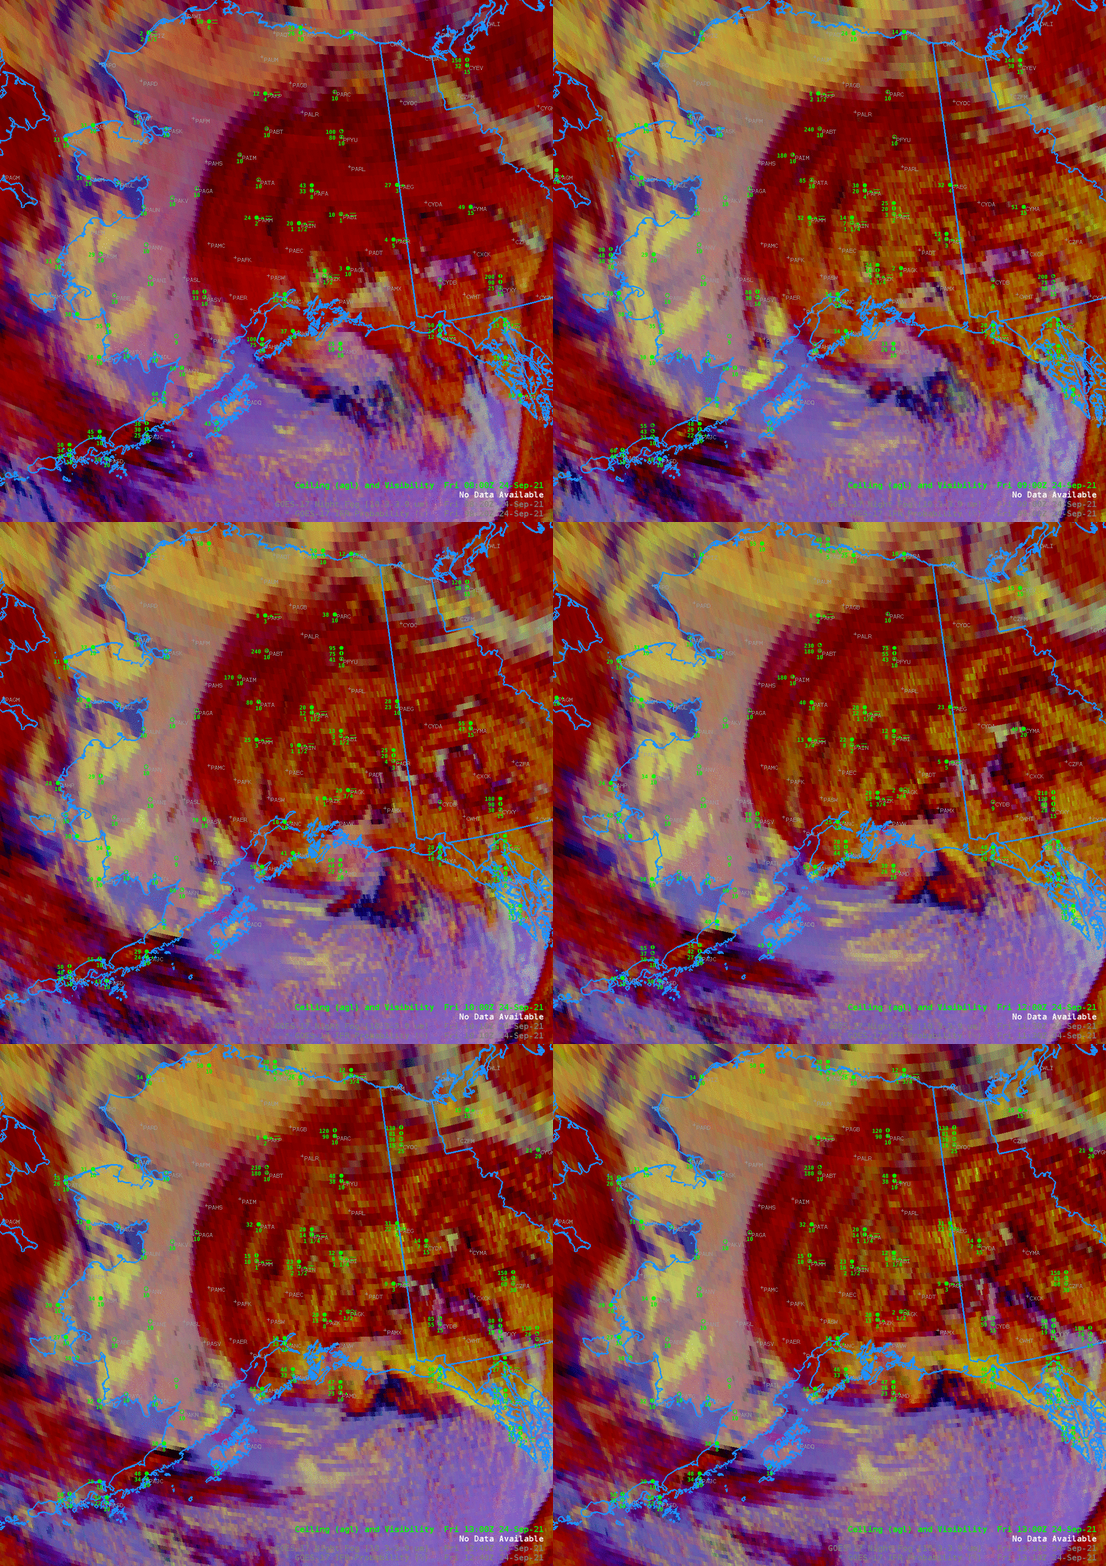
The animation above steps through the Night Fog brightness temperature difference (10.3 µm – 3.9 µm), the Nighttime Microphysics RGB (which RGB has as its green component the Night Fog brightness temperature difference) and the GOES-17 IFR Probability fields at 1100 UTC on 24 September 2021. (Note that the Night Fog Brightness Temperature difference and Night Microphysics RGB are at reduced resolution)

A low pressure system is moving onshore through southeastern Alaska. The animation includes two regions that demonstrate particular strengths of the IFR Probability field: over inland and coastal southeastern Alaska, east of Anchorage and west of Yakutat, where low clouds are diagnosed under the multiple cloud layers; over western Alaska where low clouds are diagnosed by the brightness temperature difference field — and color-enhanced as cyan/blue — but where fog observations are not occurring. Over western Alaska, model data allows the IFR Probability to screen out the region of elevated stratus.

Animations of the brightness temperature difference field, the night time microphysics RGB and the IFR Probability are shown below.

GOES-17 Night Time Brightness Temperature (10.3 µm – 3.9 µm), 0820-1310 UTC on 24 September 2021 (Click to enlarge)
GOES-17 Night Microphysics RGB, 0820-1310 UTC on 24 September 2021 (Click to enlarge)
GOES-17 IFR Probability Fields, 0820-1310 UTC on 24 September 2021 (Click to enlarge)

On this day, GOES_17 IFR Probability fields were better able to highlight regions of low ceilings and visibilities over Alaska by combining the strength of satellite detection of clouds and the ability of Rapid Refresh model simulations to predict where low-level saturation is most likely. Note that in the animation of the IFR Probability fields there are slight changes on the hour that are related to incorporation of new model output into the computation of the fields.

GOES-17 IFR Probability fields are slated to be operational as of 13 October 2021.

Fog and Smoke over North Dakota

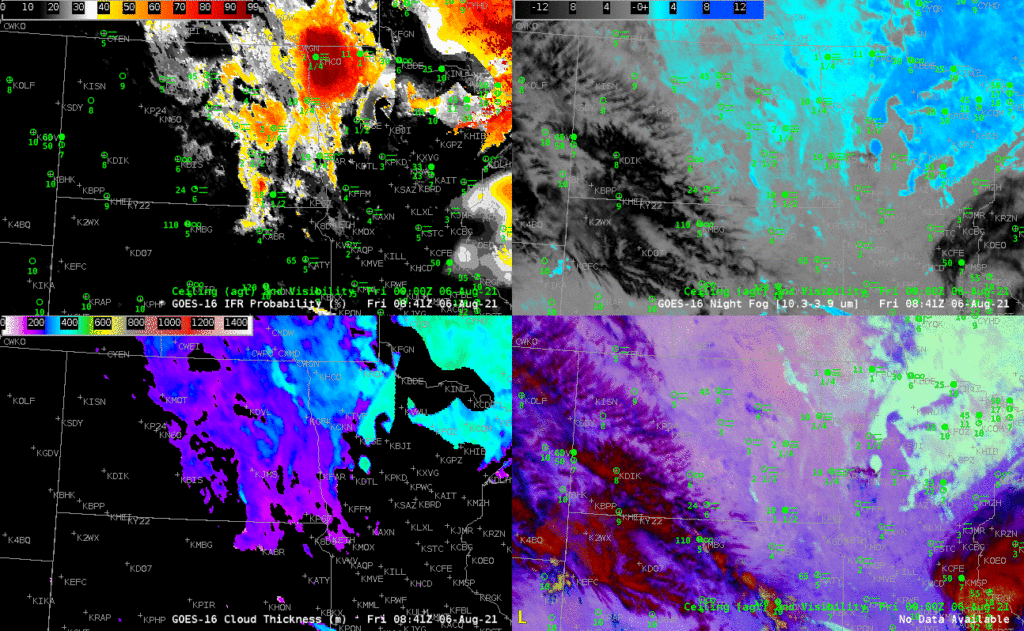
GOES-16 IFR Probability (upper left), GOES-16 ‘Night Fog’ Brightness Temperature Difference (10.3 µm – 3.9 µm, upper right), GOES-16 Nighttime microphysics RGB (lower right), GOES-16 Cloud Thickness (lower left), including surface observations of ceilings and visibility. Click to show animation from 0841 to 1246 UTC on 6 August 2021

Examine the four-panel animation above. Fog with IFR conditions developed over night over North Dakota. IFR Probability fields, upper left in the four-panel, do a credible job of outlining where the restrictions to visibility are (including the low ceilings). Indeed, a strong signal develops in the IFR Probability field before one develops in the Night Fog brightness temperature difference. In addition, there is a strong signal in the brightness temperature difference field (10.3 µm – 3.9 µm) and also in the night time microphysics RGB over northern Minnesota, but observations suggest that the stratiform clouds highlighted there by those two products are not hugging the ground, that is, they are elevated stratus vs. fog. Also note how the signal diminishes as the sun rises, as expected. The bottom left panel shows GOES-R Cloud Thickness, and it suggests that the fog over North Dakota is fairly thin. Rapid burnoff-should occur.

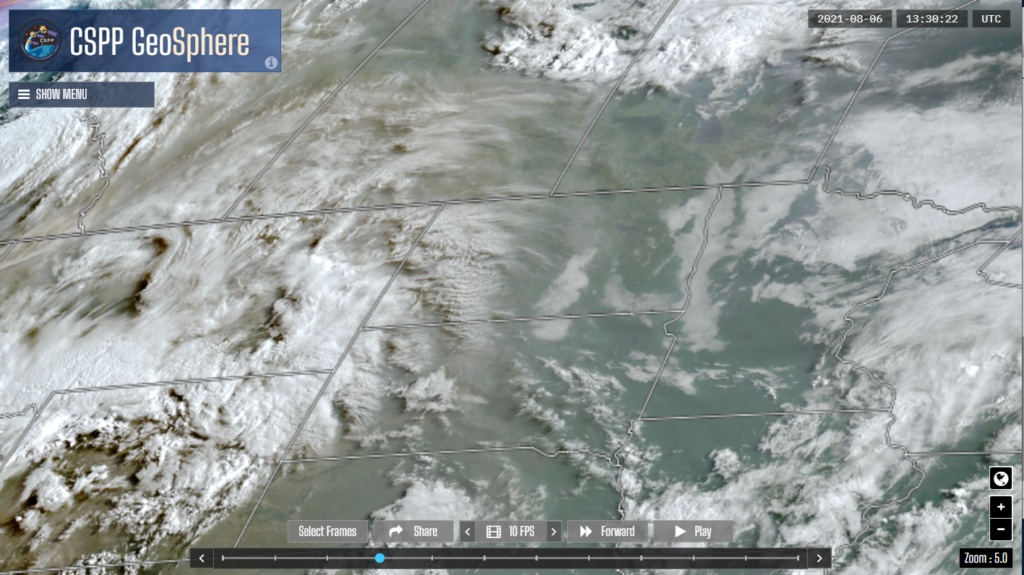
Some of the stations in the Dakotas are reporting visibility restrictions due to smoke. IFR Probability fields do not provide information for that kind of IFR conditions: Smoke detection with infrared imagery is very challenging, and the Rapid Refresh model being used (to identify regions of fog by assessing low-level saturation) does not predict smoke. The image below, taken from the CSPP Geosphere site (link), shows the widespread smoke, and also the patches of stratus and mid-level clouds as depicted in the scene above.

CSPP Geosphere True Color imagery, 1330 UTC on 6 August 2021 (Click to enlarge)

Morning fog over western North Carolina

GOES-16 IFR Probabilities (and surface observations of ceilings and visibilities), upper left ; GOES-16 Cloud Thickness, upper right ; GOES-16 ‘Night Fog’ Brightness Temperature Difference (10.3 µm – 3.9 µm), lower left; GOES-16 Nighttime Microphysics RGB, lower right. All from 0701 – 1301 UTC on 15 July 2021 (Click to enlarge)

The animation above shows various methods typically used to detect fog/low stratus in the early morning. Night Fog Brightness Temperature differences, bottom left, and Night Time microphysics, bottom right, are both satellite-only detection systems; a shortcoming might be that satellite data is challenged in detecting cloud bases — satellites view the cloud top. Additionally, the signal is lost as the sun rises. IFR Probability (upper right) includes information (from the Rapid Refresh model) on low-level saturation, so perhaps that field better defines the scattered pockets of fog apparent on this morning. However, the Rapid Refresh model resolution is 13-km, and a valley fog might not be well-resolved in the model.

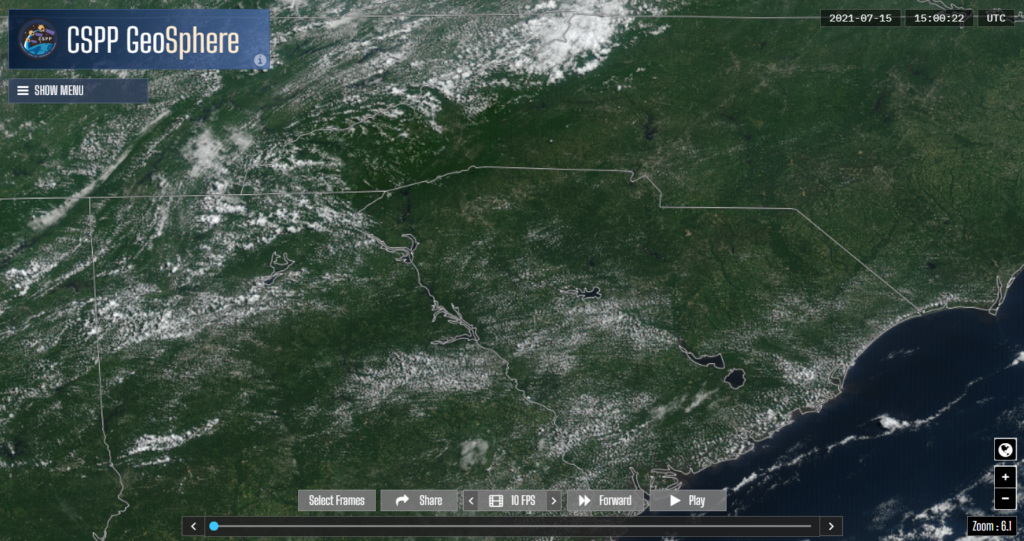
The Cloud Thickness information suggests that any clouds are thin, and that morning burn-off will be speedy. That is indeed what happened, as shown by the 1500 UTC image below (taken from the CSPP Geosphere site). Recall that the Cloud Thickness product is not produced in the times that surround sunrise (or sunset).

CSPP Geosphere True Color image, 1500 UTC 15 July 2021 (Click to enlarge)

Fog over southeast New England

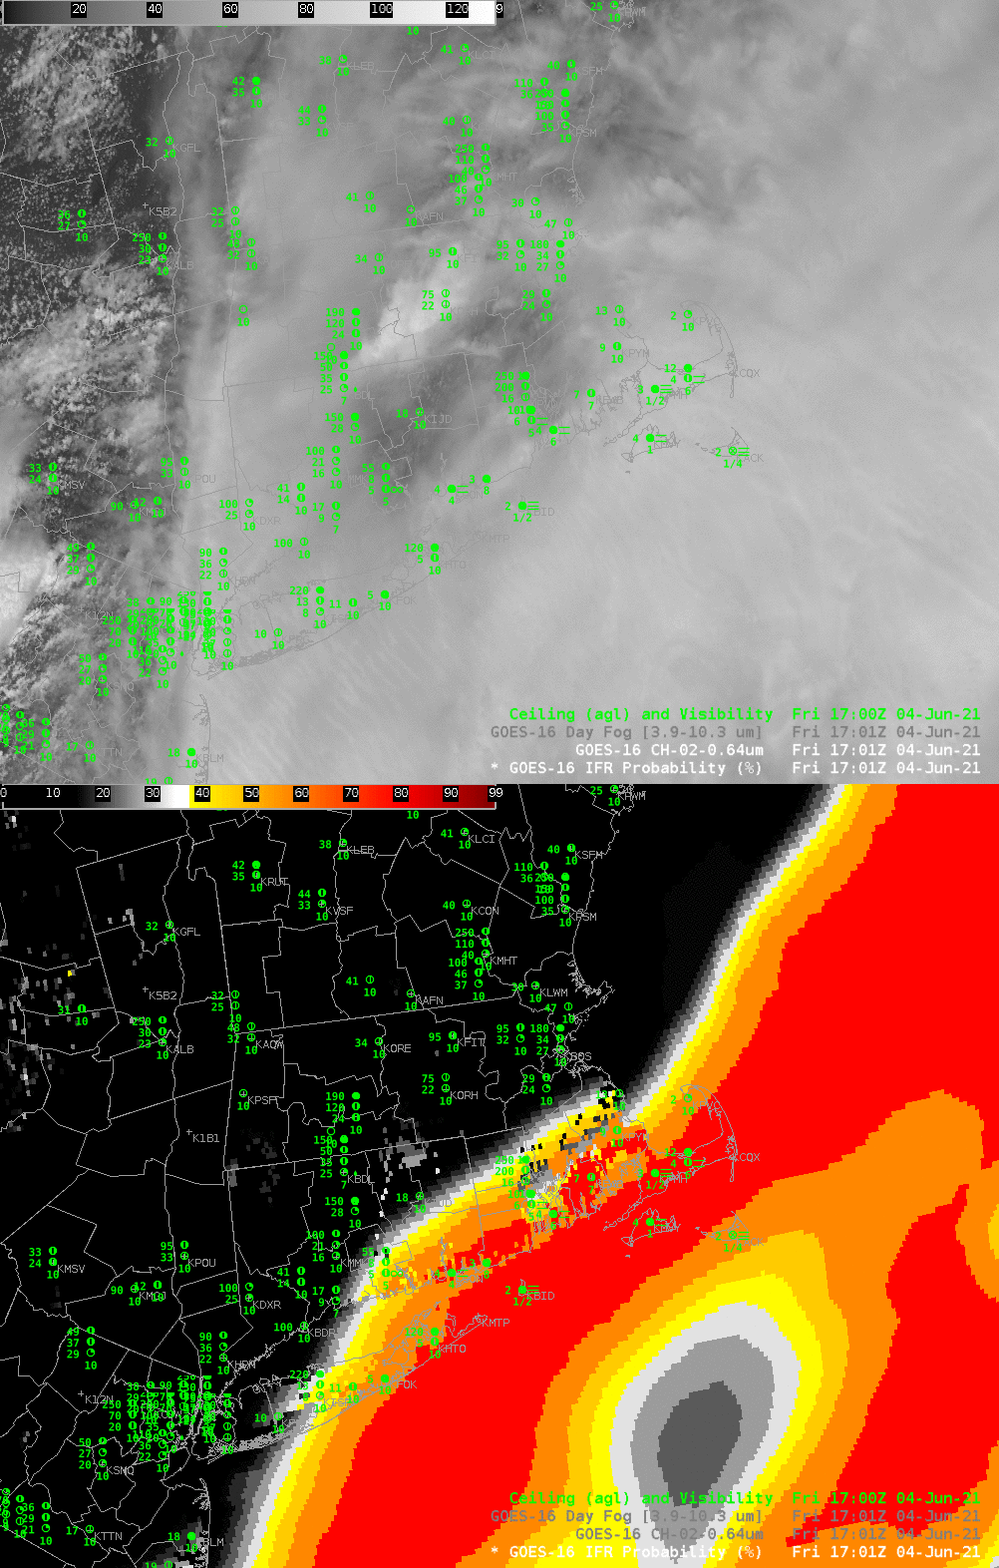
Toggle of GOES-16 visible Imagery (0.64  µm) and IFR Probability at 1701 UTC on 4 June 2021 (Click to enlarge). Surface observations of ceilings (AGL) and visibilities at 1700 UTC are included.

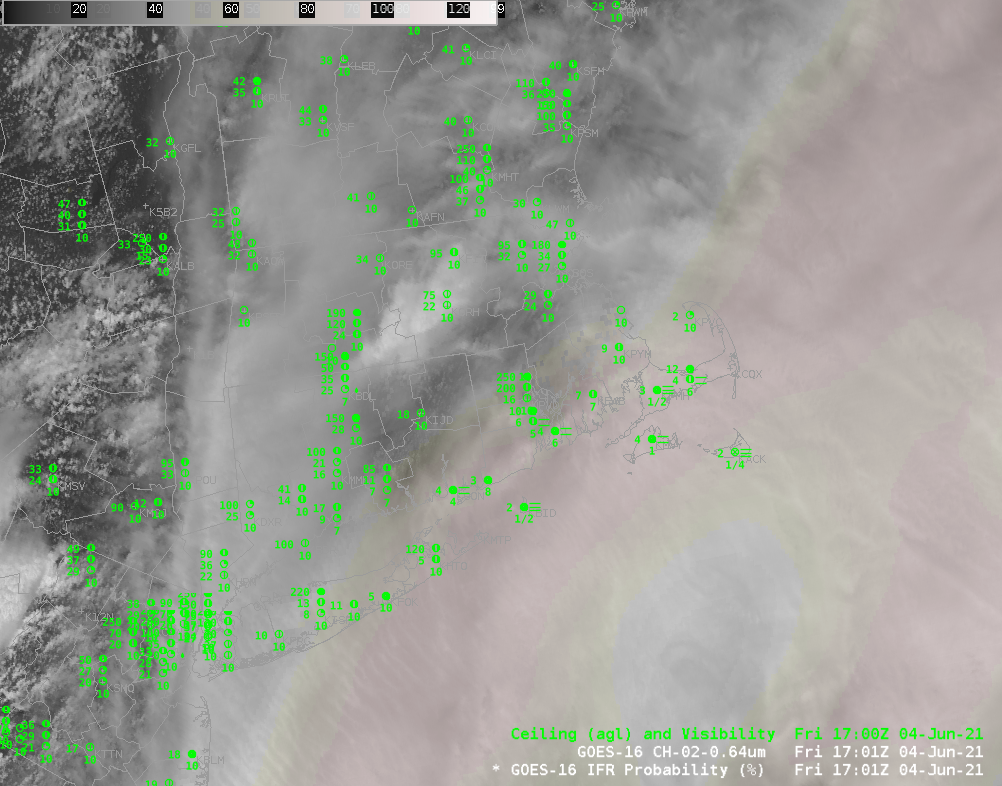
Mid-day observations over southeastern New England (and the offshore islands) show widespread fog. The toggle above shows mid-day visible imagery and GOES-16 IFR Probability. It’s very difficult to assess from the satellite imagery (especially on a day such as 4 June when high clouds are also present) alone where the reduced visibilities sit. Because IFR PRobability includes information on low-level saturation from the Rapid Refresh model, a better estimate of the horizontal extent of fog results. High IFR Probability values are widespread along the south coast of New England and the offshore islands where IFR and Low IFR conditions were observed. IFR Probability is a useful Situational Awareness tool. It can also be useful to load the imagery such that the IFR Probability is underneath a semi-transparent visible image, as shown below.

GOES-16 visible Imagery (0.64 µm) with underlain IFR Probability at 1701 UTC on 4 June 2021 (Click to enlarge). Surface observations of ceilings (AGL) and visibilities at 1700 UTC are included.