Daily Archives: August 31, 2012

Emissivity properties in a drought

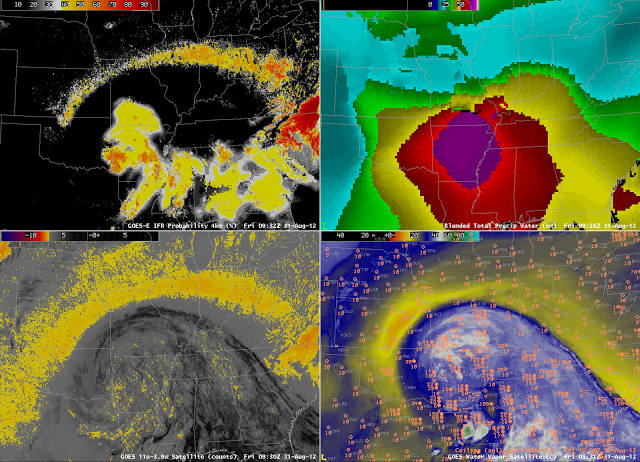
GOES-R IFR Probabilities (upper left), Total Precipitable Water (the so-called ‘Blended Product’) (upper right), 10.7 µm – 3.9 µm Brightness Temperature Difference (lower left), Enhanced Water vapor imagery with surface observations (lower right)

The driving mechanism in the brightness temperature difference product, the heritage method for detecting fog and stratus from satellites, keys on differences in the emissivity of water clouds at 3.9 µm versus the emissivity at 10.7 µm.  Water clouds do not emit 3.9 µm radiation as a blackbody does, but they do emit 10.7 µm radiation almost as a blackbody.

As ground dries out in a drought, its emissivity changes. Those changes are a function of wavelength.  This example is from early morning on 31 August, as the remnants of Isaac slowly spread northward.  The brightness temperature difference shows a strong signal around the cirrus canopy of the storm.  These highlighted regions arcing from Kansas to Illinois have suffered extreme drought all summer.  The satellite signal is so strong in this case over the very dry Earth — because of the changed emissivity properties of the parched Earth — that it cannot be overcome by the model parameters that are used.  As a result, IFR probabilities are high over Indiana and Illinois where no IFR conditions are observed.

GOES-R Fog and the Day/Night Band on VIIRS

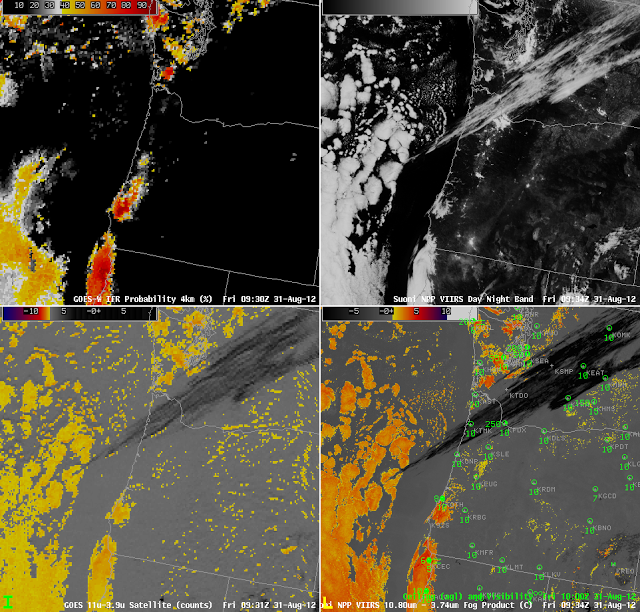
GOES-R IFR Probabilities (upper left), Suomi/NPP VIIRS Day/Night Band (upper right), Brightness temperature difference (10.7 micrometers – 3.9 micrometers) from GOES (lower left), Brightness temrperature difference (11.35 micrometers – 3.74 micrometers) from Suomi/NPP VIIRS (lower right), all around 0930 UTC on 31 August.

The presence of the Day/Night band on the VIIRS instrument on the Suomi/NPP satellite offers a unique method of validating the presence of fog or stratus at night.  During times near full moon (such as the Blue Moon on 31 August), the Day/Night band can detect low clouds using light reflected from the moon.  The GOES-R IFR probabilities show fog and low/stratus over southwestern Oregon;  a larger region of fog/low stratus stretched from just north of Crescent City, CA (where IFR conditions are reported) southward down the coast.  Note also a small patch over southwestern Washington and coastal northwest Washington (where IFR conditions are reported.  Cirrus clouds that prevent the detection of fog/low stratus from satellite are present stretching northeastward from the ocean off the central Oregon coast into central Washington.  There is a small signal in the GOES-R IFR Probability field underneath this upper cloud feature.

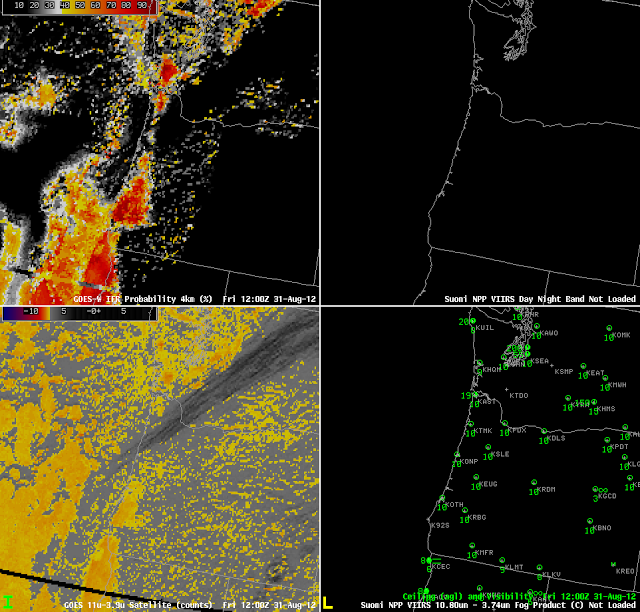
GOES-R IFR probabilties (Upper left), Suomi/NPP VIIRS day/night band (upper right), GOES-West Brightness Temperature Difference between 10.7 and 3.9 micrometer channels (Lower left), Observations (Lower right), all around 1200 UTC, 31 August

AT 1200 UTC, some benefits of the GOES-R IFR probability field are apparent.  The noisy signal over central and eastern Oregon is reduced, and a signal is present also underneath the thin cirrus streak that persists over extreme northwest Oregon.

IFR in Alaska when a Large-Scale weather system is present

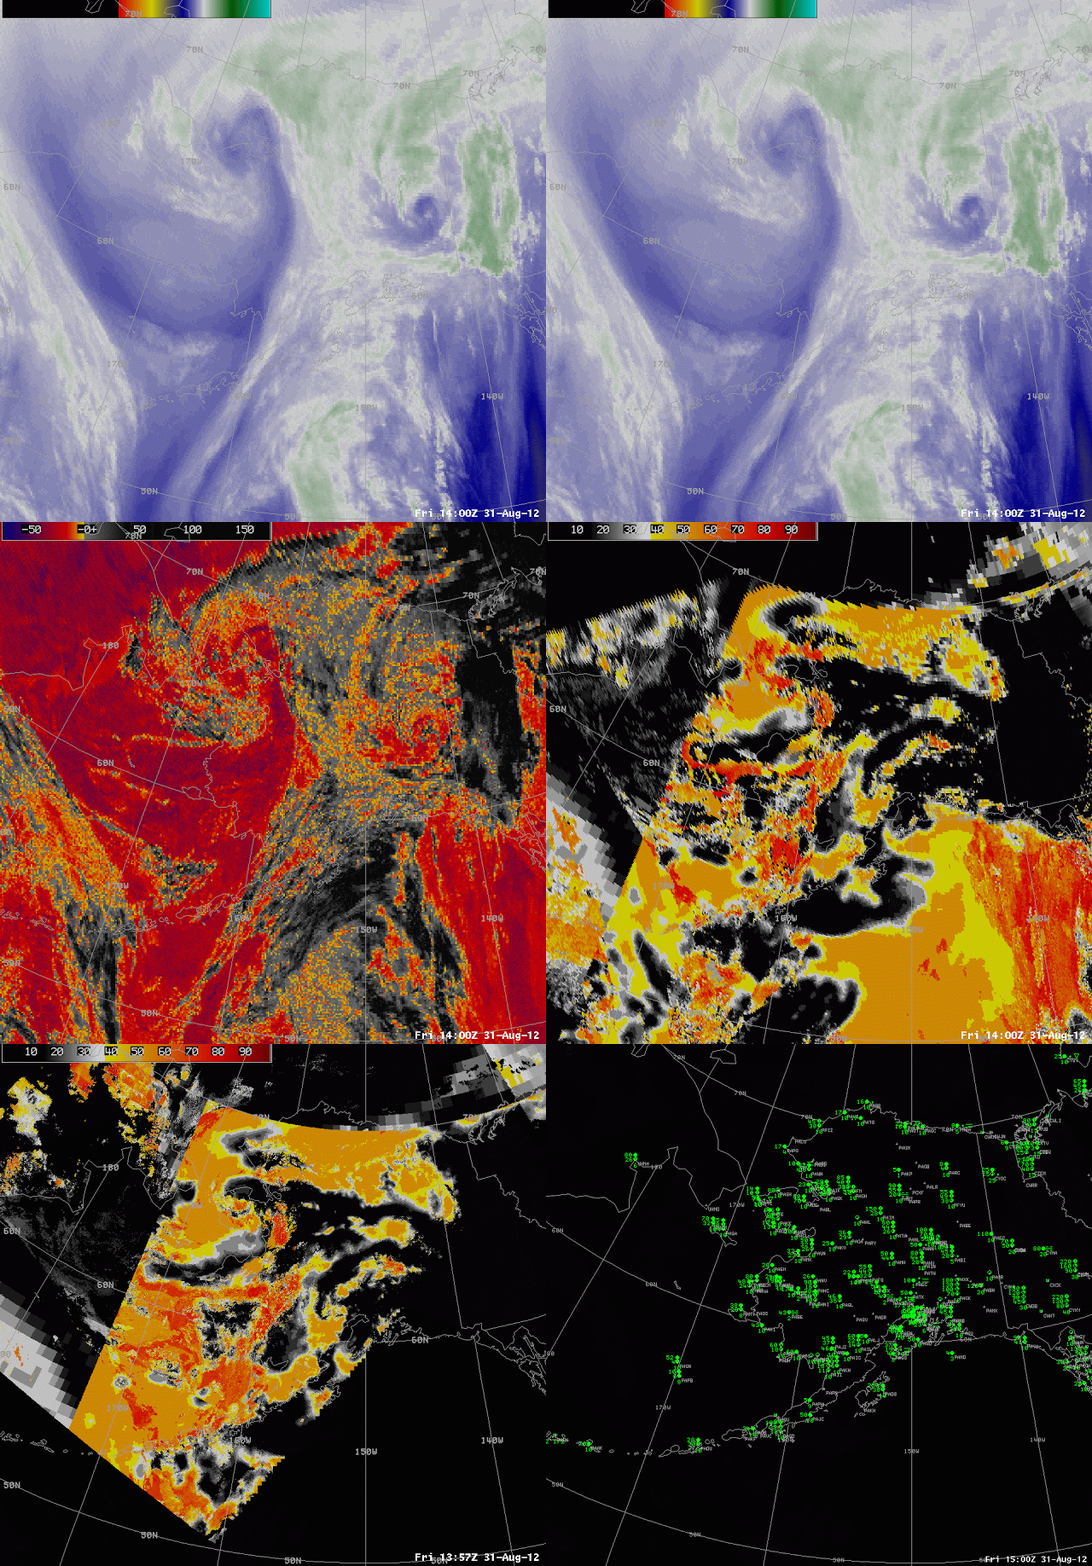
Animation of 1400 UTC Water vapor imagery, the 10.7 micron infrared image, the brightness temperature difference (10.7 – 3.9), the GOES-R IFR Probabilities computed from GOES data, the GOES-R IFR Probabilities computed from MODIS data, and the surface observations/ceilings.

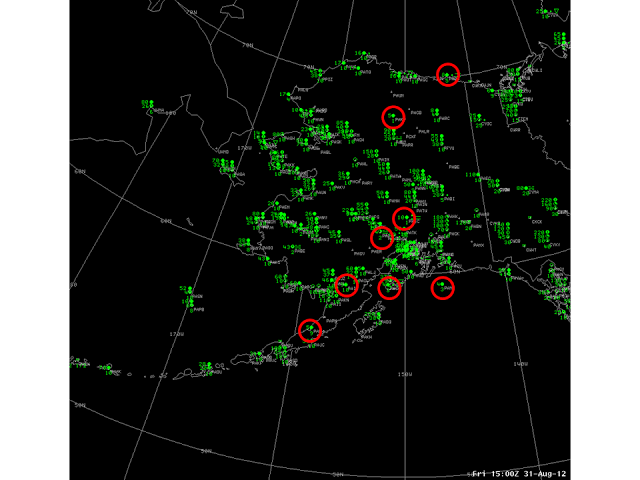
The loop above cycles through the 1400 UTC Water vapor imagery, the 10.7 micron infrared image, the brightness temperature difference (10.7 – 3.9), the GOES-R IFR Probabilities computed from GOES data, the GOES-R IFR Probabilities computed from MODIS data, and the surface observations/ceilings.  The complex large-scale weather system over northwest Alaska is means that southerly winds over eastern Alaska are drawing moisture and cloudiness northward from the Gulf of Alaska.  Multiple cloud layers in this moist flow means that the traditional method of fog/low stratus detection (the brightness temperature difference between 10.7 and 3.9 micrometers) will be challenged.  Furthermore, on this particular day, IFR conditions (the observation map is below;  stations with IFR conditions are circled in red) are most frequent underneath the multiple cloud layers in the eastern part of the state, and at high levels, such as in the Brooks Range.

The GOES-R IFR probability field suggests higher possibilities of IFR conditions in regions where IFR conditions are observed:  near Anchorage, on the Aleutian peninsula and in the Brooks Range.

Observations over Alaska at 1500 UTC 31 August.  IFR conditions highlighted by red circles.

IFR over SW Alaska

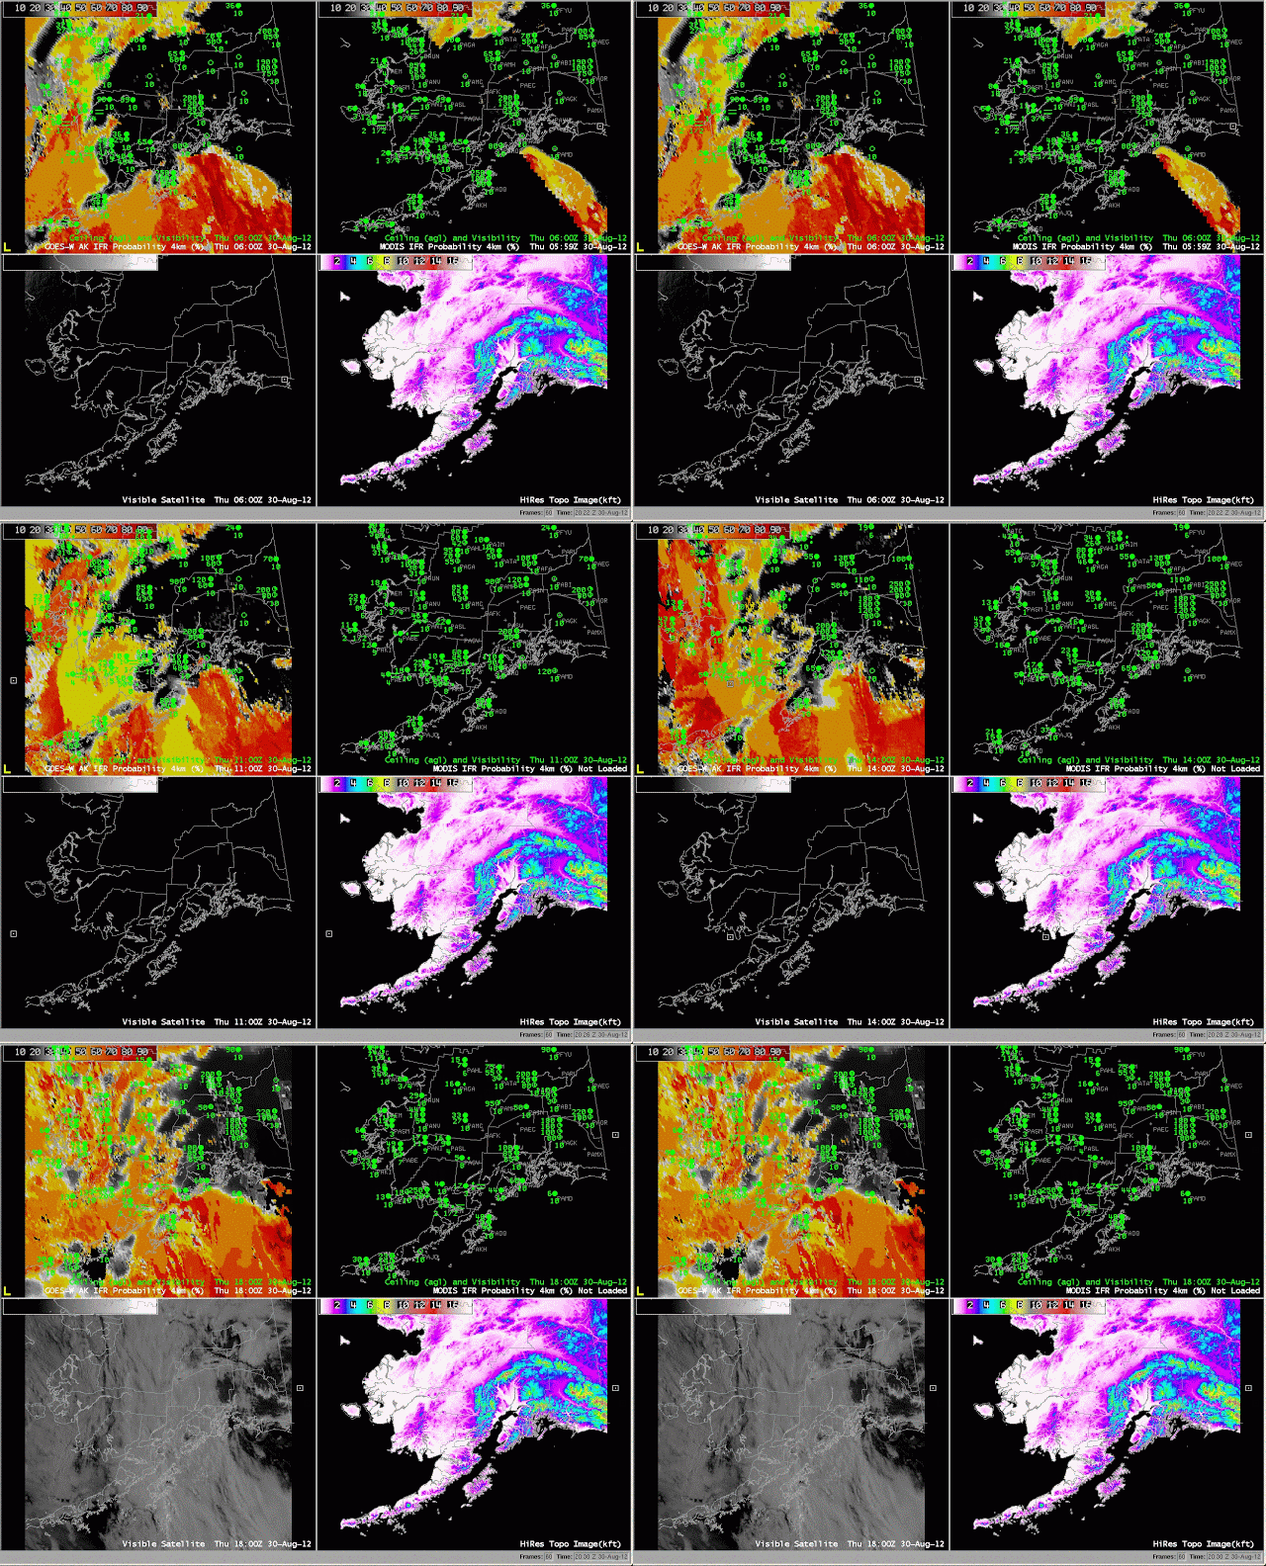
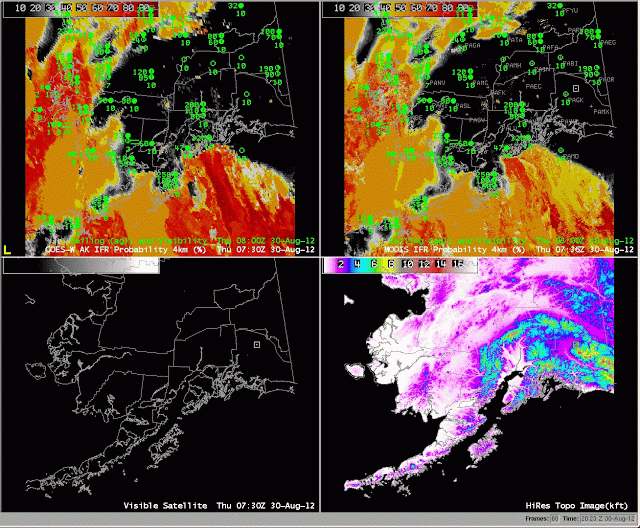
GOES-R IFR Probabilities (upper left) computed from GOES-West, GOES-R IFR Probabilities computed from MODIS (upper right), Visible Imagery (bottom left), Topography (bottom right)

GOES-R probabilities are a fused product between satellite data and the Rapid Refresh model.  Model data are used only where multiple cloud layers are present and or where a single cirrus cloud level exists.  The character of the IFR probability field looks different when model data only is used.  IFR probabilities are lower when only model data are used.

IFR probabilities are well related to observations at Kodiak, for example.  As the higher probabilities increase from the southwest, ceilings lower, and eventually IFR conditions occur.  The better resolution of the MODIS imagery, below, allows far finer-scale structures to be resolved in the imagery.

GOES-R IFR Probabilities (upper left) computed from GOES-West, GOES-R IFR Probabilities computed from MODIS (upper right), Visible Imagery (bottom left), Topography (bottom right)

Note how the smaller probabilities are downwind of the Aleutians.  Visible imagery — at the end of the animation — distinctly shows the clear region.