Category Archives: Rocky Mountains

Fog backed up against the front range of the Rockies

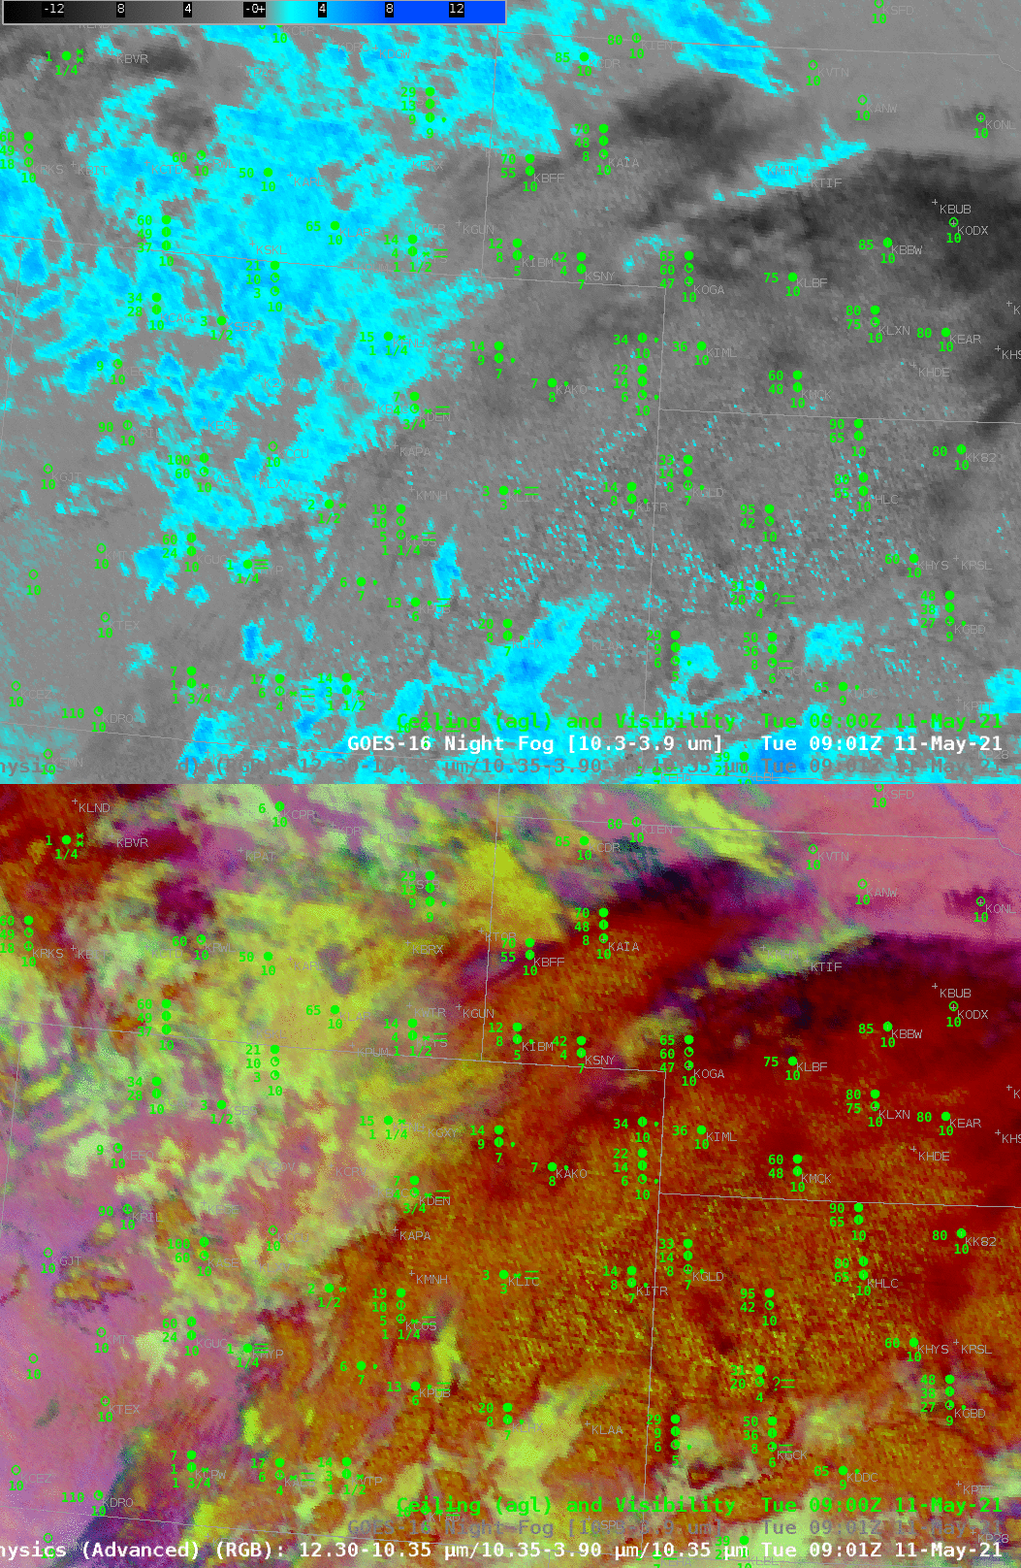
GOES-16 Night Fog Brightness Temperature Difference (10.3 µm – 3.9 µm) and Nighttime microphysics RGB, 0901 UTC on 11 May 2021, along with observations of ceilings (AGL) and visibility

The toggle above compares Night Fog Brightness Temperature difference fields at 0901 UTC on 11 May over Colorado and surrounding states. Both fields can be used to identify regions of stratus/low stratus — and by inference, fog. At this time, however, it is a challenge to use these satellite-only products because of widespread mid/upper-level clouds over eastern Colorado, Kansas and Nebraska. Note how the blue/cyan regions in the Night Fog Brightness Temperature Difference field show through into the Nighttime Microphysics RGB; the green component of that RGB is the Night Fog Brightness Temperature Difference field.

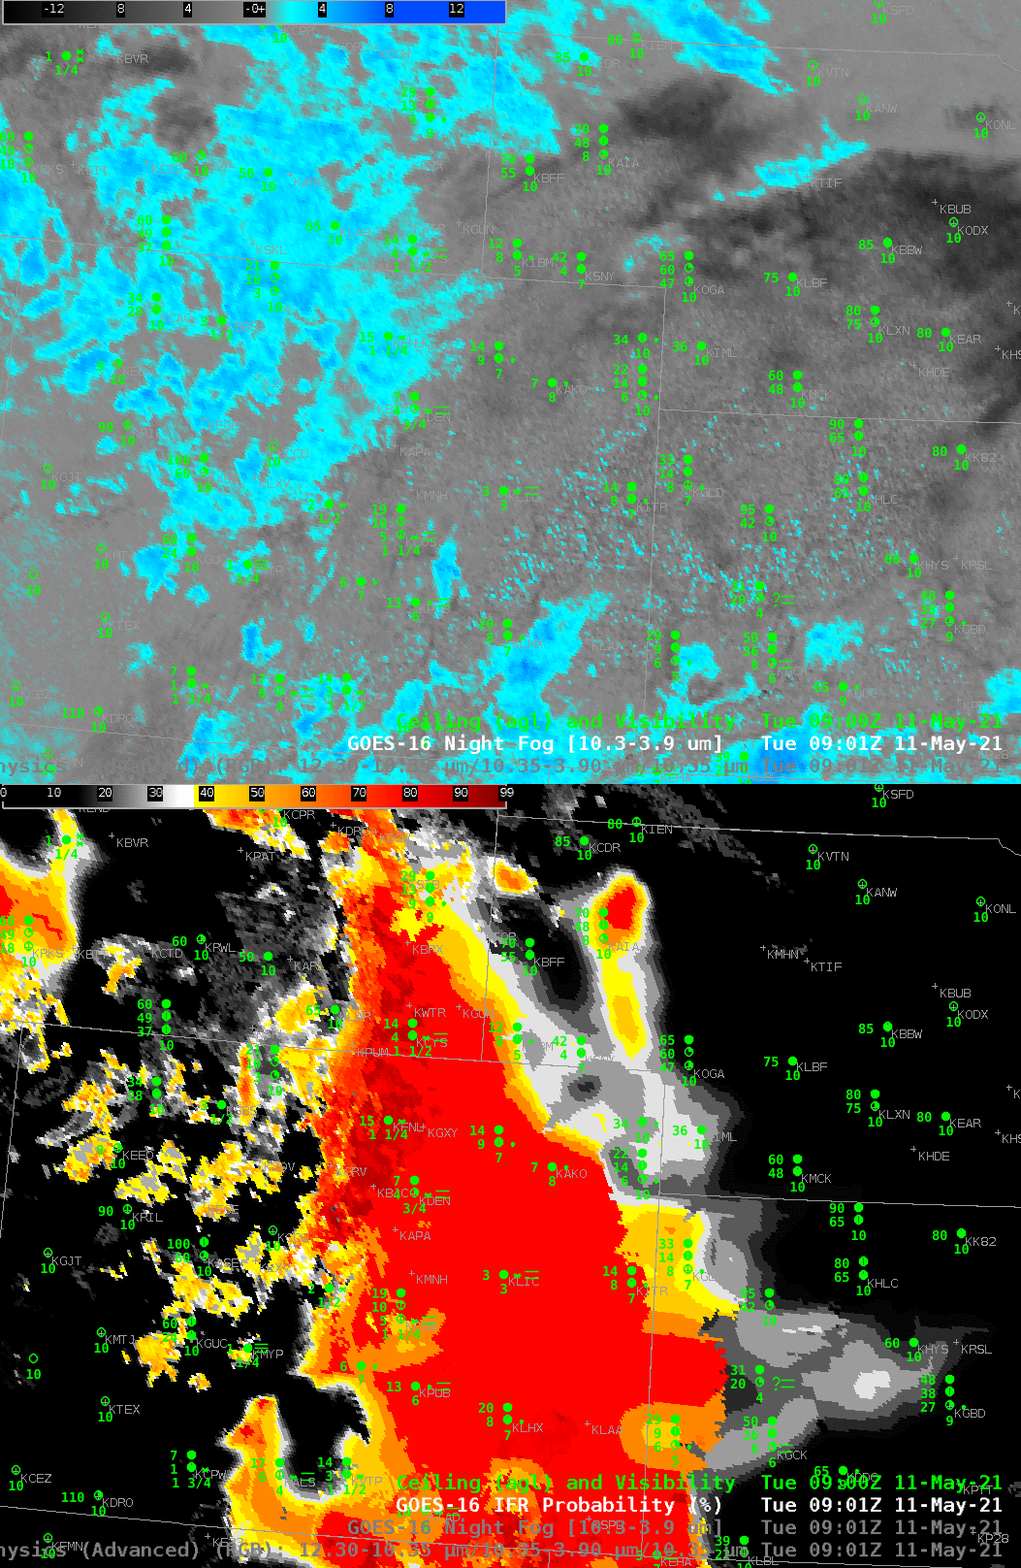
On this day, the high clouds prevented the Brightness Temperature Difference alone from highlighting regions of fog. IFR Probability fields, below from the same time, show that this field better outlined the region of low clouds/fog over the High Plains. The field incorporates both Night Fog Brightness temperature difference fields — to determine where stratus clouds might be — and Rapid Refresh model estimates of low-level moisture — to determine where saturation might be occurring. Where the satellite detects stratus clouds, and where the Rapid Refresh model suggests low-level saturation, high IFR Probability (as over southeastern Colorado) results, in accordance with, on this day, observations. If high clouds are present (as over much of eastern Colorado), IFR Probability can still occur because the Rapid Refresh data shows low-level saturation. Note also that the extensive cloud cover over Kansas and Nebraska — elevated stratus — does not have a strong signal in the IFR Probability fields.

This product blends the strengths of satellite observations and the strength of model estimates.

GOES-16 Night Fog Brightness Temperature Difference  (10.3 µm – 3.9 µm) and IFR Probability, 0901 UTC on 11 May 2021, along with observations of ceilings (AGL) and visibility

Fog in the Mountains

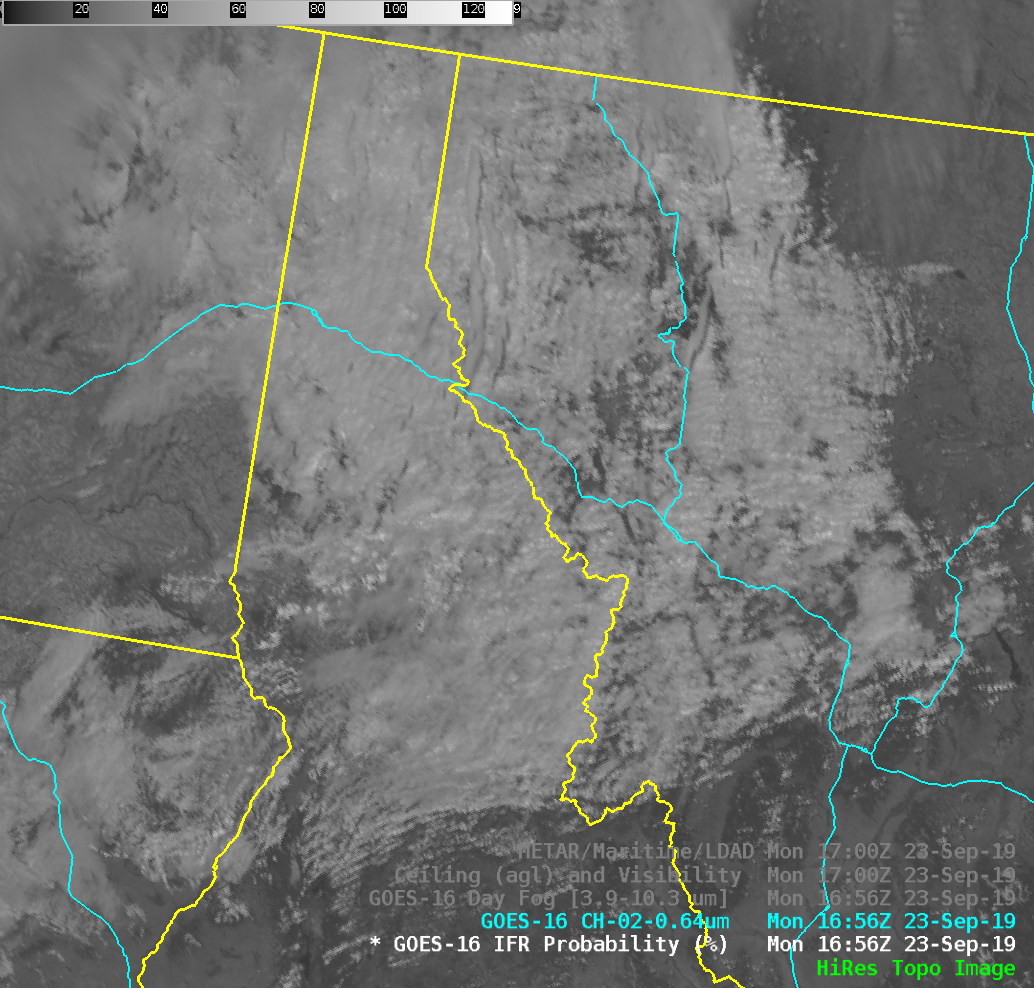
GOES-16 Band 2 (0.64 µm) over Montana and northern Idaho, 1656 UTC on 23 September 2019. Major highways are also shown, including east-west I-90 (Click to enlarge)

Consider the image shown above, visible imagery (0.64 µm) from the GOES-16 Advanced Baseline Imager.    Can you tell at a glance where the IFR Conditions exist?  If you are familiar with northern Rockies topography, and know that the prevailing surface winds in this area were southwesterly, perhaps you can make a good intuitive guess:  low ceilings and reduced visibilities are likely on the upwind side of the topography.

METAR observations at 1700 UTC on 23 September 2019 plotted over topography (Click to enlarge)

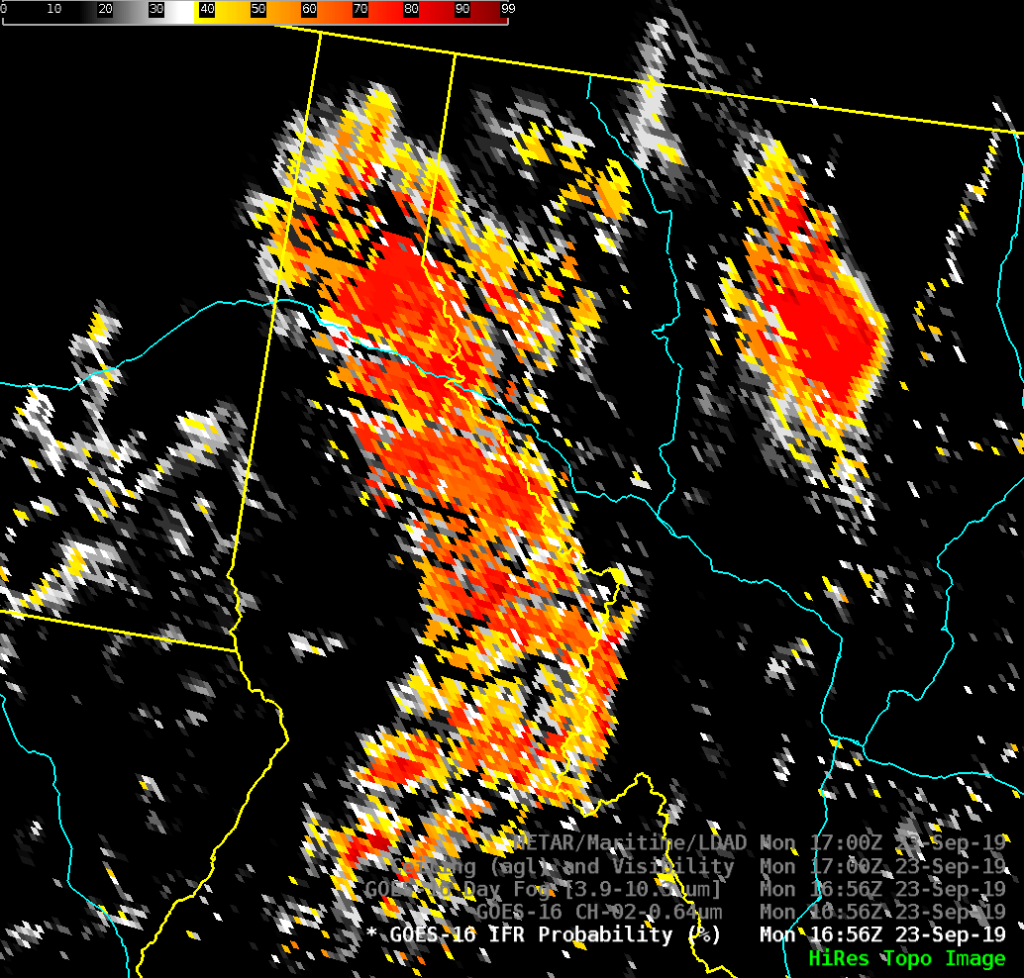
GOES-R IFR Probability fields are computed from visible and infrared imagery as well as from Rapid Refresh model estimates of low-level saturation. IFR Probability fields, below, correctly show increased likelihood of IFR conditions over the mountains, and mostly on the windward side of the topography. Mullan Pass, north of the center of the image, at ~6000 feet above sea level, is observing IFR conditions.

GOES-16 IFR Probability fields, 1656 UTC on 23 September 2019 (Click to enlarge)

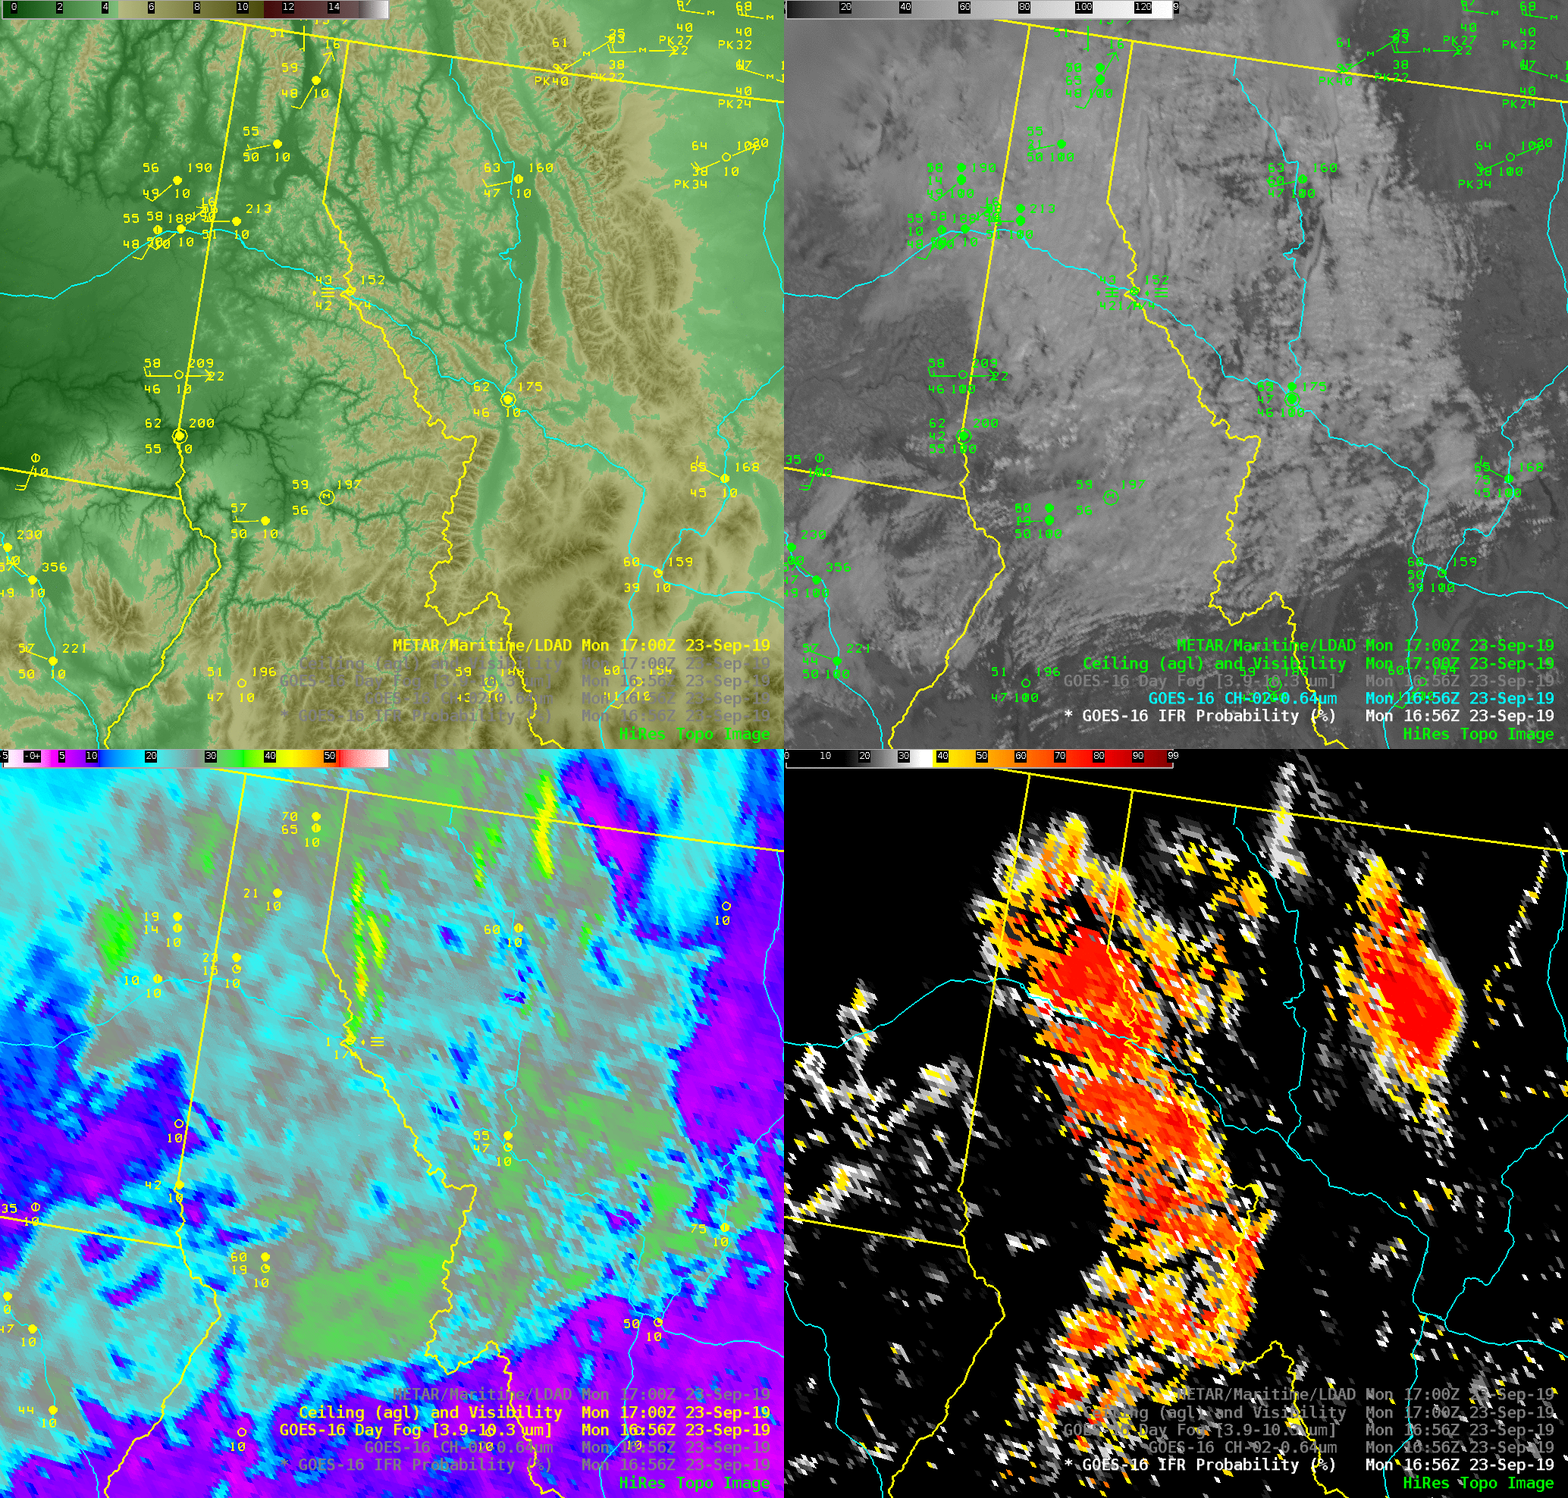
The animation below steps through the topography, visible imagery, ‘day fog’ brightness temperature difference (3.9 µm – 10.3 µm) and IFR Probability. The Brightness Temperature Difference field and the visible imagery show little relationship to the IFR Probability field.

Topography, GOES-16 ABI Band 2 (0.64 µm), ‘Day Fog’ Brightness temperature Difference (3.9 µm – 10.3 µm) and IFR Probability fields, all at 1656 UTC on 23 September 2019 (Click to enlarge)

An added benefit of IFR Probability fields: It can be used day or night.

Fog and Low Stratus under cirrus

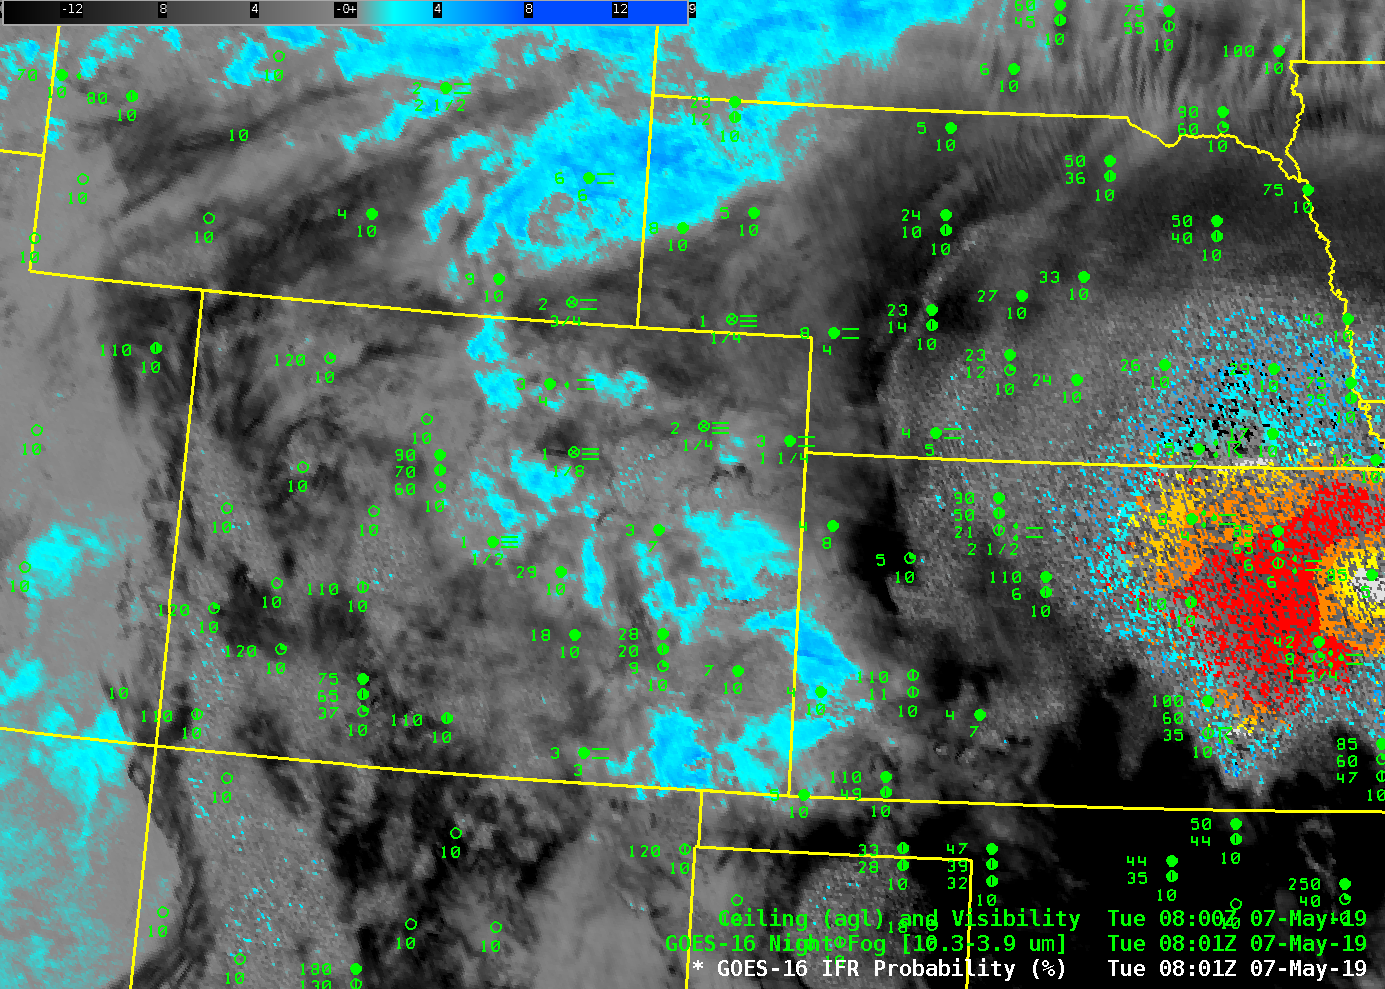
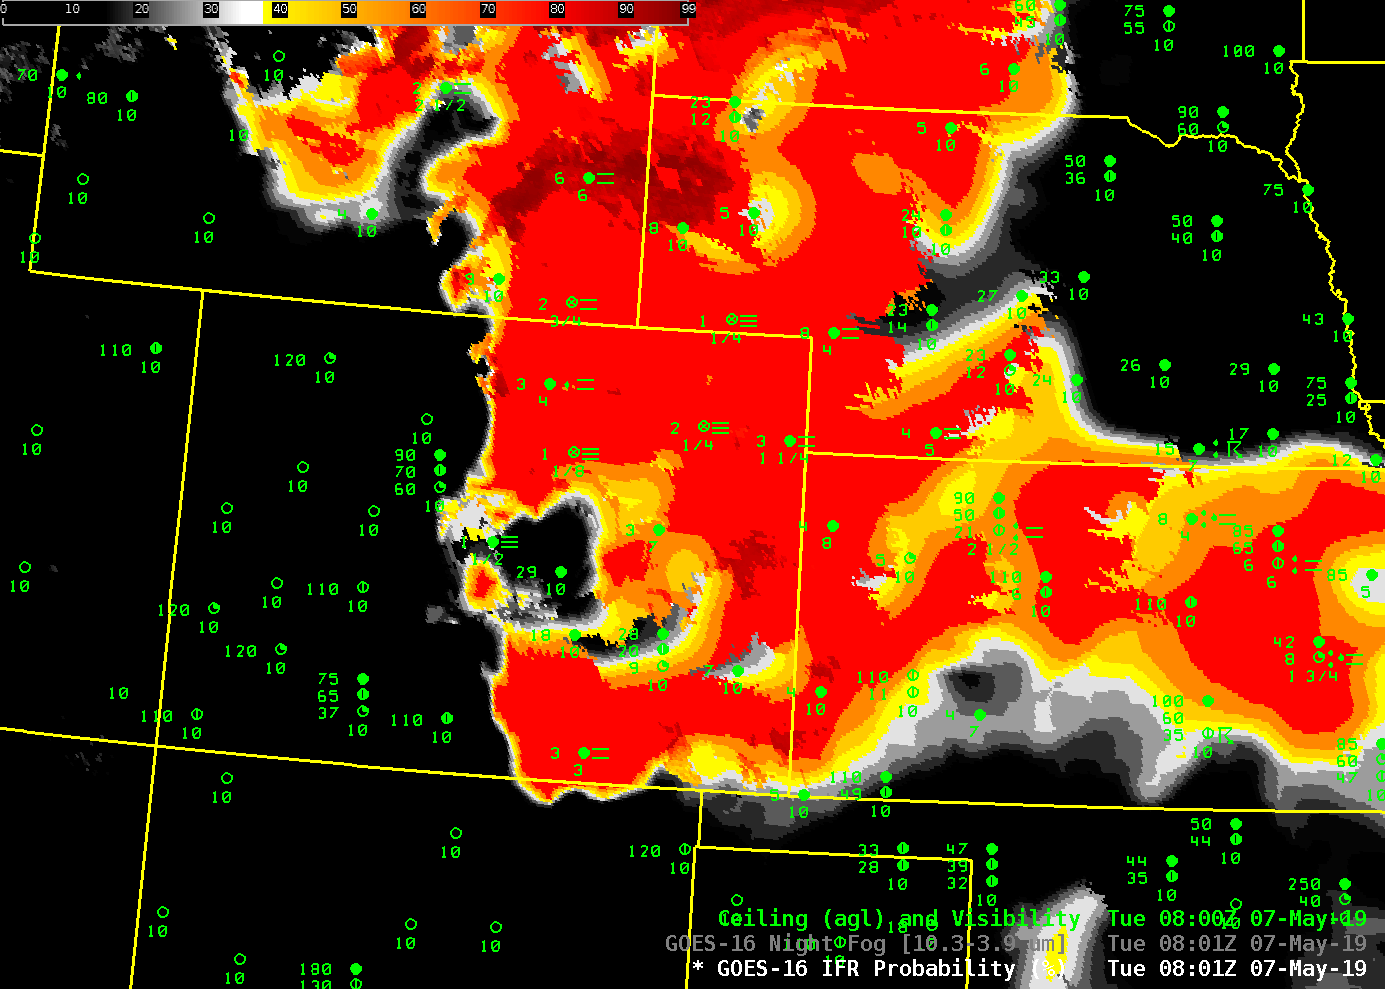
Night Fog Brightness Temperature Difference (10.3 µm – 3.9 µm), 0801-1311 UTC on 7 May 2019 (Click to animate)

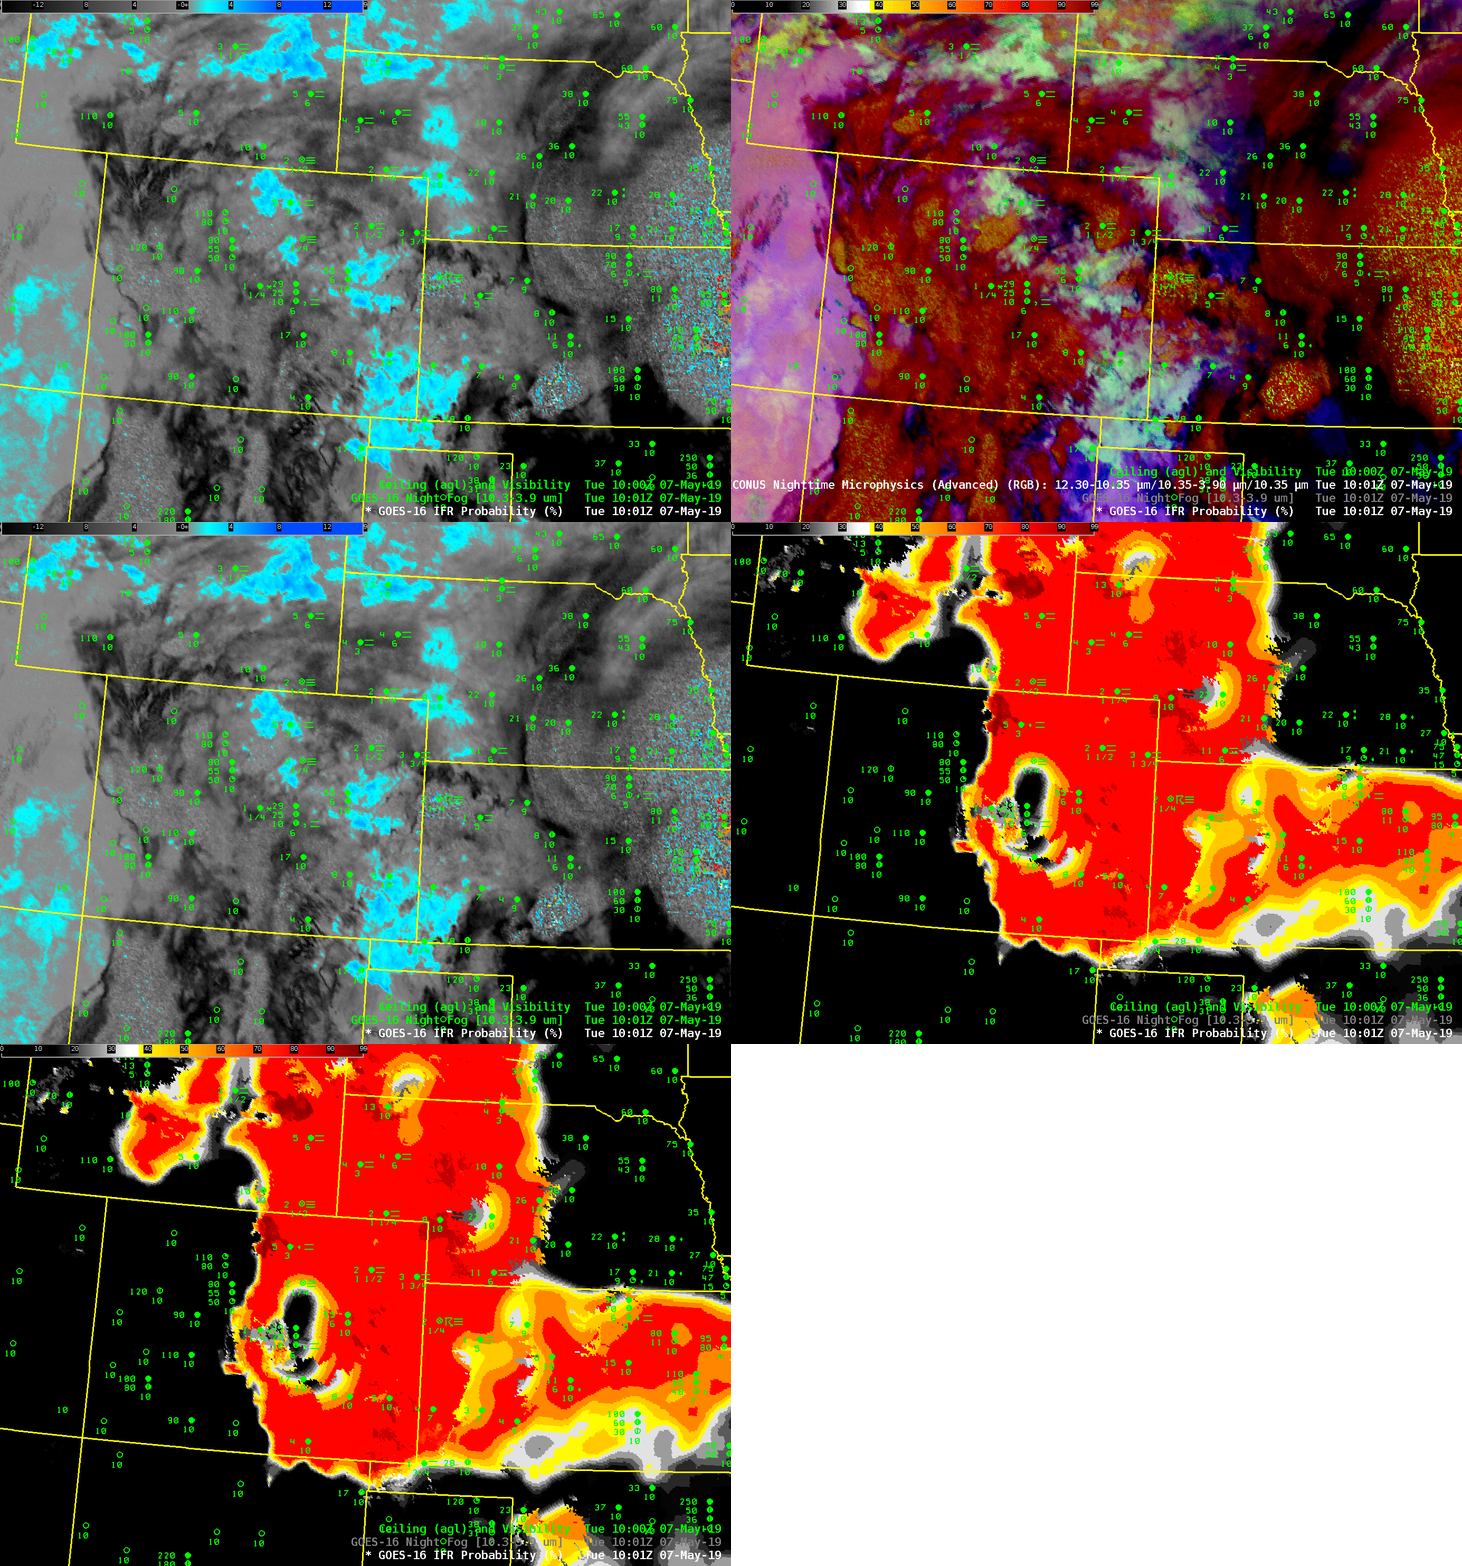
Consider the animation above, of the Brightness Temperature Difference product (10.3 µm – 3.9 µm) centered on Colorado on the morning of Tuesday 7 May 2019. The surface observations show widespread IFR conditions, but because of widespread high clouds over the region, the brightness temperature difference shows little signal that is consistent with low clouds (blue or cyan in this enhancement). There isn’t much horizontal spatial correlation between observations of low ceilings/reduced visibility and the Brightness Temperature Difference product. When low clouds are overlain by high clouds, don’t expect a satellite detection of low clouds to work. Note also how the Brightness Temperature Difference field loses its signal as the sun rises and a general increase in the amount of reflected solar shortwave (3.9 µm) infrared radiation increases.

GOES-R IFR Probability includes near-surface information that is useful, especially when mid-level or high clouds obscure the satellite view of low clouds. Rapid Refresh estimates of near-surface saturation are used to gauge the probability of IFR conditions. In the case on 7 May 2019, that information allowed GOES-R IFR Probability to approximate exactly where the lowest ceilings and more reduced visibilities were. There is therefore a much better spatial correlation between the location of surface observations showing IFR conditions, and the IFR Probability field. This has a tacit implication on how well the Rapid Refresh Model is simulating the evolution of the atmosphere. Note also that in contrast to the Brightness Temperature Difference field, a consistent signal is maintained through sunrise.

GOES-R IFR Probability, and surface observations of ceilings/visibility, 0801-1311 UTC on 7 May 2019 (Click to animate)

Because the NightTime Microphysics RGB relies on the Night Fog Brightness Temperature difference field, it rises or falls on fog detection on the shoulders of the Brightness Temperature Difference field. On this day, it fell. Click here for the Nighttime Microphysics RGB animation; the animation below toggles between the three fields — Night Fog Brightness Temperature Difference, Nighttime Microphysics RGB, and IFR Probability — at 1002 UTC on 7 May 2019.

Night Fog Brightness Temperature Difference (10.3 µm – 3.9 µm), Nighttime Microphysics RGB and GOES-R IFR Probability fields, 1001 UTC on 7 May 2019 (Click to enlarge)

Dense Fog over Idaho

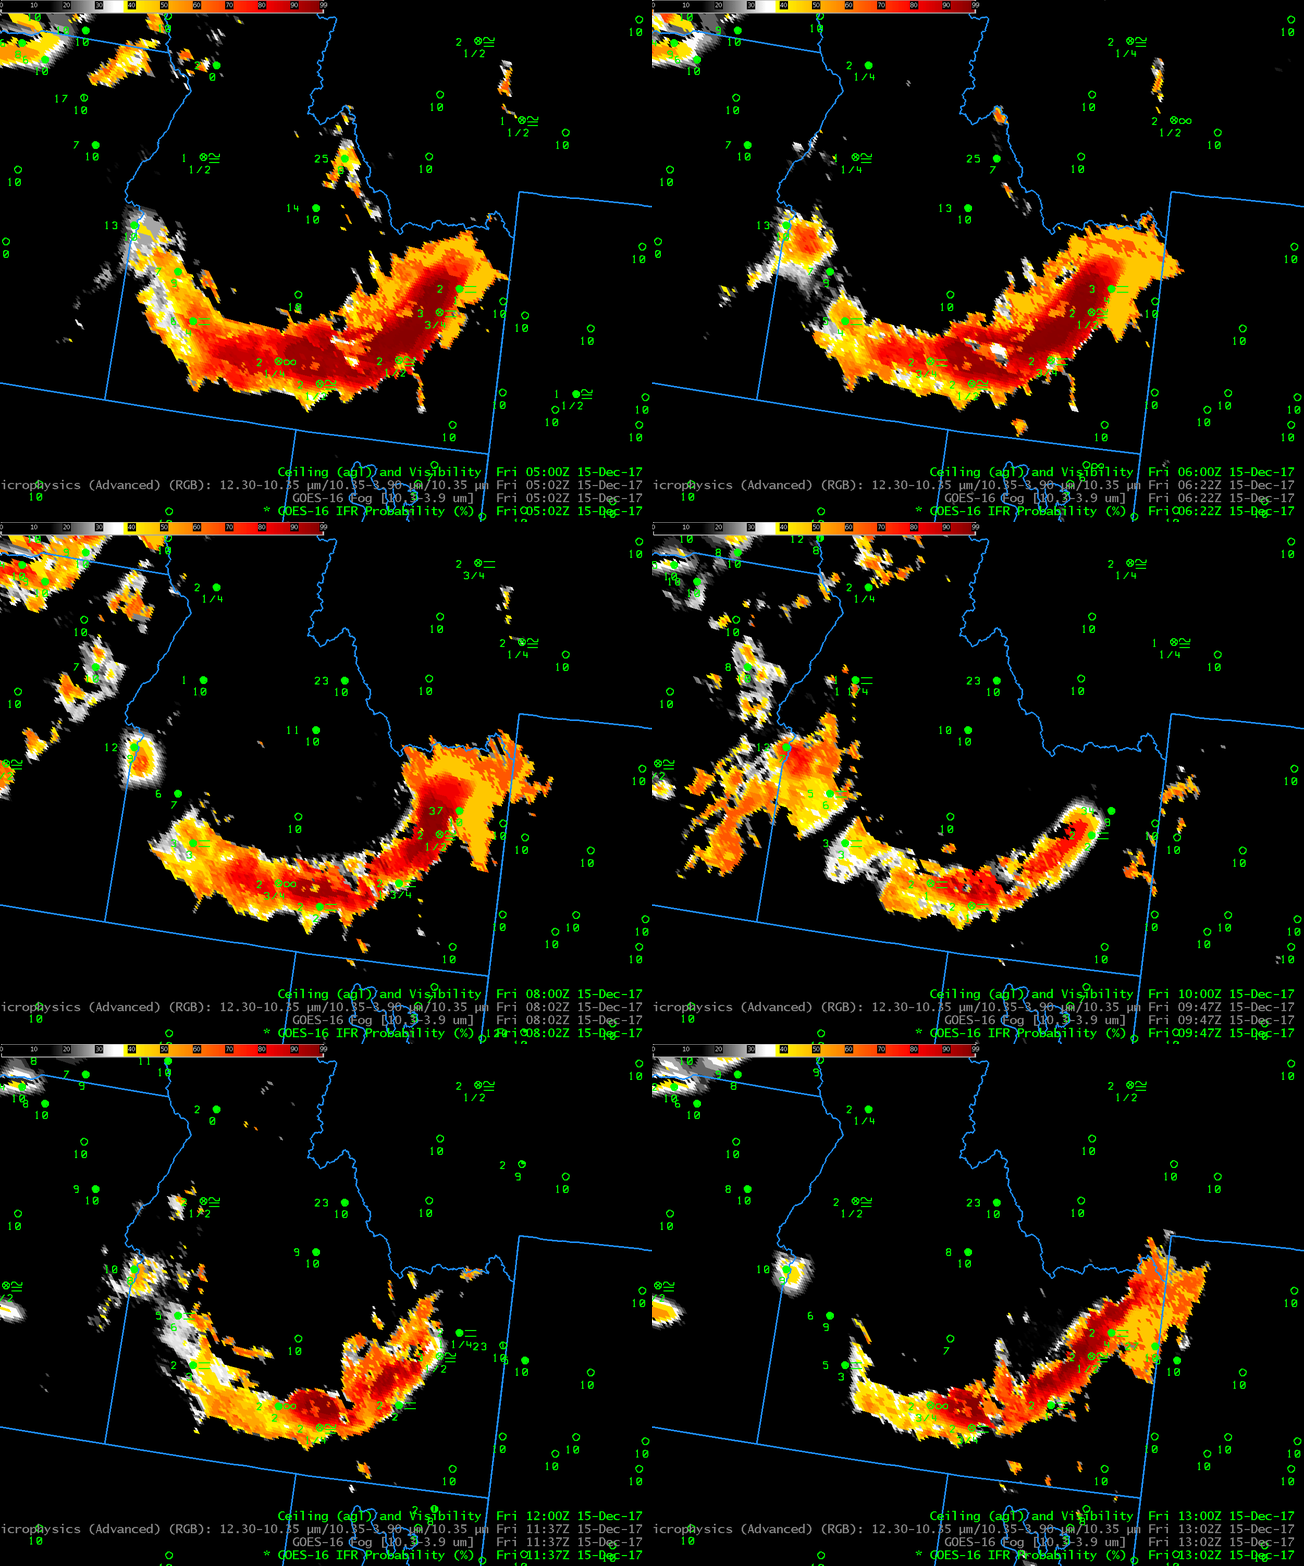
GOES-16 IFR Probability fields, 0502-1302 UTC on 15 December 2017 (Click to enlarge)

GOES-16 data posted on this page are preliminary, non-operational and are undergoing testing

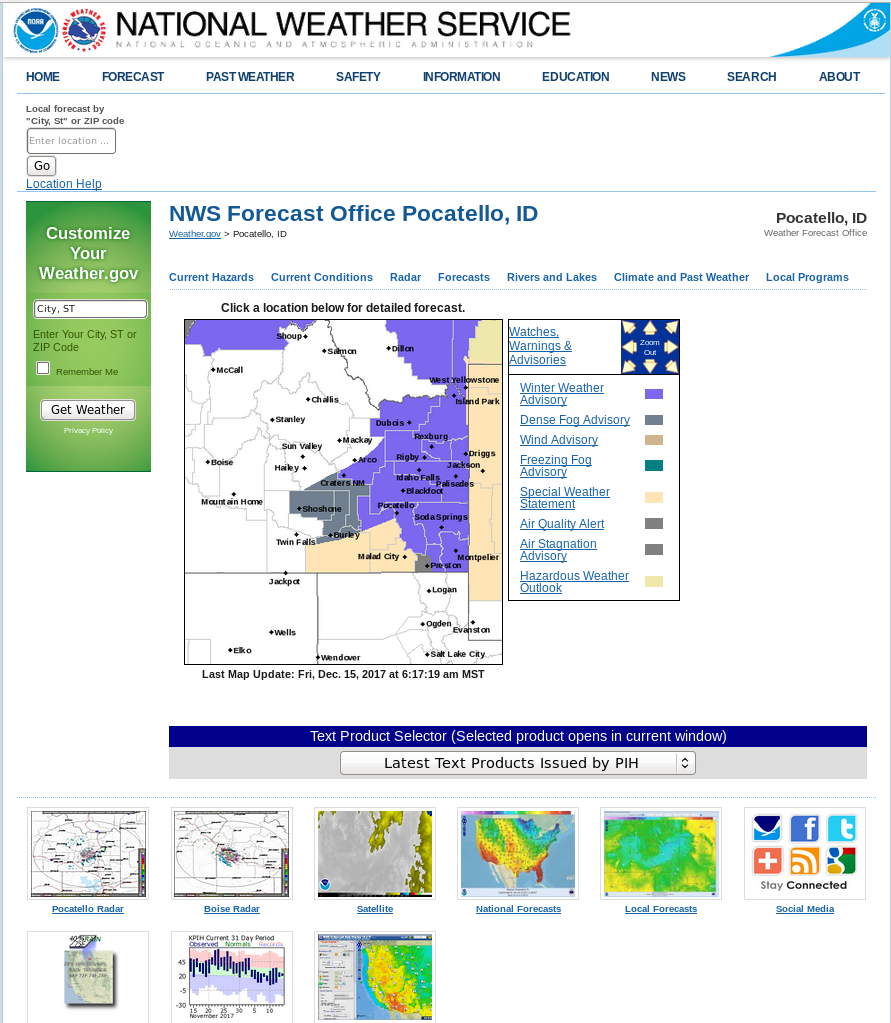
GOES-16 is now in the operational GOES-East position (but not, yet, technically operational) and GOES-16 data started flowing shortly after 1500 UTC on Thursday 14 December. GOES-16 produces excellent imagery over the western United States despite the satellite’s station at 75.2 West Longitude. The animation above shows GOES-16 IFR Probability fields over Idaho, with large values over the Snake River; High Pressure over the region has capped moisture (and pollutants) in the valley, and reduced visibilities are a result. (Click here for the Boise Sounding from 0000 UTC on 15 December from this site) The Pocatello Idaho Forecast Office of the NWS issued (at bottom) Dense Fog Advisories that were valid in the morning of 15 December 2017.

The excellent temporal resolution allows for close monitoring of the eastern edge of the region of fog, expanding eastward from the Snake River Valley into Wyoming and Montana.

The animation above shows consistent GOES-16 IFR Probabilities over the Snake River, and observations of low ceilings and reduced visibilities.  Note that over the eastern part of the Valley, from Pocatello to Idaho Falls and Rexburg, the character of the IFR Probability field at times loses all pixelation.  During this time (around 1000 UTC), model data (in the form of low-level saturation in the Rapid Refresh Model) are contributing to the IFR Probability Field, but satellite data are not because of high-level cirrus.  The animation, below, of the Nighttime Fog Brightness Temperature Difference (10.3 µm – 3.9 µm), confirms the presence of cirrus (they appear grey/black in the color enhancement).  It also suggests why that field alone rather than a fused field such as GOES-R IFR Probability can struggle to detect fog in regions of cirrus.

GOES-16 Brightness Temperature Difference Field (10.3 µm – 3.9 µm), 0502-1302 UTC on 15 December 2017 (Click to animate)

Products that use only satellite data, such as the Brightness Temperature Difference field, above, or the Advanced Nighttime Microphysics RGB Product, below, that uses the (10.3 µm – 3.9 µm) Brightness Temperature Difference field as the ‘Green’ component, will always struggle to detect fog in regions of cirrus. Of course, the superb temporal resolution of GOES-16 mitigates that effect, as in this case; it’s obvious in this animation what is going on: a band of cirrus is moving over the fog, but it not likely affecting it.  A single snapshot of the scene, however, might not impart the true character of surface conditions.

Advanced NIghttime Microphysics RGB Composite, 0502-1302 UTC on 15 December 2017 (Click to enlarge)

Screencapture of WFO PIH (Pocatello Idaho) Website from 1320 UTC on 15 December 2017 (Click to enlarge)

The Challenge of Satellite Fog Detection at Very Small Scales

weather-gov-screencapture_1400utc_10nove2016

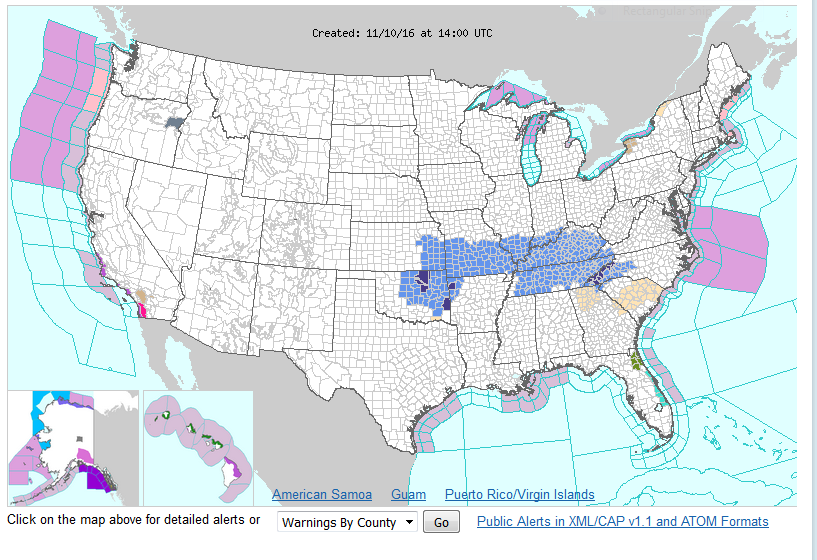
Hazards as depicted by http://weather.gov front page at 1400 UTC on 10 November 2016 (Click to enlarge)

Isolated regions of dense fog developed over eastern Oregon early in the morning on 10 November 2016, and one county — around Baker City — was placed in a Dense Fog advisory (Counties in the Willamette Valley of western Oregon, and near Glacier Park in Montana were placed under Dense Fog Advisories a bit later in the morning on 10 November). Click here to see a 1400 UTC mapping of IFR/LIFR conditions from the Aviation Weather Center.

URGENT – WEATHER MESSAGE
NATIONAL WEATHER SERVICE BOISE ID
600 AM MST THU NOV 10 2016

ORZ062-101800-
/O.NEW.KBOI.FG.Y.0012.161110T1300Z-161110T1800Z/
BAKER COUNTY-
500 AM PST THU NOV 10 2016

…DENSE FOG ADVISORY IN EFFECT UNTIL 10 AM PST THIS MORNING…

THE NATIONAL WEATHER SERVICE IN BOISE HAS ISSUED A DENSE FOG
ADVISORY…WHICH IS IN EFFECT UNTIL 10 AM PST THIS MORNING.

* VISIBILITY…ONE QUARTER MILE OR LESS.

* IMPACTS…TRAVEL HAZARD DUE TO POOR VISIBILITY…ESPECIALLY
ALONG INTERSTATE 84 BETWEEN BAKER CITY AND NORTH POWDER

PRECAUTIONARY/PREPAREDNESS ACTIONS…

A DENSE FOG ADVISORY MEANS VISIBILITIES WILL FREQUENTLY BE
REDUCED TO LESS THAN ONE QUARTER MILE. IF DRIVING…SLOW DOWN…
USE YOUR HEADLIGHTS…AND LEAVE PLENTY OF DISTANCE AHEAD OF YOU.

&&

$$

What kind of Fog-detection products are available to assist a forecaster in seeing at a glance that fog is developing? How useful are they for small-scale features such as that in Baker County Oregon?

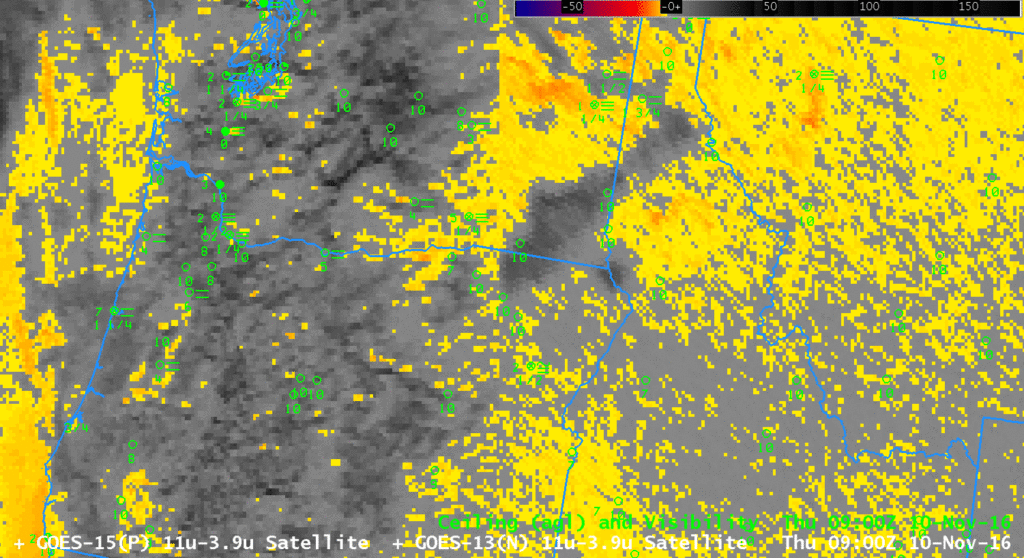
Brightness Temperature Difference Fields (3.9 µm – 10.7 µm) have historically been used to detect fog; the difference field keys on the Emissivity Differences that exist in water-based cloud droplets: they do not emit 3.9 µm radiation as a blackbody, but do emit 10.7 µm radiation more nearly as a blackbody, so computed brightness temperatures are different: cooler at 3.9 µm than at 10.7 µm. The Brightness Temperature Difference fields for 0900 and 1200 UTC are shown below (Note the seam — GOES-13 data are used east of the seam, GOES-15 data are used to the west). There is no distinct signal over Baker County, nor any pattern that can really help identify regions of fog. Cirrus is present over western Oregon (depicted as dark grey or black in this enhancement); satellite-only detection of low fog is not possible if cirrus prevents a view of the surface.
goes15btd_10nov_0900_1200toggle

GOES Brightness Temperature Difference Fields (3.9 µm – 10.7 µm) at 0900 and 1200 UTC on 10 November 2016 (Click to enlarge)

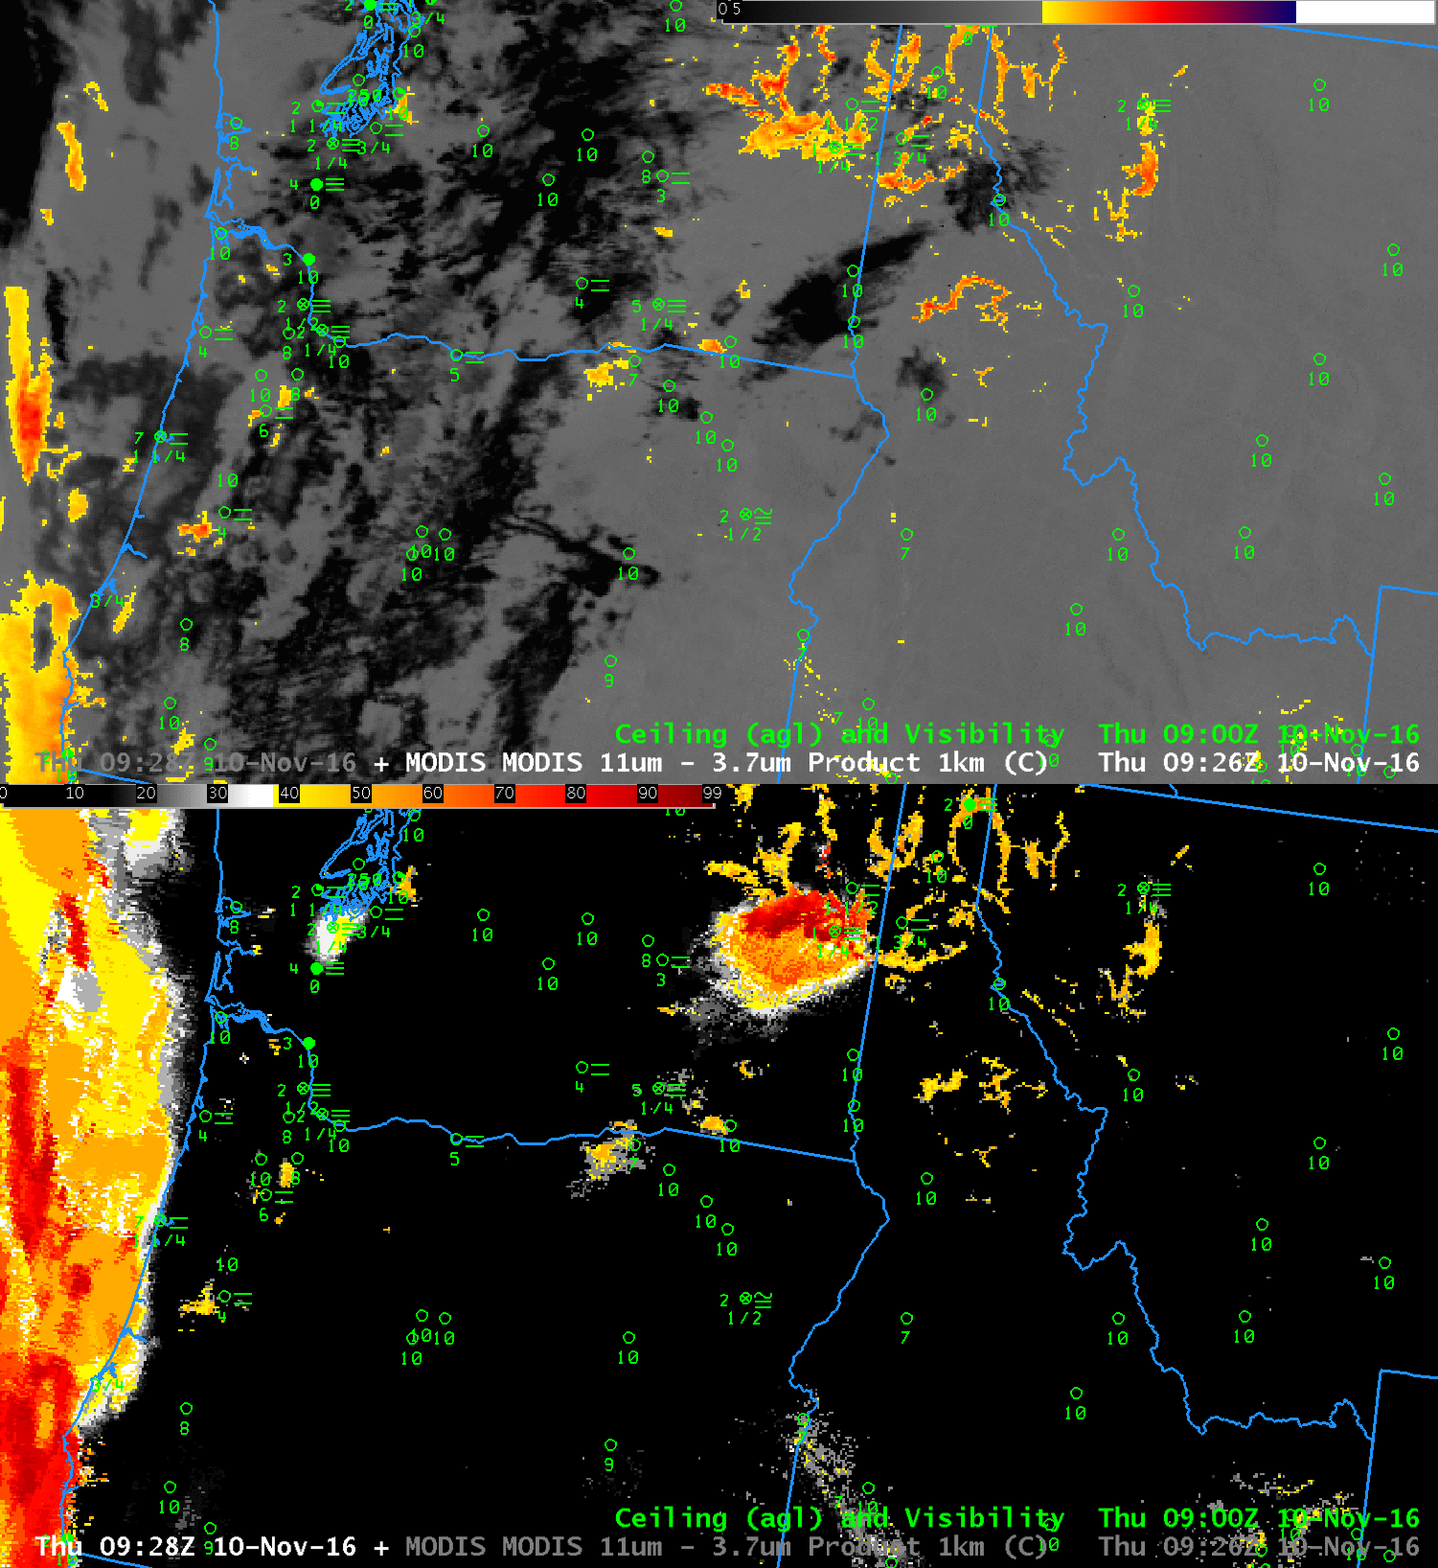
For a small-scale event, the nominal 4-km pixel size on GOES-15 and GOES-13 (a size that is closer to 6-7 km over Oregon because of the distance from the sub-satellite point) may prevent satellite detection of developing fog. The toggle below shows Brightness Temperature Difference fields at 0928 UTC from MODIS on Aqua, as well as the GOES-R IFR Probability fields computed using the MODIS data.  As with GOES data, the presence of cirrus in the Brightness Temperature Difference field is obvious and shown by a black enhancement.  Little signal is present over Baker County.  (There is a strong signal, however, in the valleys of northwest Montana and northern Idaho — compare this to the GOES-based brightness temperature difference above).

Note:  MODIS resolution is 1-km;  data from the Advanced Baseline Imager (ABI) on GOES-R will have nominal 2-km resolution at the sub-satellite point.
modis_btd_ifr_10nov_0928toggle

MODIS Brightness Temperature Difference fields (3.7 µm – 11 µm) and MODIS-based GOES-R IFR Probability, 0928 UTC on 10 November 2016 (Click to enlarge)

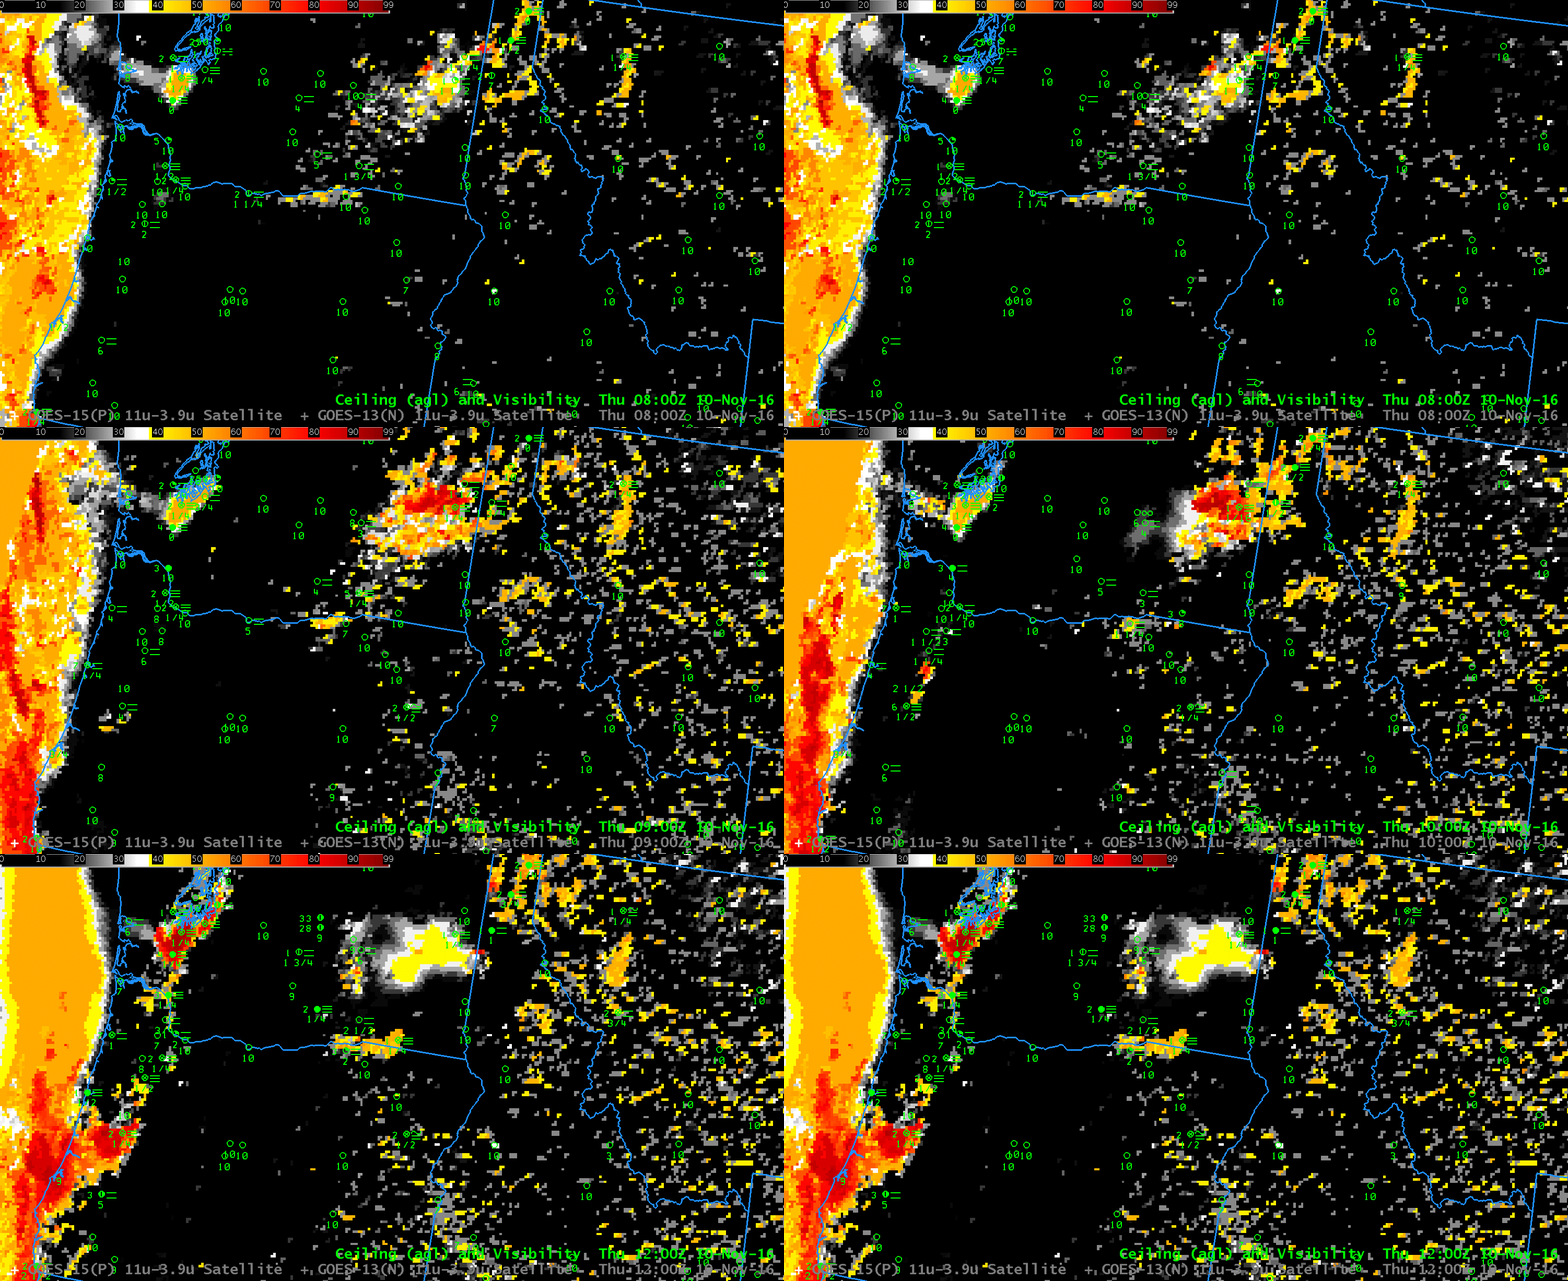
What does the GOES-based GOES-R IFR Probability field show during the early morning hours of 10 November? The animation below, from 0800-1200 UTC, shows some returns in/around Baker County. It would have been difficult to use this product alone to diagnose this fog feature however. (It did do a better job of diagnosing the presence of fog over northwest Montana and western Oregon where Advisories were later issued).
goesr_ifr_10nov_0800_1200anim

GOES-R IFR Probability fields, hourly from 0800 – 1200 UTC on 10 November 2016 (Click to enlarge)
Fog over northeast Colorado backs into Denver International

GOES_R_IFRP_31August2016-50

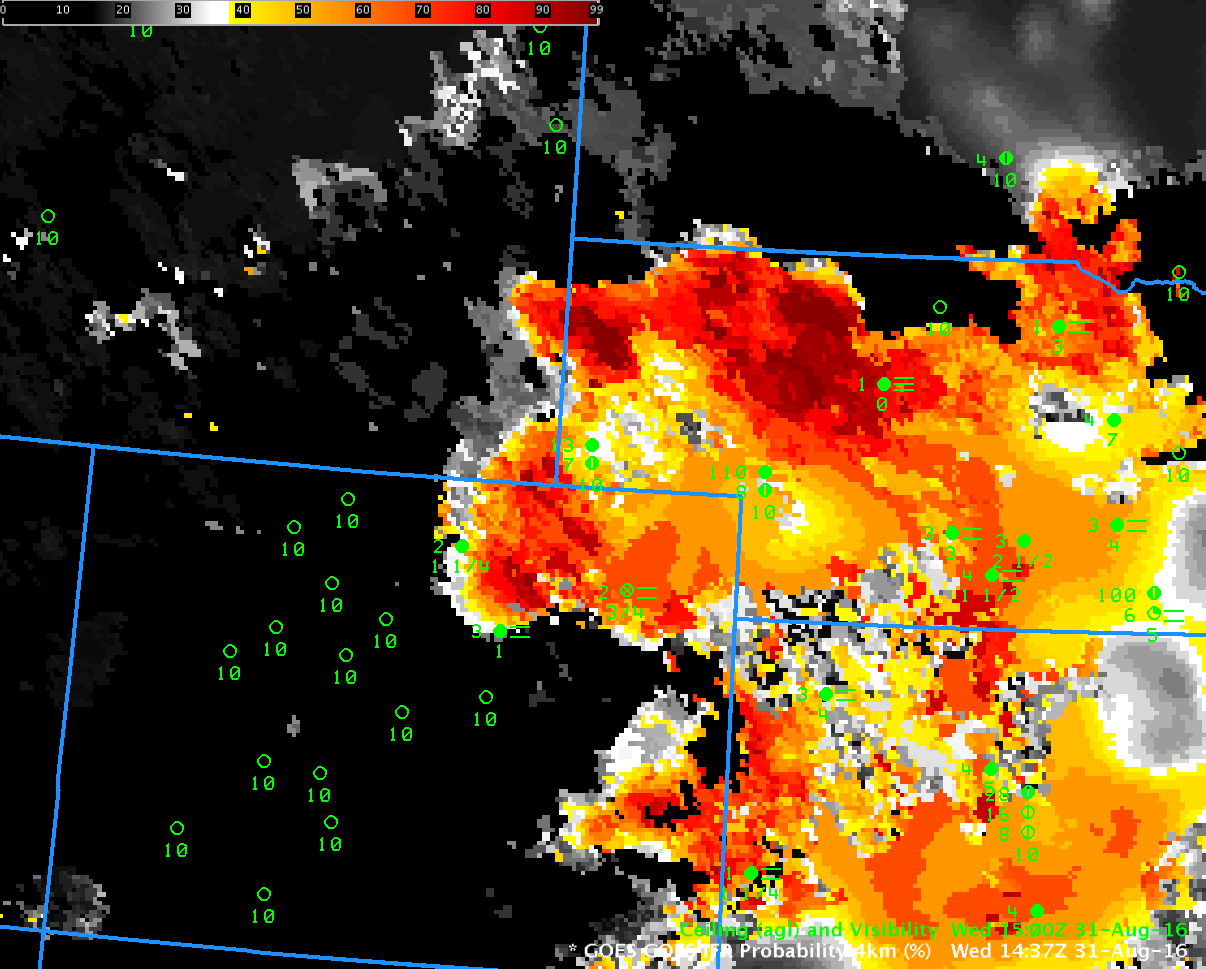
GOES-R IFR Probability Fields, 1437 UTC on 31 August 2016, with surface observations of ceilings and visibilities (Click to enlarge)

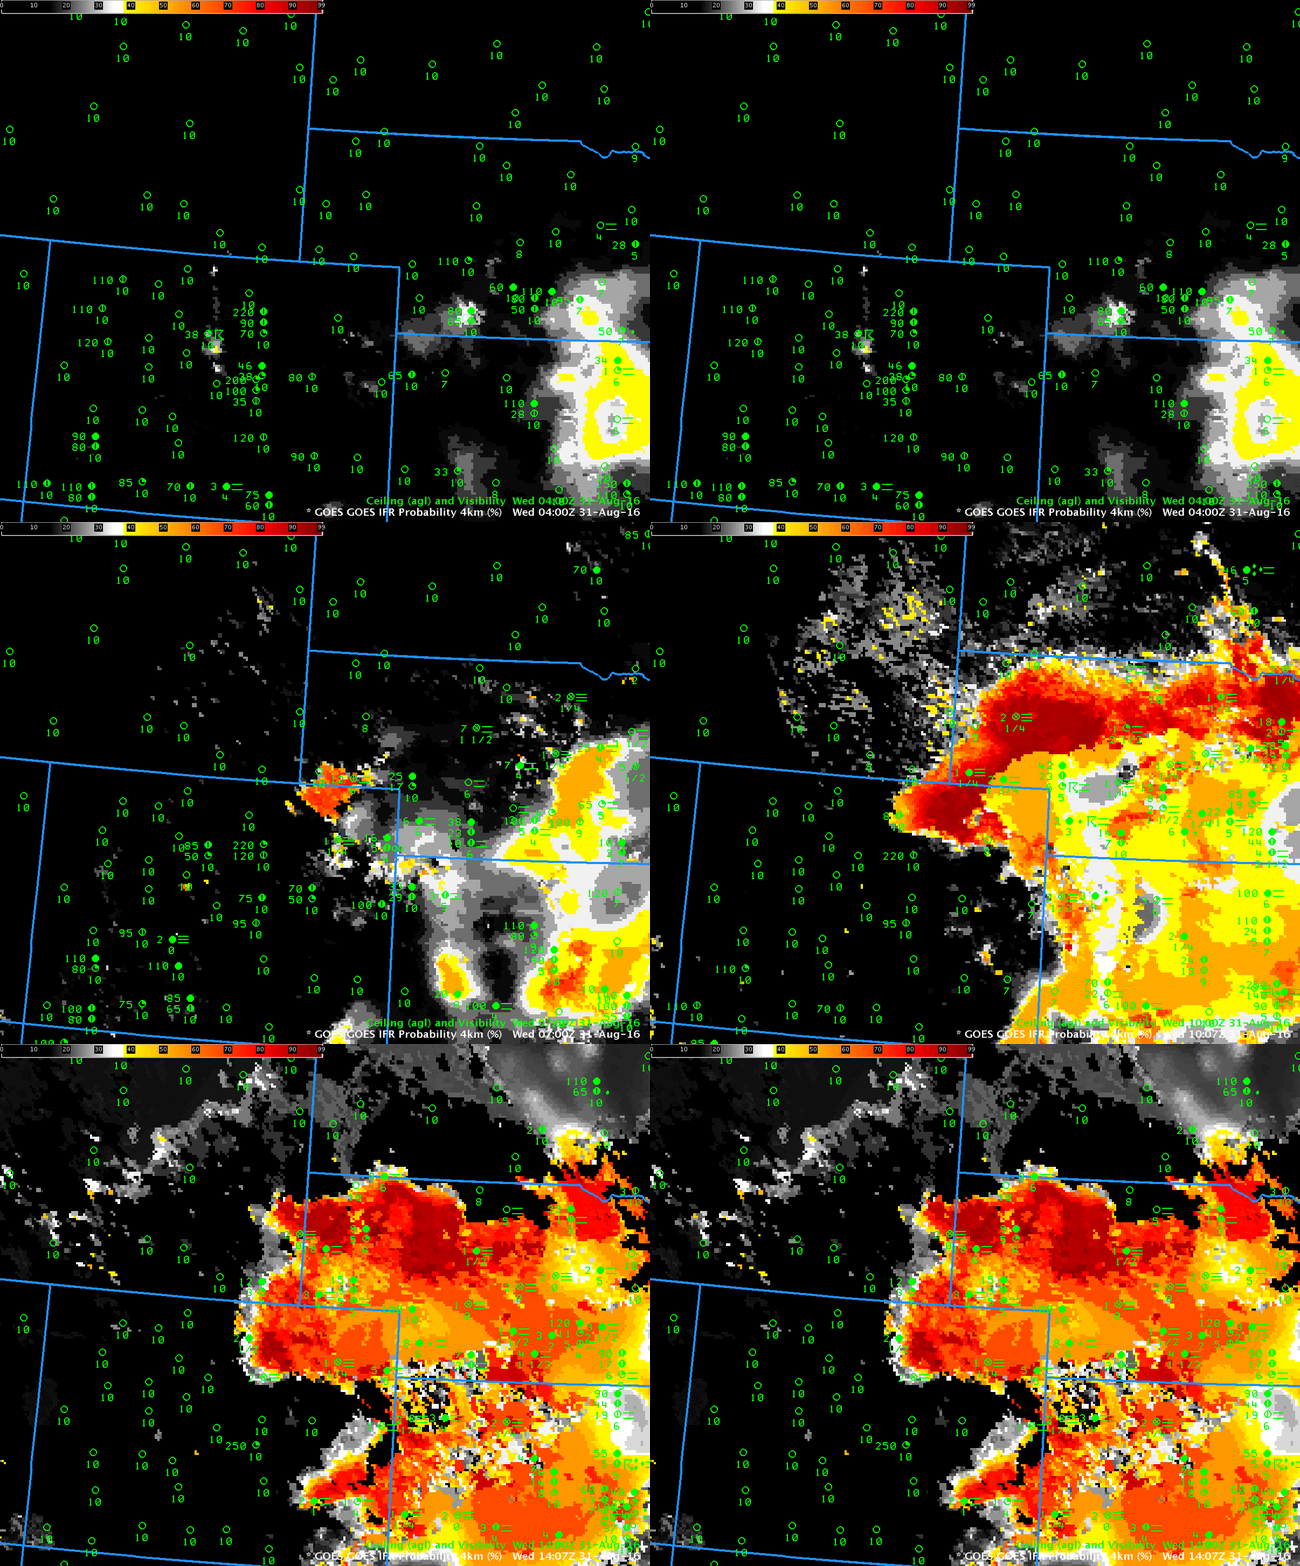
GOES-R IFR Probability Fields over Colorado and Nebraska on the morning of 31 August 2016 show high IFR Probabilities in close proximity to Denver International Airport (DIA), which airport was reporting IFR conditions starting at 1237 UTC. Webcams to the southwest and northeast of the airport shortly after 1500 UTC confirm that the IFR conditions’ edge was very near the airport.

The hourly animation of GOES-R IFR Probability fields, below, shows the evolution of the field. Its motion could be used in a prognostic manner.

GOES_R_IFRP_31August2016anim_0400_1400

GOES-R IFR Probability fields, ~hourly from 0400 through 1400 UTC on 31 August 2016 (Click to enlarge). Surface observations of ceilings and visibility are also plotted.

A similar event occurred on 22 September, see below from Mike Eckert and Amanda Terborg.09222016-den_fog

Fog and Low Stratus in Idaho’s Snake River Valley

IFRP-0500_1500anim_08feb2016

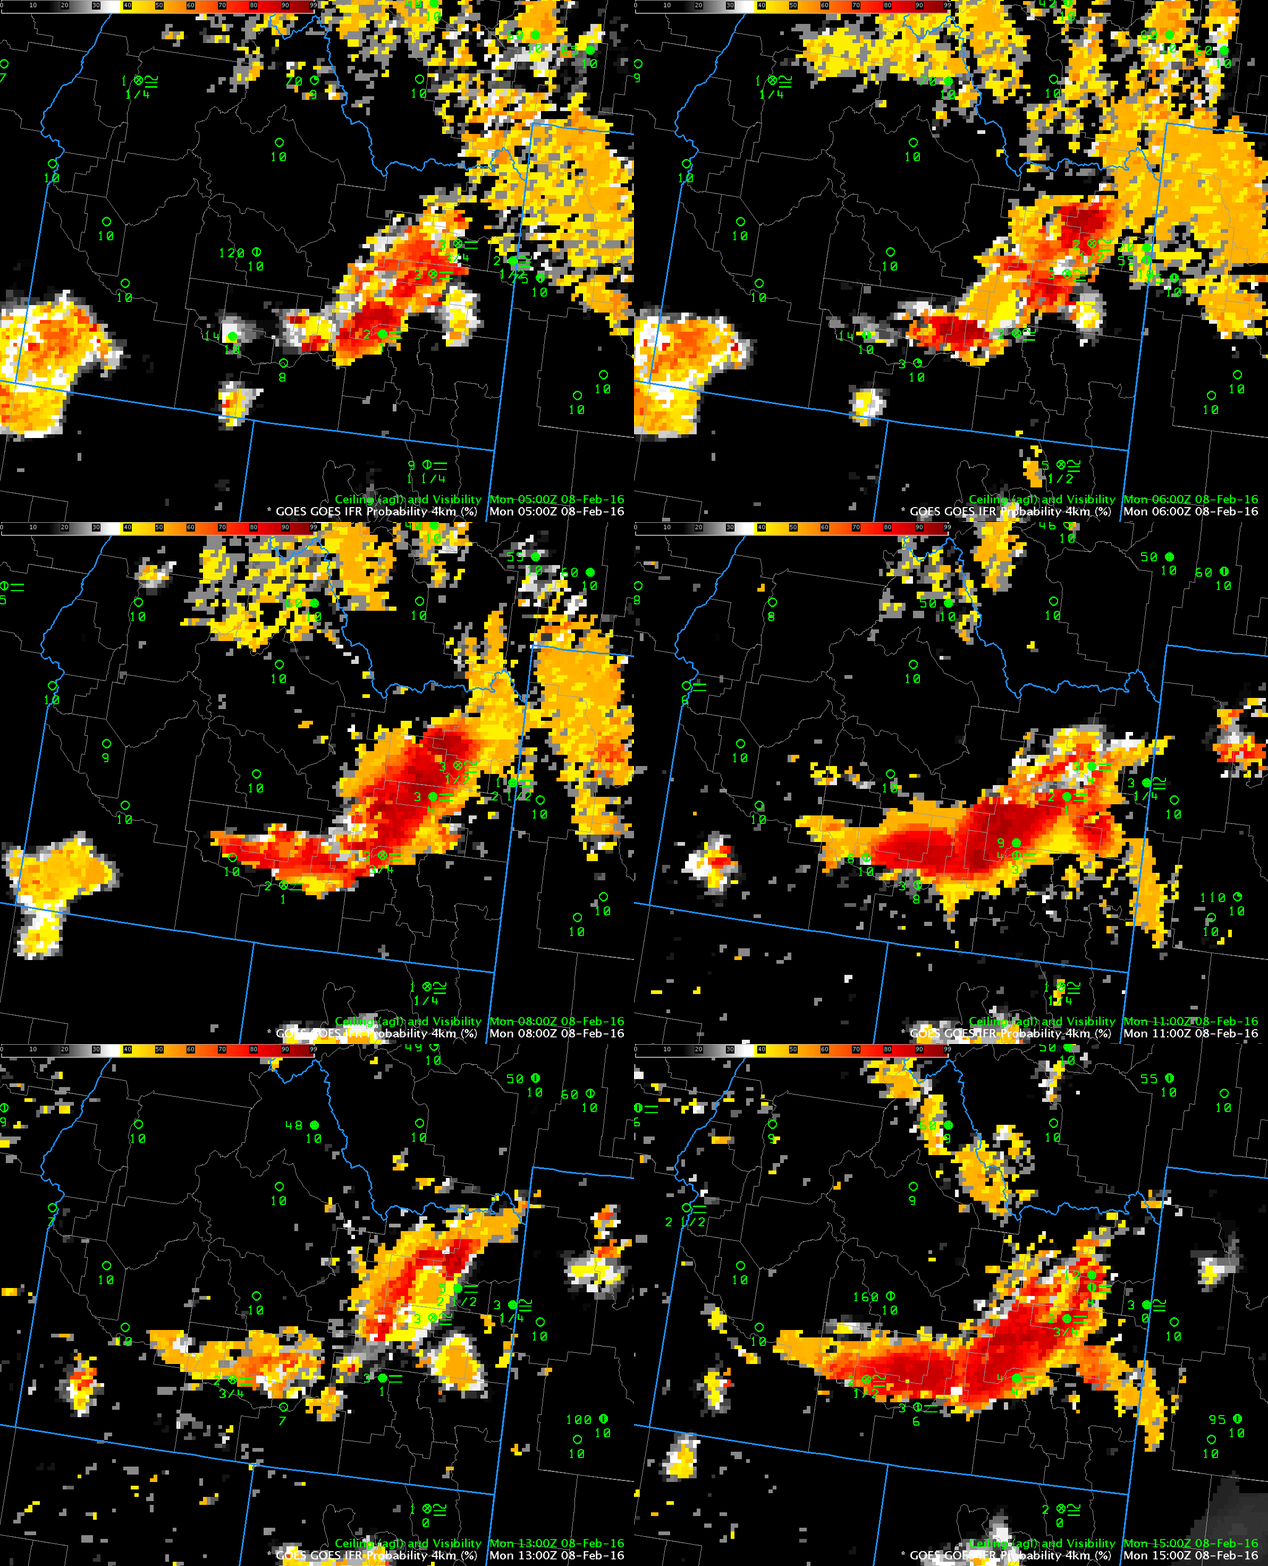
GOES-R IFR Probability, hourly from 0500 through 1500 on 8 February 2016 (Click to enlarge)

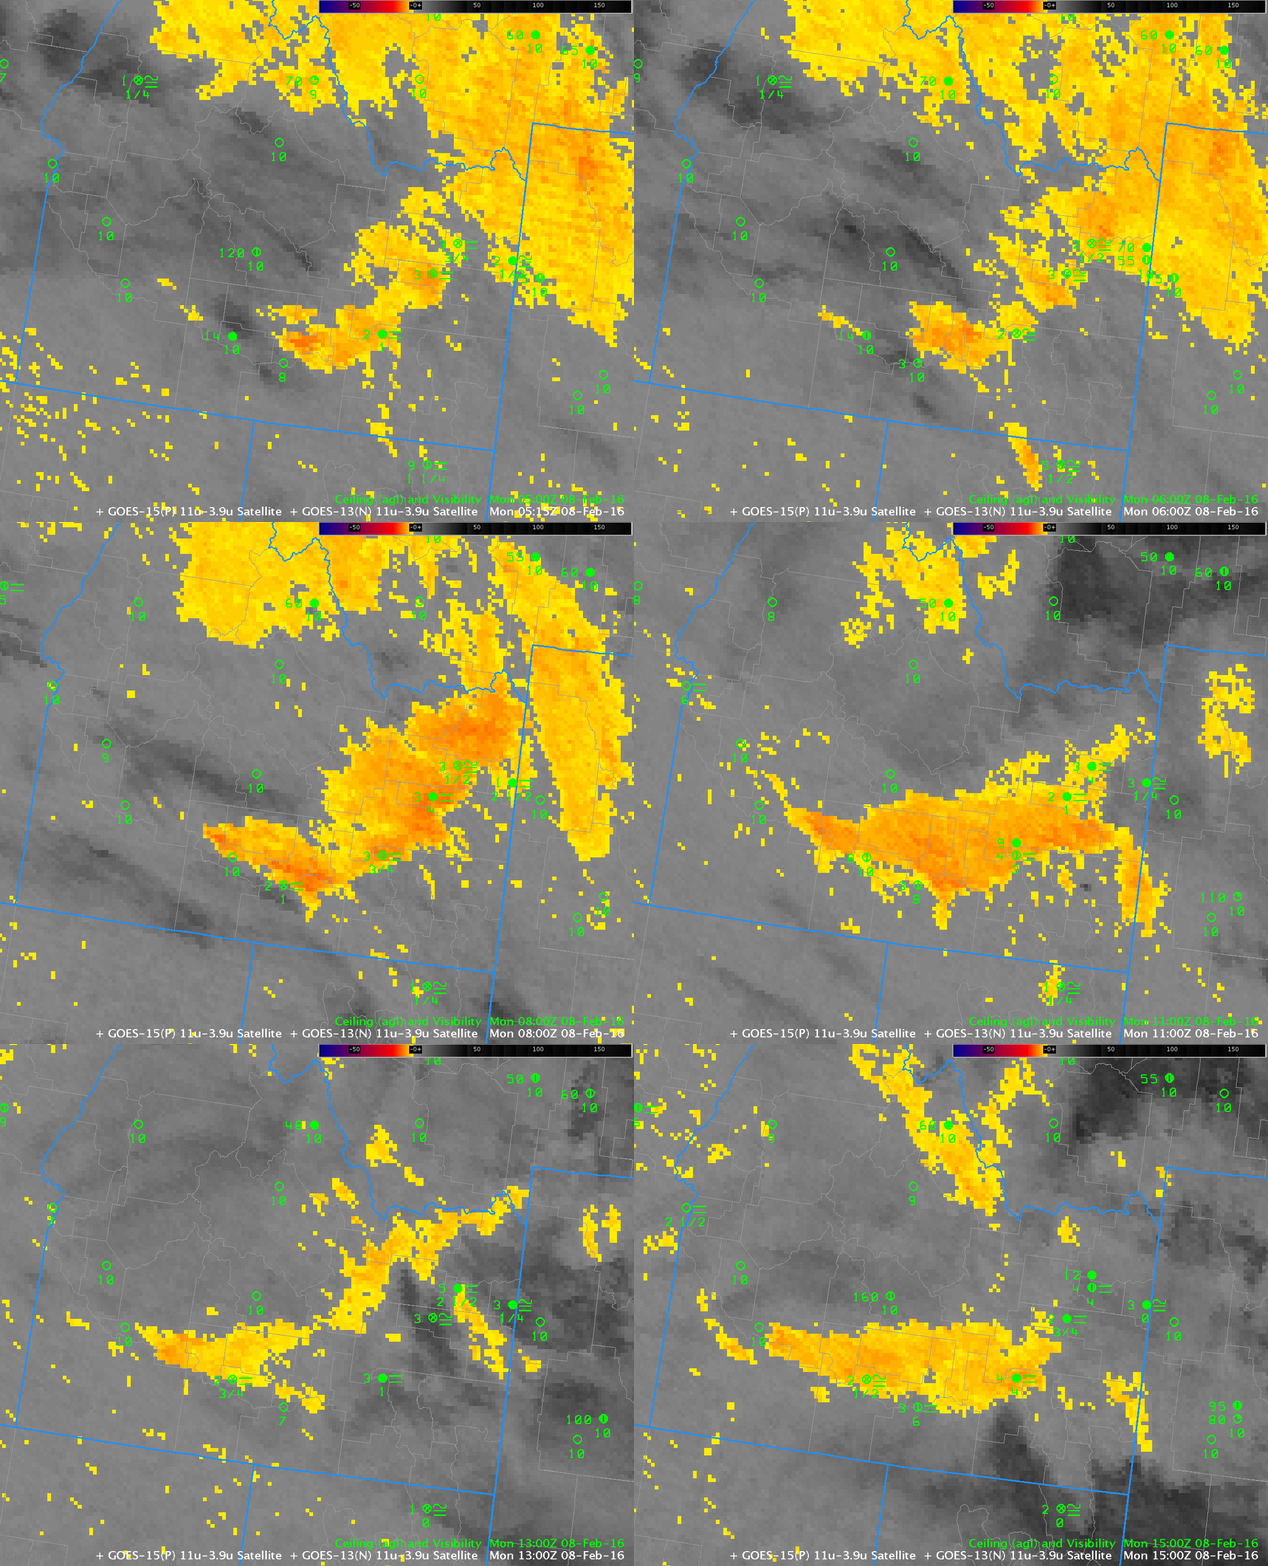
River Valleys will be prone to fog when they are capped by strong High Pressure, as occurred early in the morning on 8 February 2016 over Idaho. The animations, above and below, show GOES-R IFR Probability fields and GOES Brightness Temperature Difference Fields, respectively. GOES-R IFR Probability fields include information from the Rapid Refresh about near-surface saturation. Compare IFR Probabilities at Burley Municipal Airport (KBYI) in Cassia County with those at Jerome County Airport (KJER) between 0800 and 1100 UTC, when visibilities and ceilings at the two airports vary. IFR Probabilities in general are higher when reported ceilings and visibilities are consistent with IFR conditions, and they are lower when IFR conditions are not reported.

Extensive mid-level stratus over the eastern portions of northern Idaho and western Montana have reduced values of IFR Probabilities (compared to the Snake River Valley where IFR Probabilities are large). This is a benefit of a fused product: Information from two sources combined is more powerful than either of the two sources individually. IFR Probability fields also have superior results when mid-level or higher clouds overspread an area. This occurs around 1200-1300 UTC over the northeastern portion of the Snake River Canyon around Rexburg and Idaho Falls, locations that maintain IFR (or near-IFR) conditions although the brightness temperature difference field has little signal. IFR Probabilities remain enhanced in the region, however, with a signal — a less pixelated, flatter field — that suggests only Rapid Refresh Data are being used as predictors of IFR.

BTD-0500_1500anim_08feb2016

GOES Brightness Temperature Difference (10.7µm – 3.9µm), hourly from 0500 through 1500 on 8 February 2016 (Click to enlarge)

Dense Fog Advisories in southern Idaho

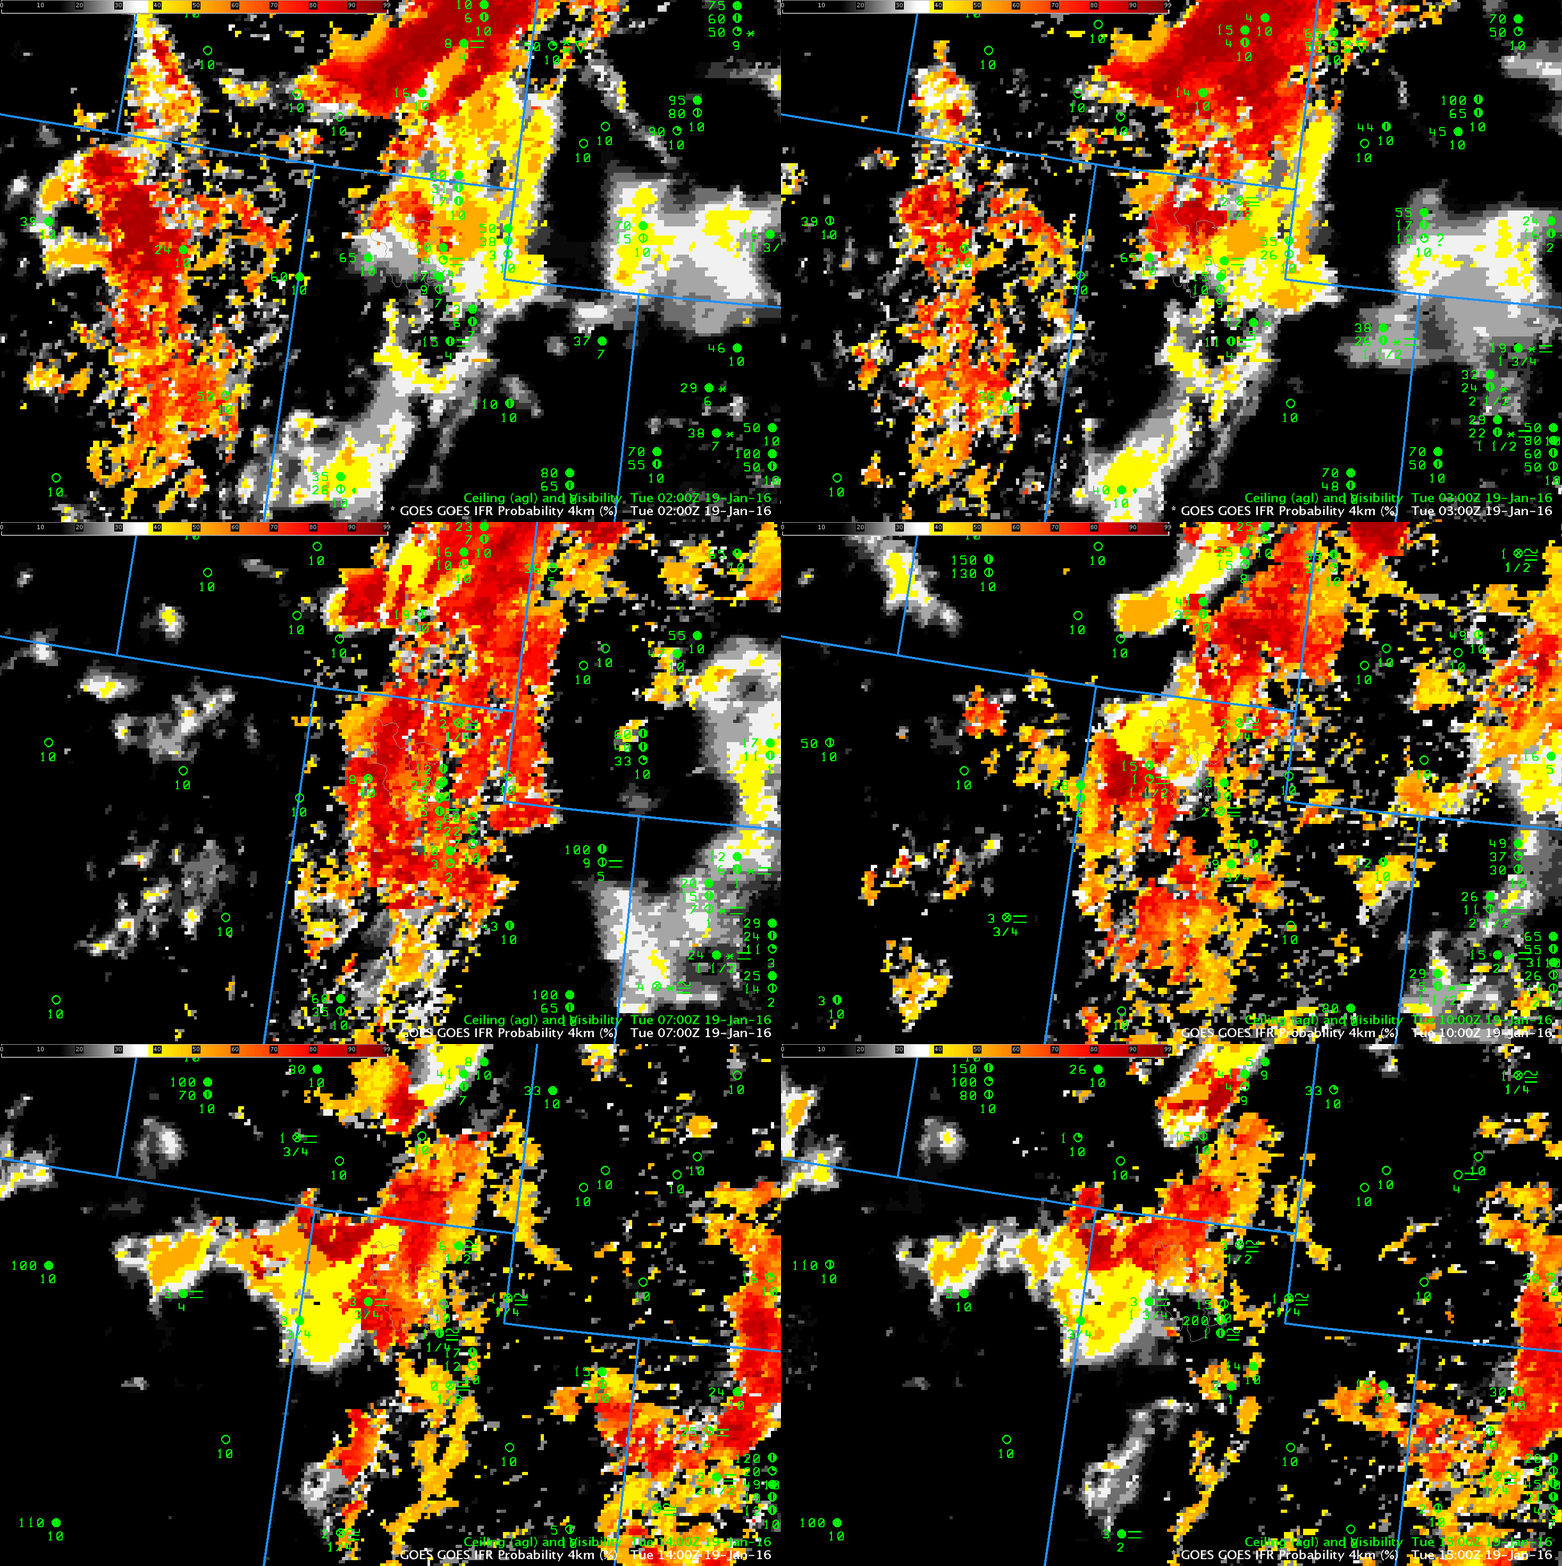
Dense Fog Advisories were issued over southern Idaho early on 19 January 2016. GOES-R IFR Probability fields, below, show high probabilities in this region. Surface observations are not common over northern Utah/southern Idaho, and the hourly animation does show IFR Conditions observed near the high IFR Probabilities over southern Idaho and northern Utah (Logan, UT — KLGU — at 41:47 N, 111:51 W, in far northern Utah from 0300 – 1300 UTC; Elko NV — KEKO — at 40:50 N, 115:47 W also shows IFR conditions).  The Snake River Valley in Idaho also shows high IFR Probabilities during parts of the animation.

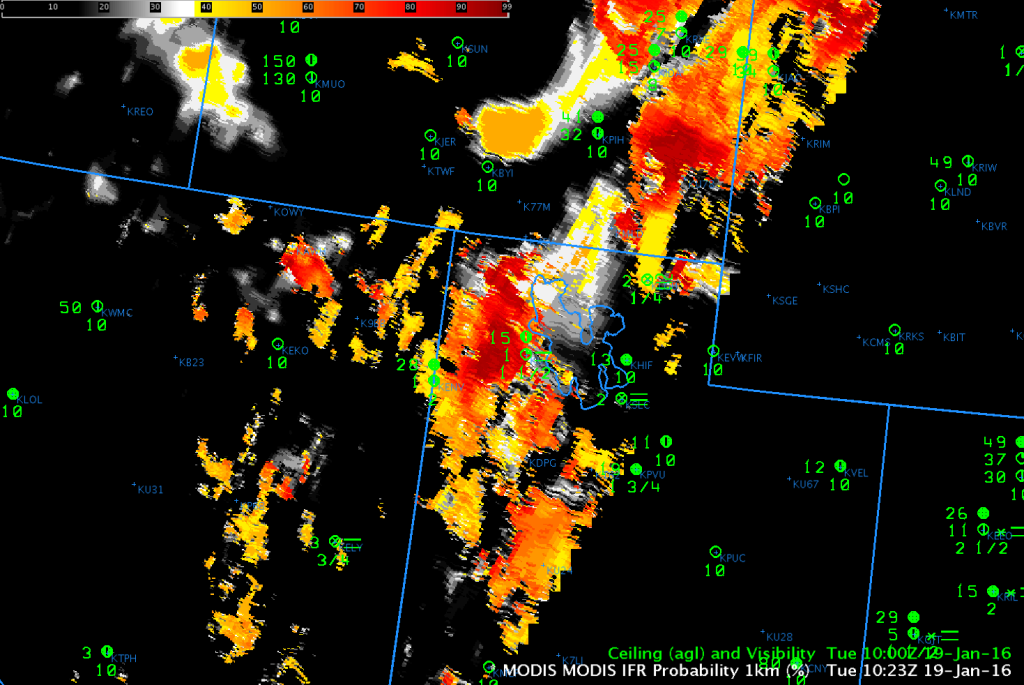
GOES-R IFR Probability fields fuse together information from GOES-15 (or, in the eastern part of the USA, GOES-13) and Rapid Refresh Data. Highest probabilities occur where the satellite detects low (water-based) clouds and where the Rapid Refresh Model predicts low-level saturation. High IFR Probabilities don’t necessarily guarantee the presence of IFR Conditions — but they are a flag that should prompt a forecaster to be alert to the possibility that IFR conditions are present nearby or are developing. When dense fog is valley-based as might happen in the Rocky Mountains, GOES Pixel footprints and Rapid Refresh model resolution are sometimes too coarse to resolve completely the fog. MODIS data (bottom) has 1-km horizontal resolution and IFR Probabilities computed from MODIS data are more likely to resolve small valleys.

IFR_P_IdahoUtah_19January_anim_0200_1500

GOES-R IFR Probability fields computed from Rapid Refresh Model Output and GOES-15 Satellite Data, hourly from 0200 – 1500 UTC, 19 January 2016 (Click to enlarge)

MODISIFR_1023UTC_19Jan

GOES-R IFR Probability computed from MODIS data and Rapid Refresh Model output, 1023 UTC 19 January 2016 (Click to enlarge)
Lead Time with GOES-R IFR Probabilities and Brightness Temperature Difference

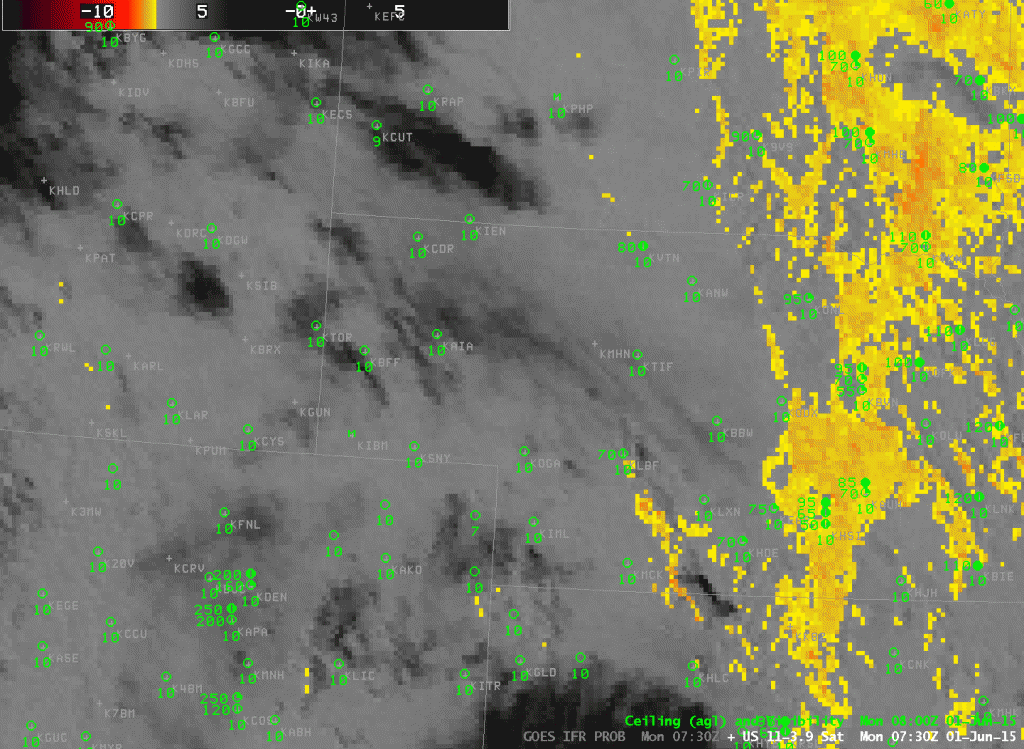
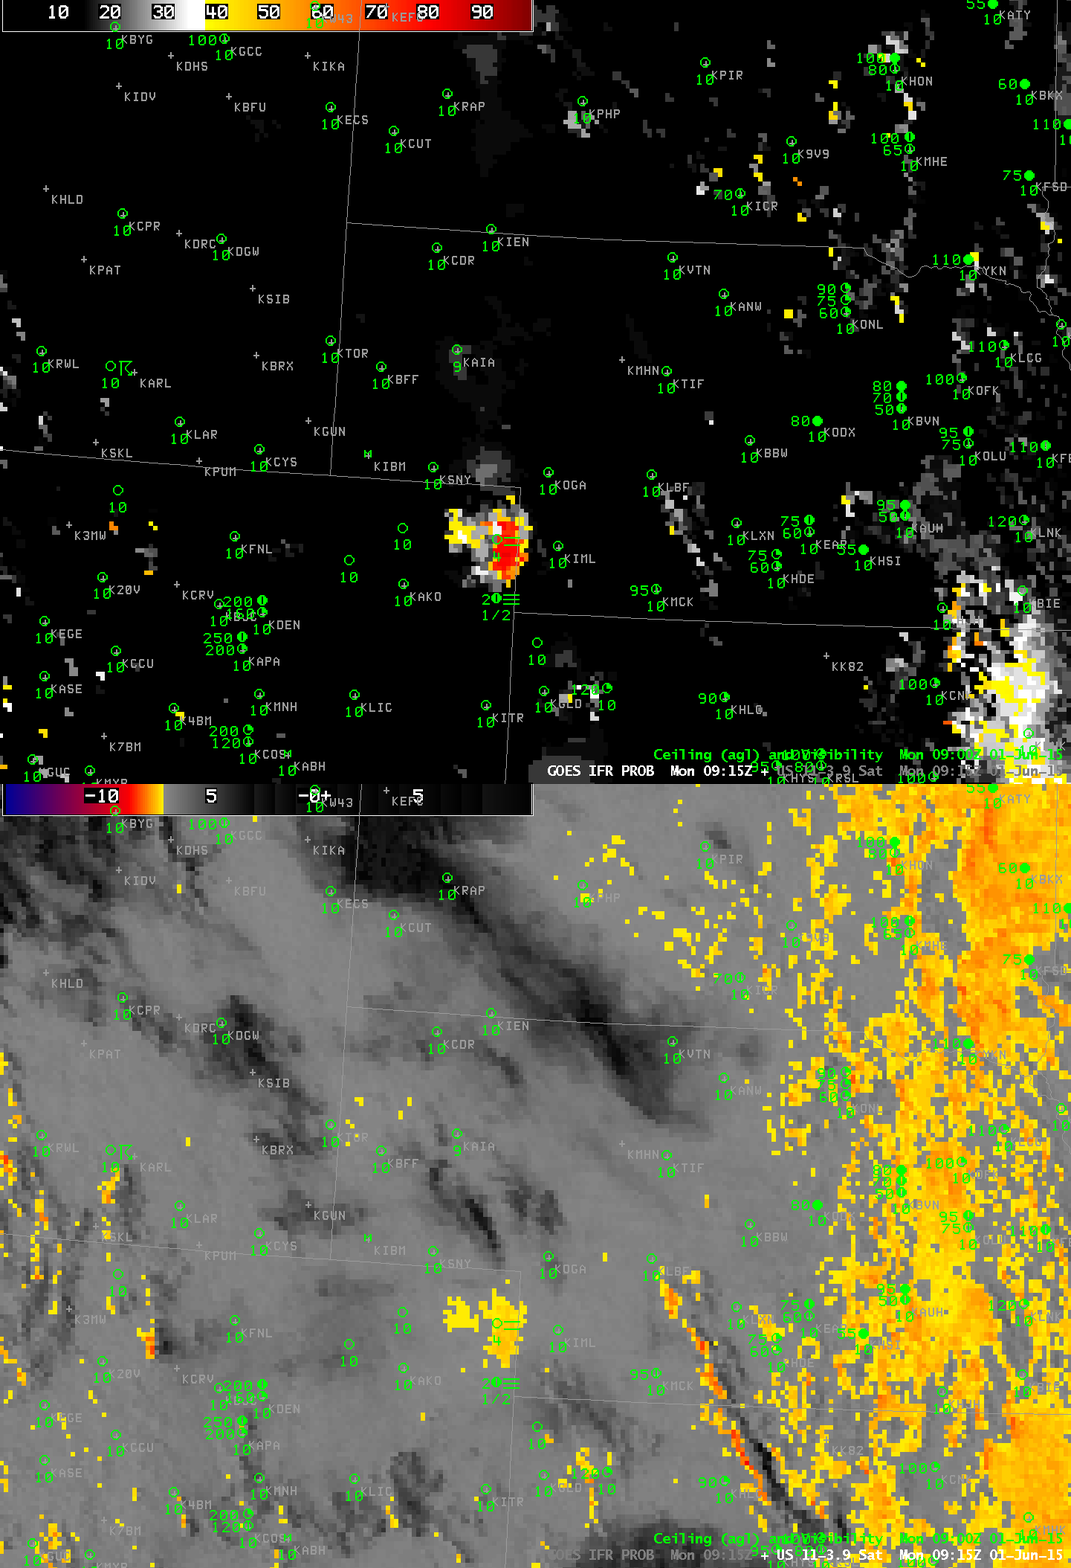
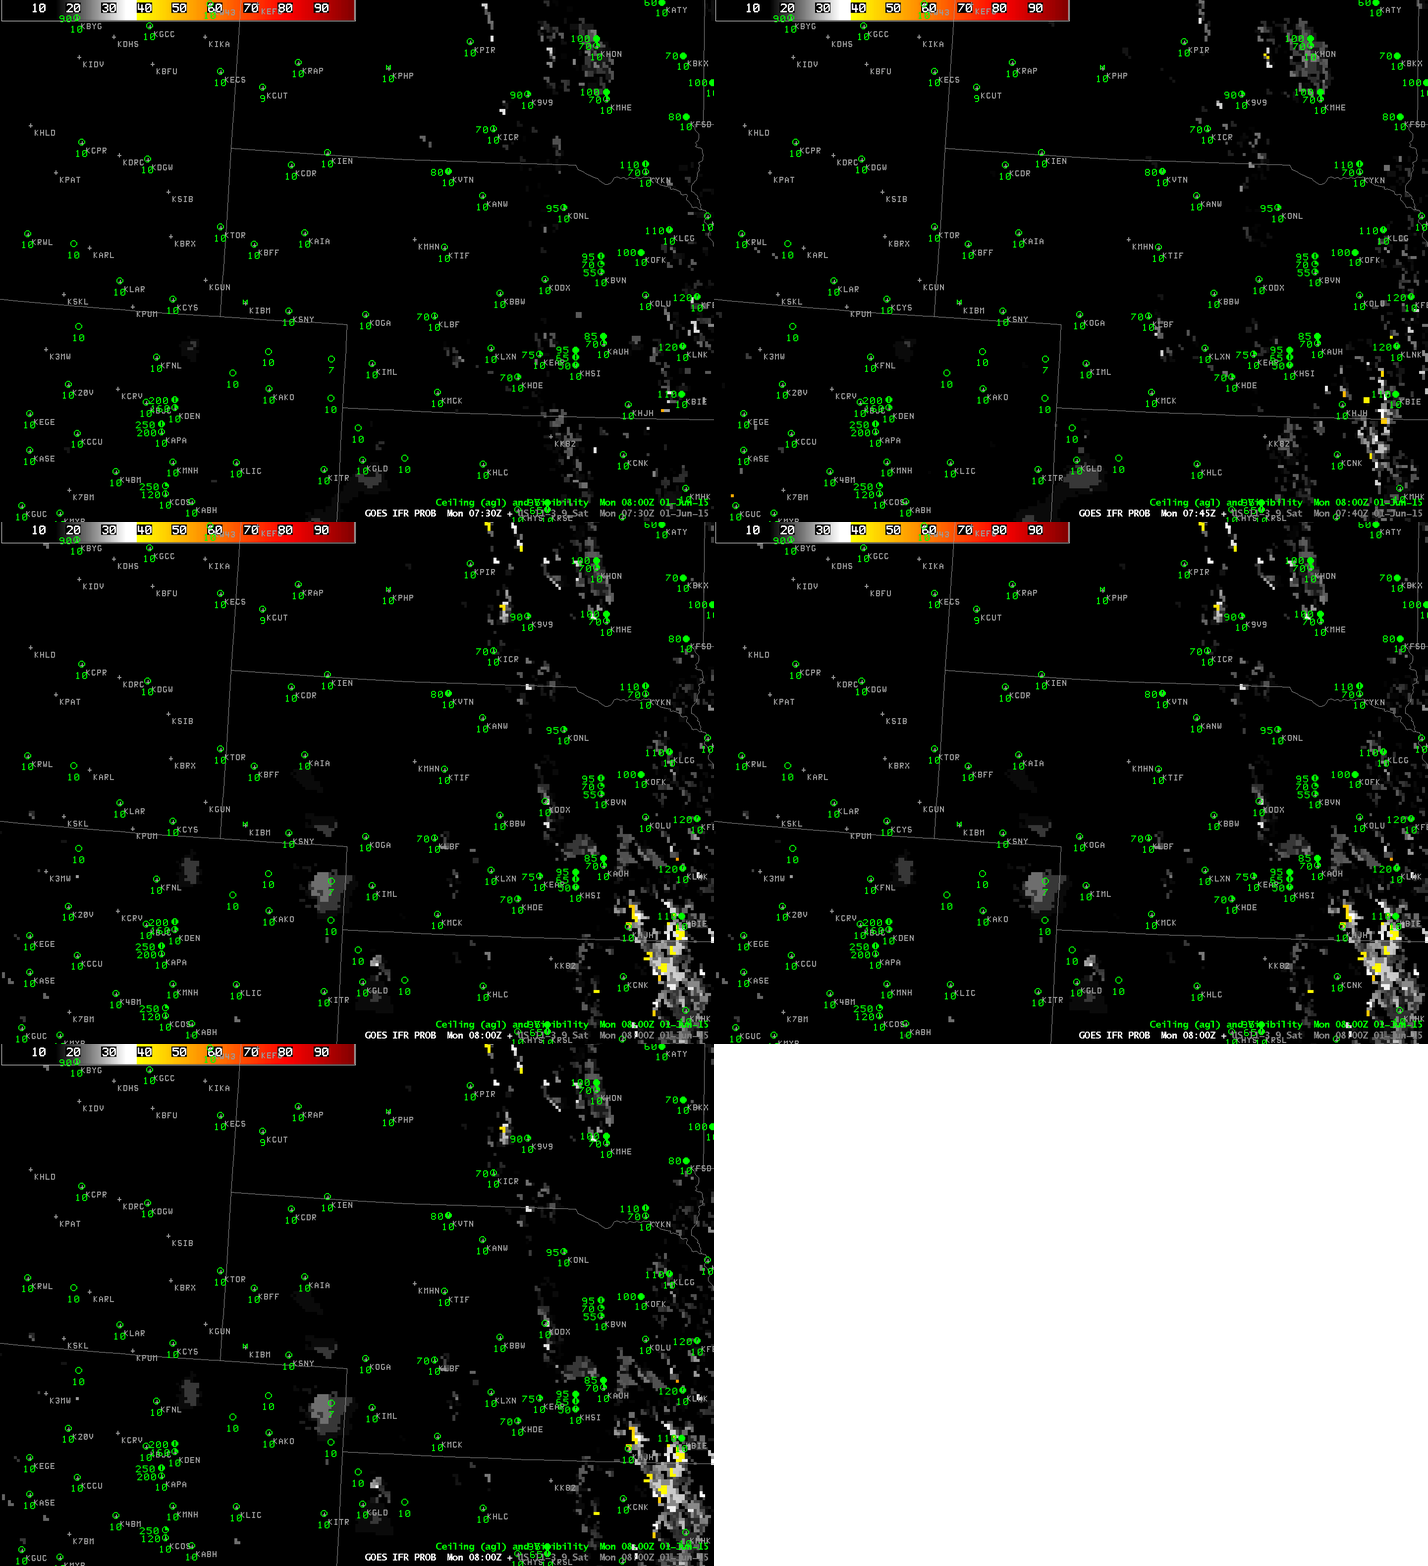
A small region of dense fog developed over northeast Colorado and western Nebraska during the early morning on June 1st 2015. How did the GOES-R and traditional products handle this event? The animation below shows IFR Probabilities from 0730-0800 UTC on 1 June. Probabilities jump from <10% to about 20% at 0800 UTC in a region centered on Holyoke, CO, just south of I-76 in northeast Colorado. The Brightness Temperature Difference Field for the same 3 times, below the IFR Probabilities, shows a signal moving over the region but not substantially changing. (From this, one could conclude that the Rapid Refresh model data might be driving increase in the IFR Probability field)

GOES_IFR_PROB_20150601_0730_0800

GOES-R IFR Probabilities, 0730-0800 UTC on 1 June (Click to enlarge)

US_11-3.9_Sat_20150601_0730_0800

GOES-East Brightness Temperature Difference fields (10.7 µm – 3.9 µm) at 0730, 0745 and 0800 UTC, 1 June 2015 (Click to enlarge)
GOES_IFR_11-3.9_Sat_20150601_0915toggle

Toggle between GOES-R IFR Probabilities and GOES-East Brightness Temperature Difference Fields, 0915 UTC on 1 June (Click to enlarge)
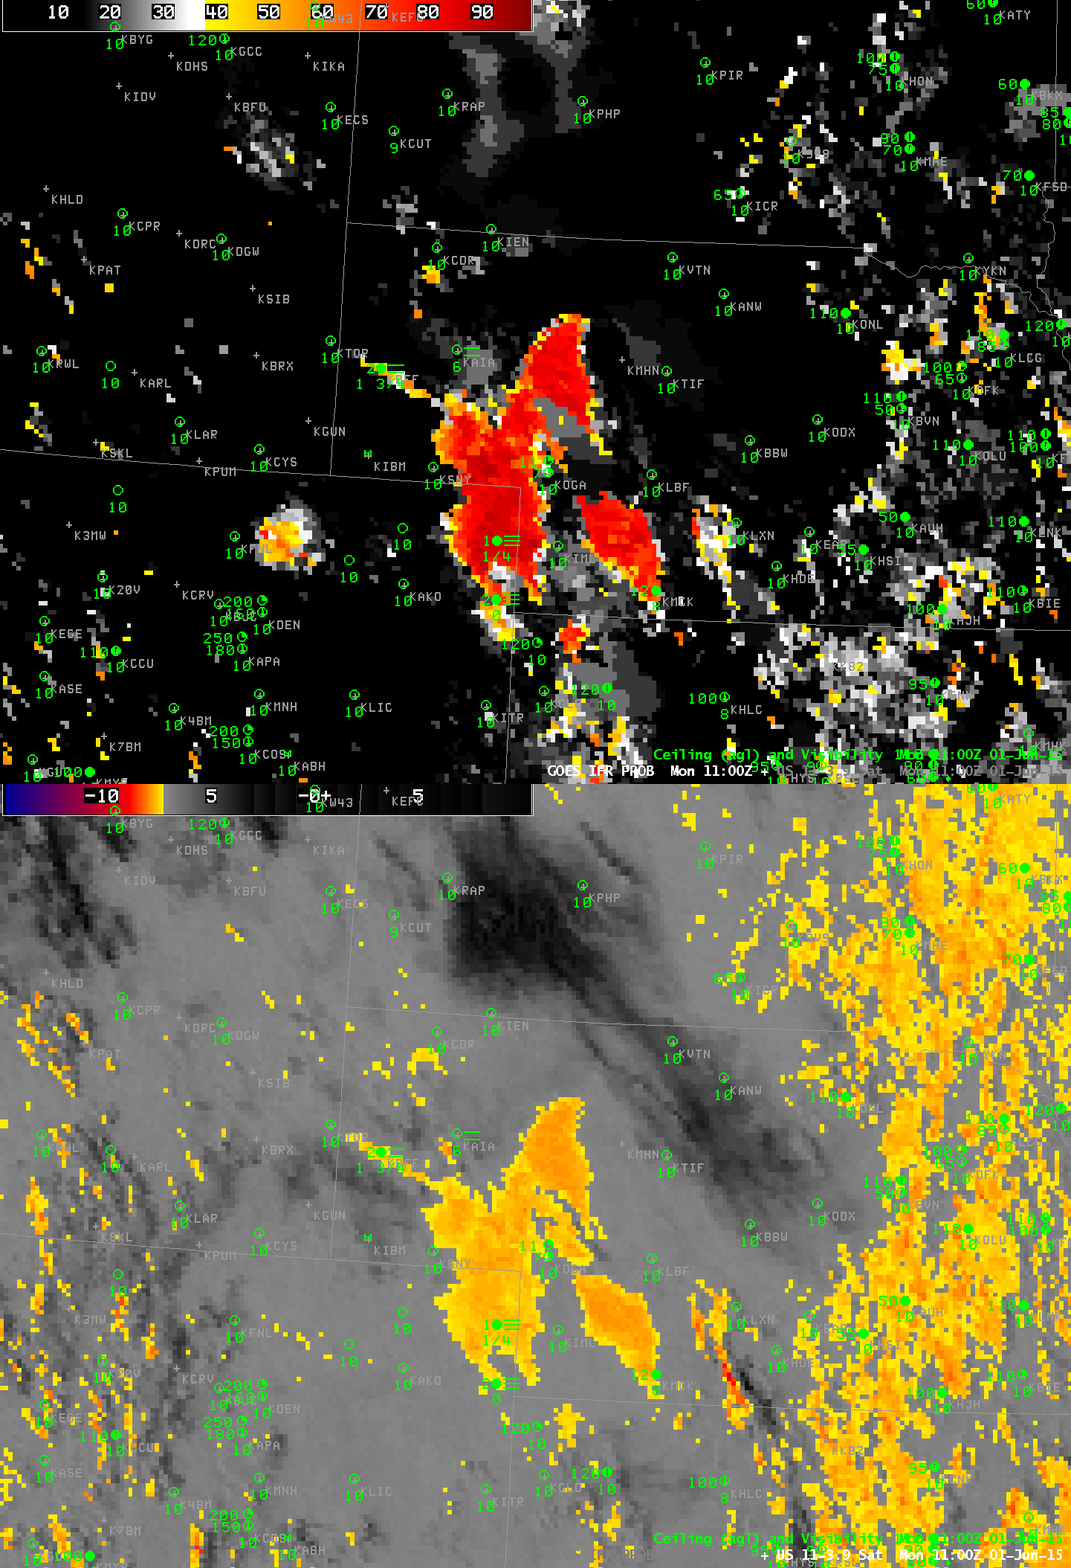
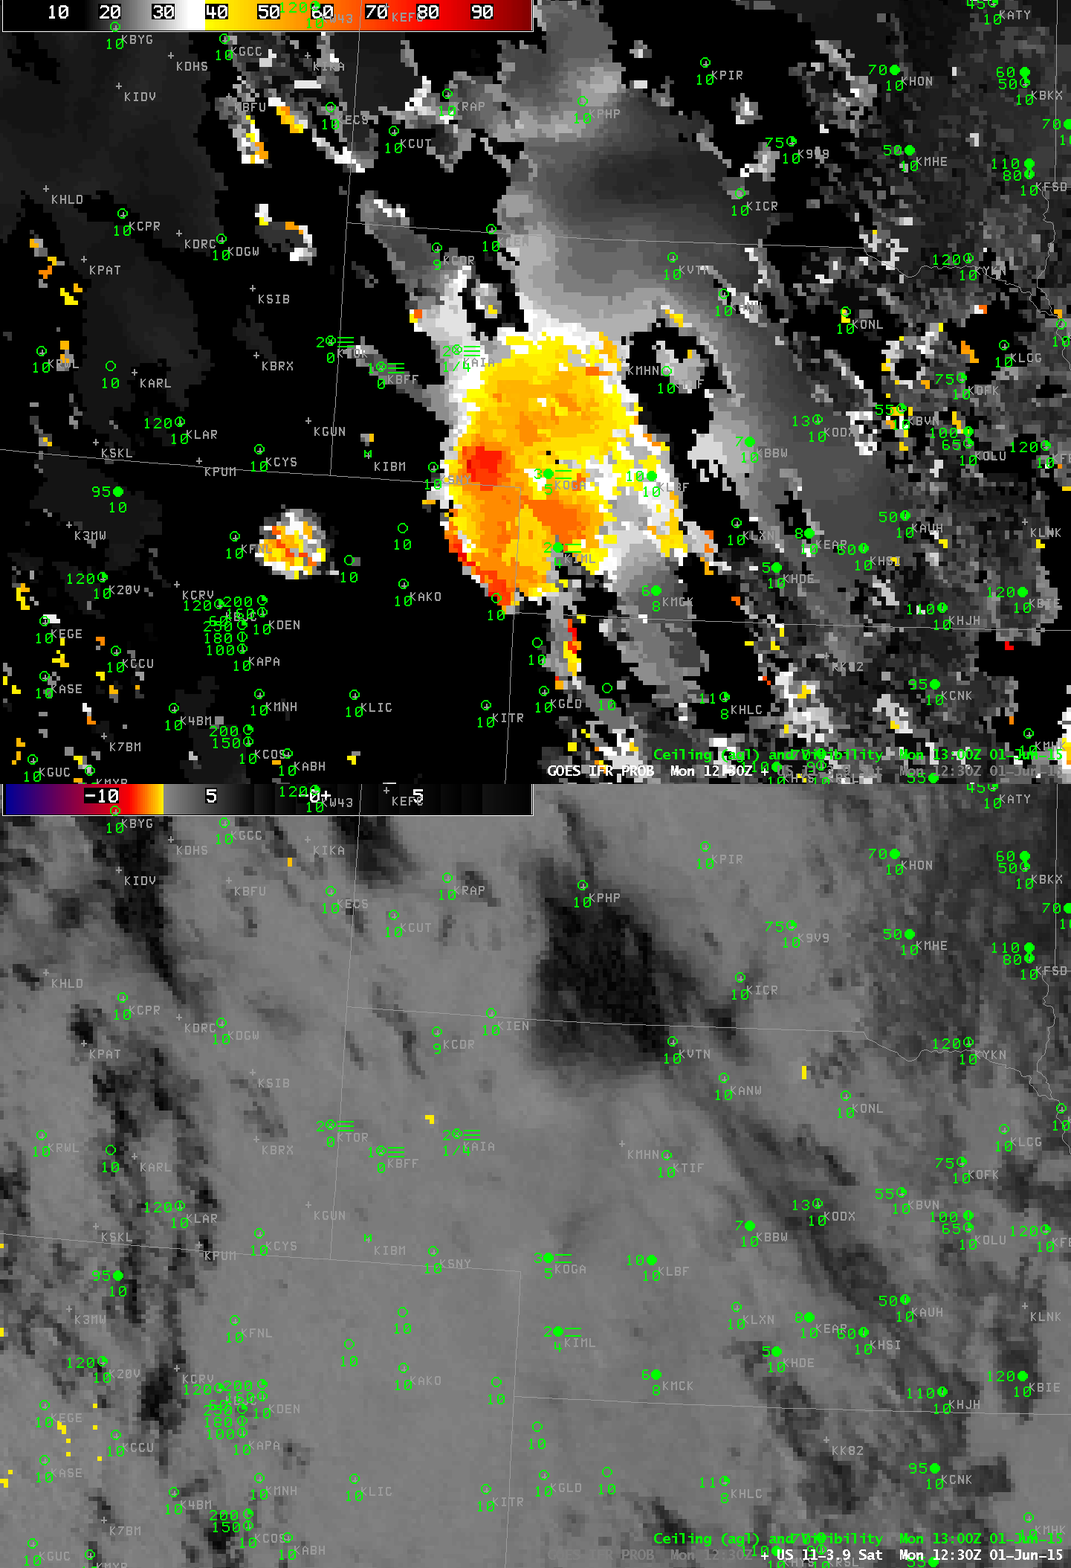
By 0915 UTC (above), IFR Probabilities and GOES-13 Brightness Temperature Difference fields show a strong signal over NE Colorado where IFR Conditions occur/are developing. IFR Probability fields have provided more lead-time in the development of this region of low ceilings and visibilities. By 1100 UTC (below), a stronger, more widespread signal is apparent in both fields. At 1230 UTC (bottom), the rising sun has altered the brightness temperature field so it gives no useful information on low clouds; this highlights an advantage of GOES-R IFR Probability fields: A consistent signal through sunrise.

GOES_IFR_11-3.9_Sat_20150601_1100toggle

Toggle between GOES-R IFR Probabilities and GOES-East Brightness Temperature Difference Fields, 1100 UTC on 1 June (Click to enlarge)
GOES_IFR_11-3.9_Sat_20150601_1230toggle

Toggle between GOES-R IFR Probabilities and GOES-East Brightness Temperature Difference Fields, 1230 UTC on 1 June (Click to enlarge)
Use moving IFR Probability Fields as a forecast aid

Denver_IFR_02_13_07Apr2015

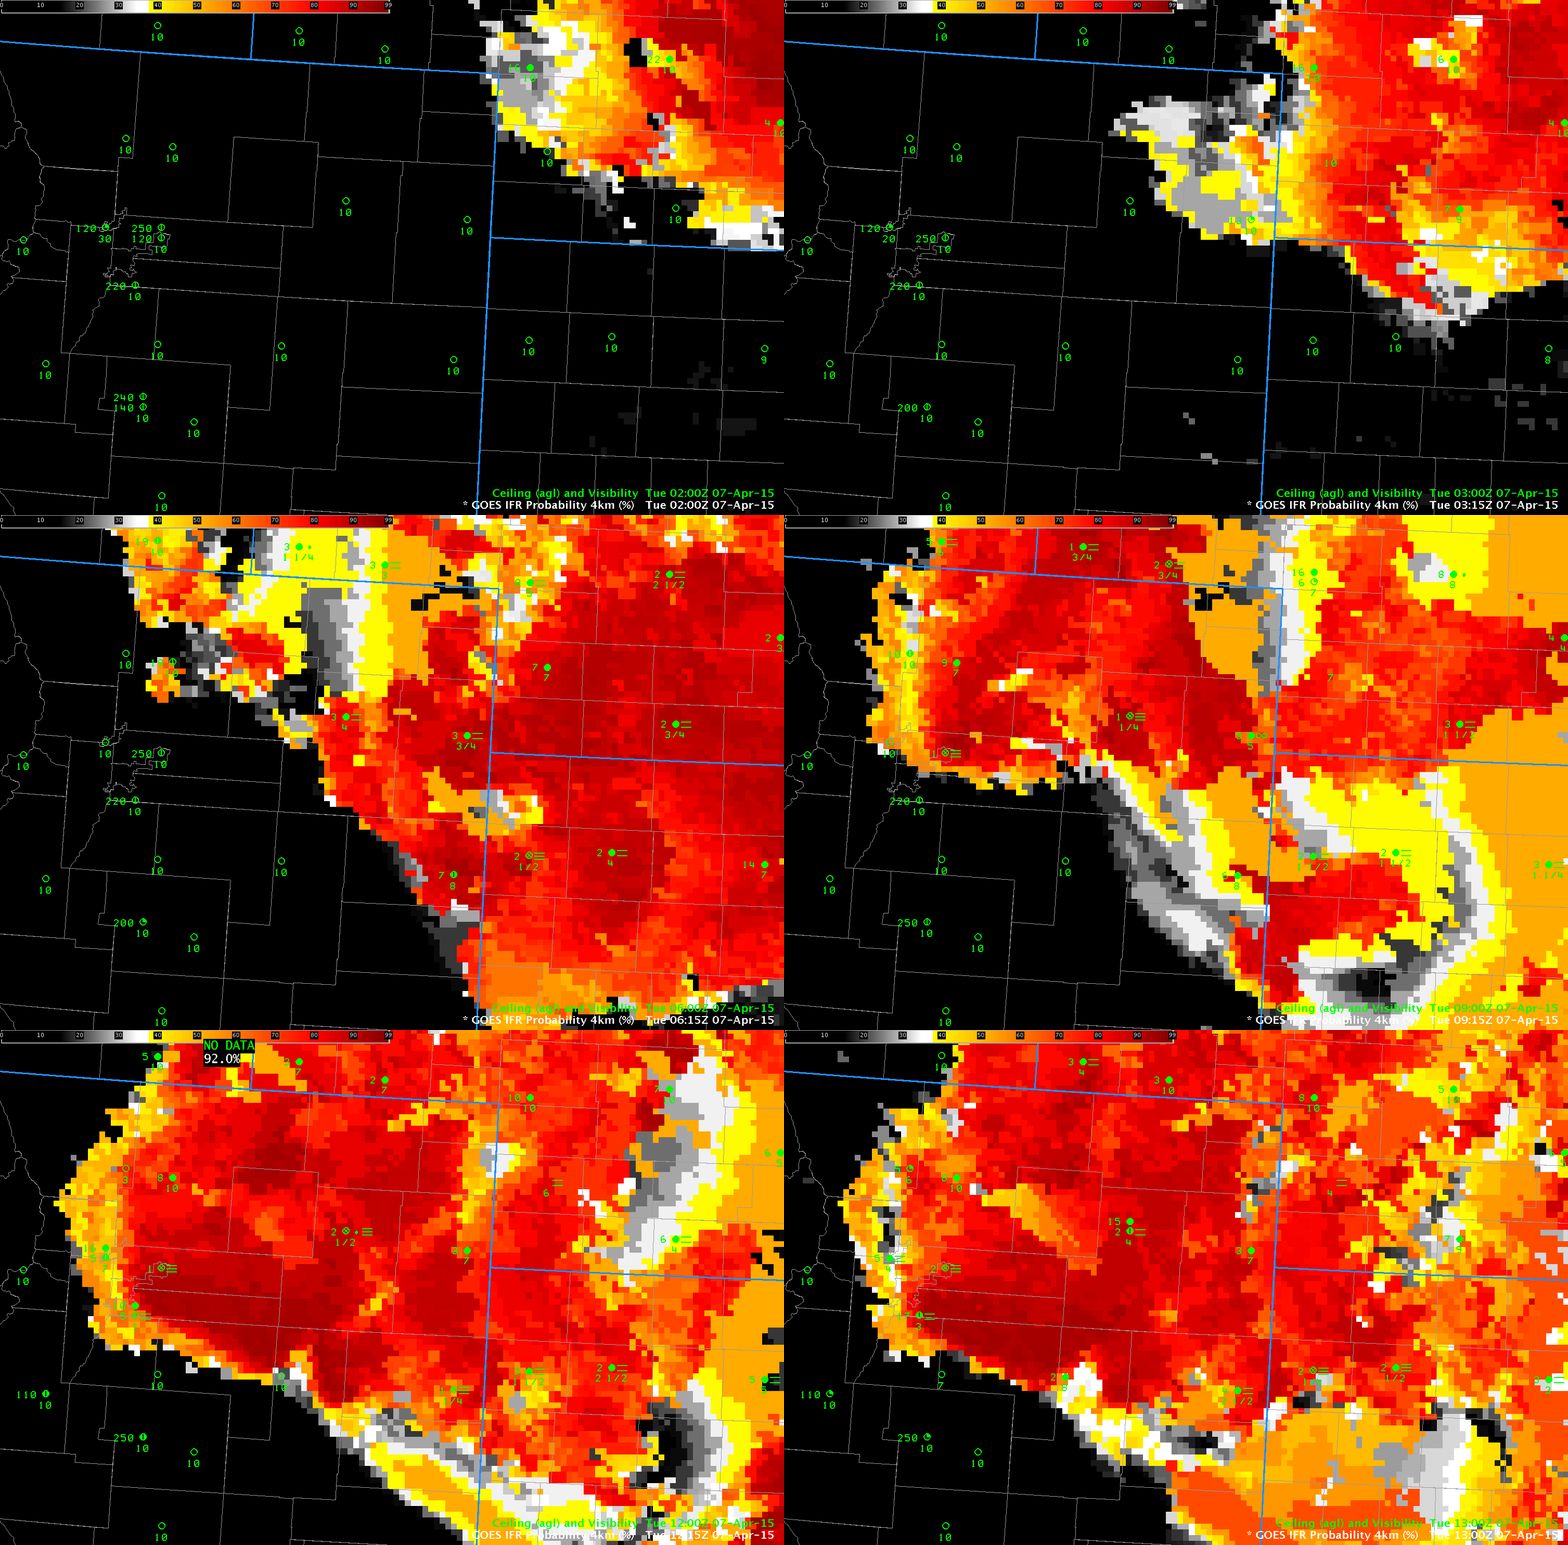
GOES-R IFR Probabilities, hourly from 0200 through 1300 UTC on 7 April 2015 (Click to enlarge)
Denver International Airport had a period of restricted visibility during the morning of 7 April, starting around 0830 UTC, when northeast winds ushered in low ceilings and reduced visibilities. High Probabilities in the IFR Probability fields shift west and south with time, demonstrating how the fields can be used to anticipate the development of IFR conditions.