Category Archives: Plains

IFR Conditions with a Spring storm over the central United States

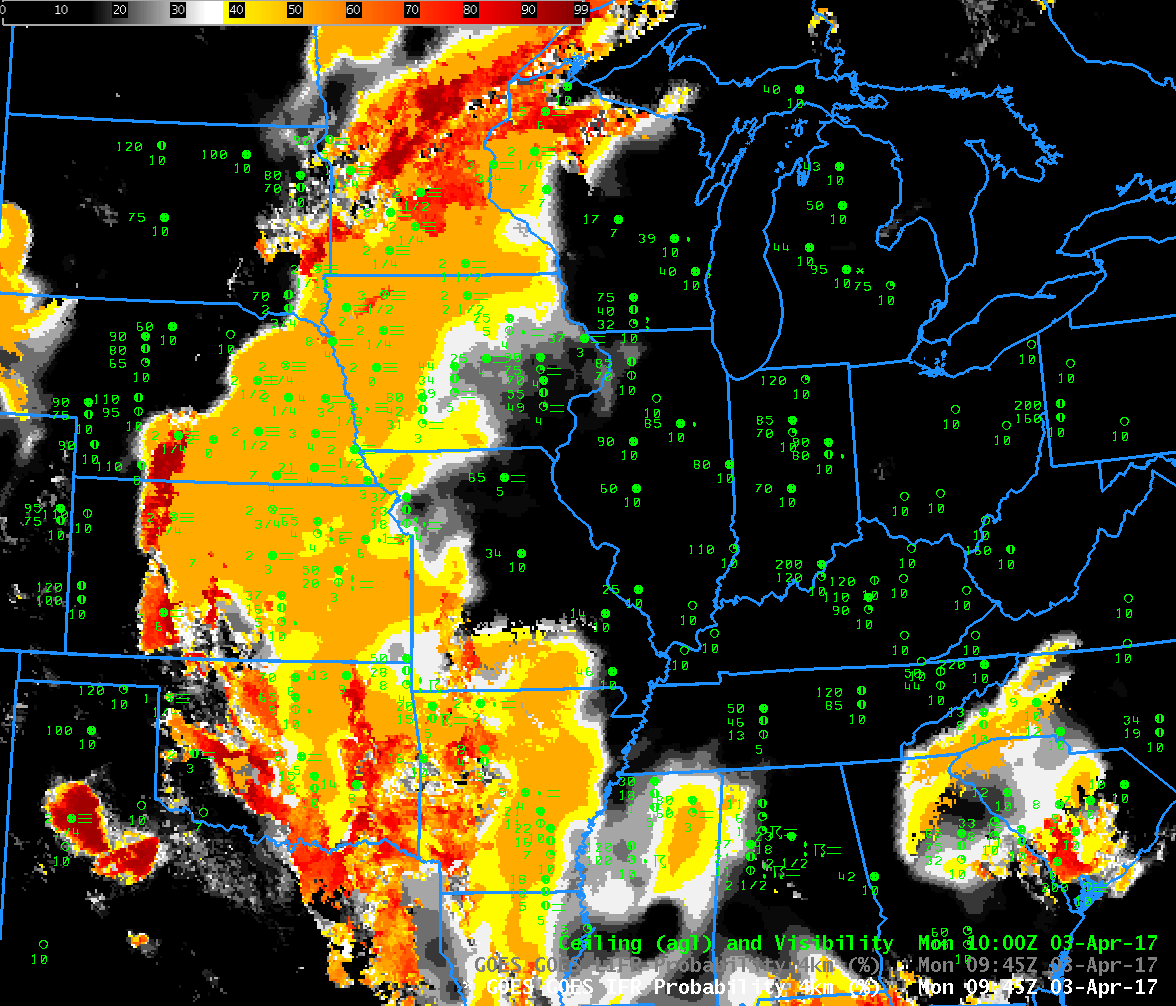
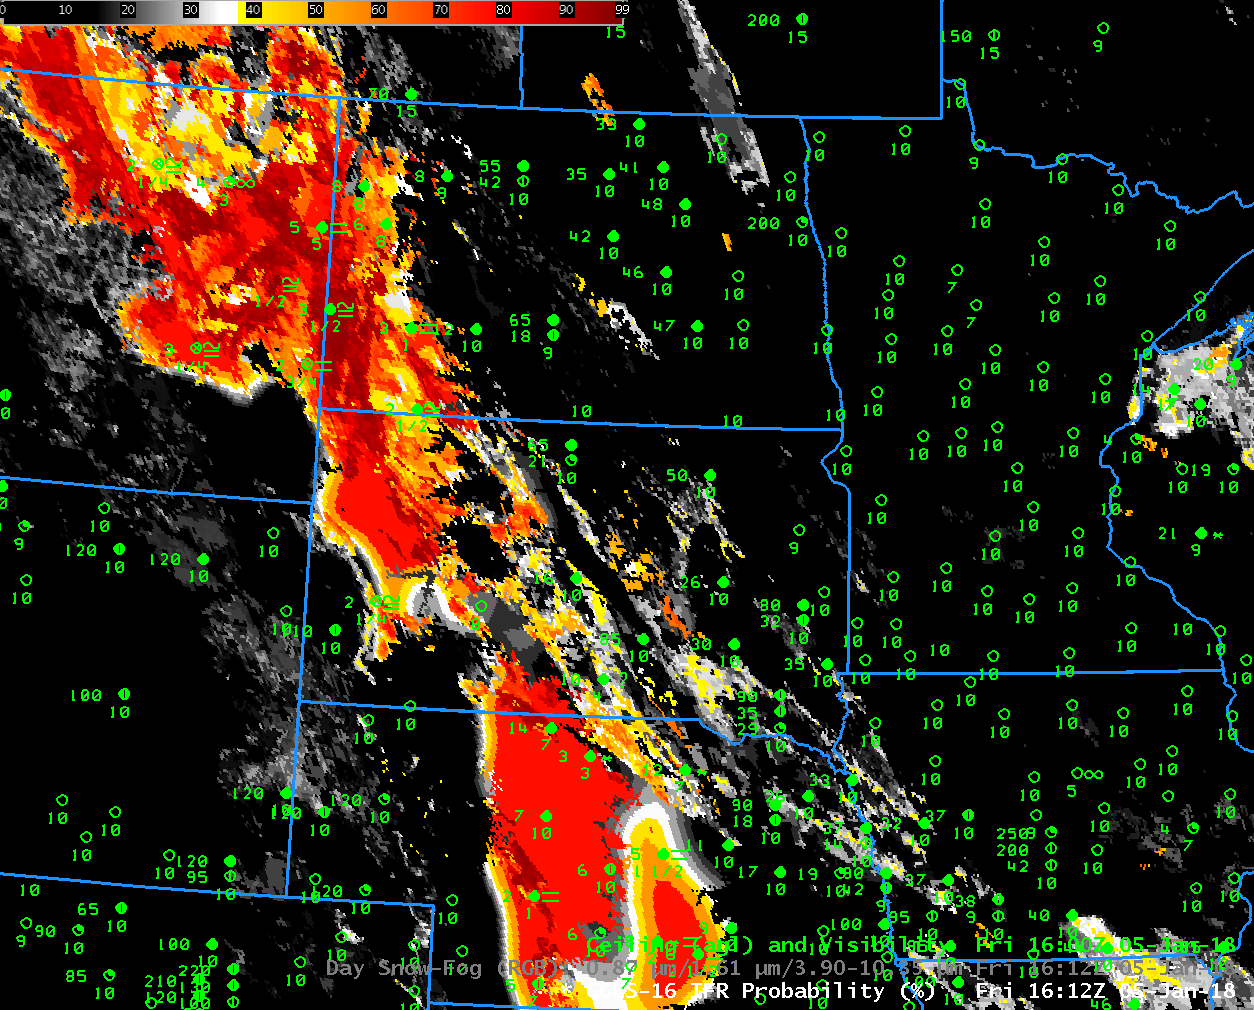
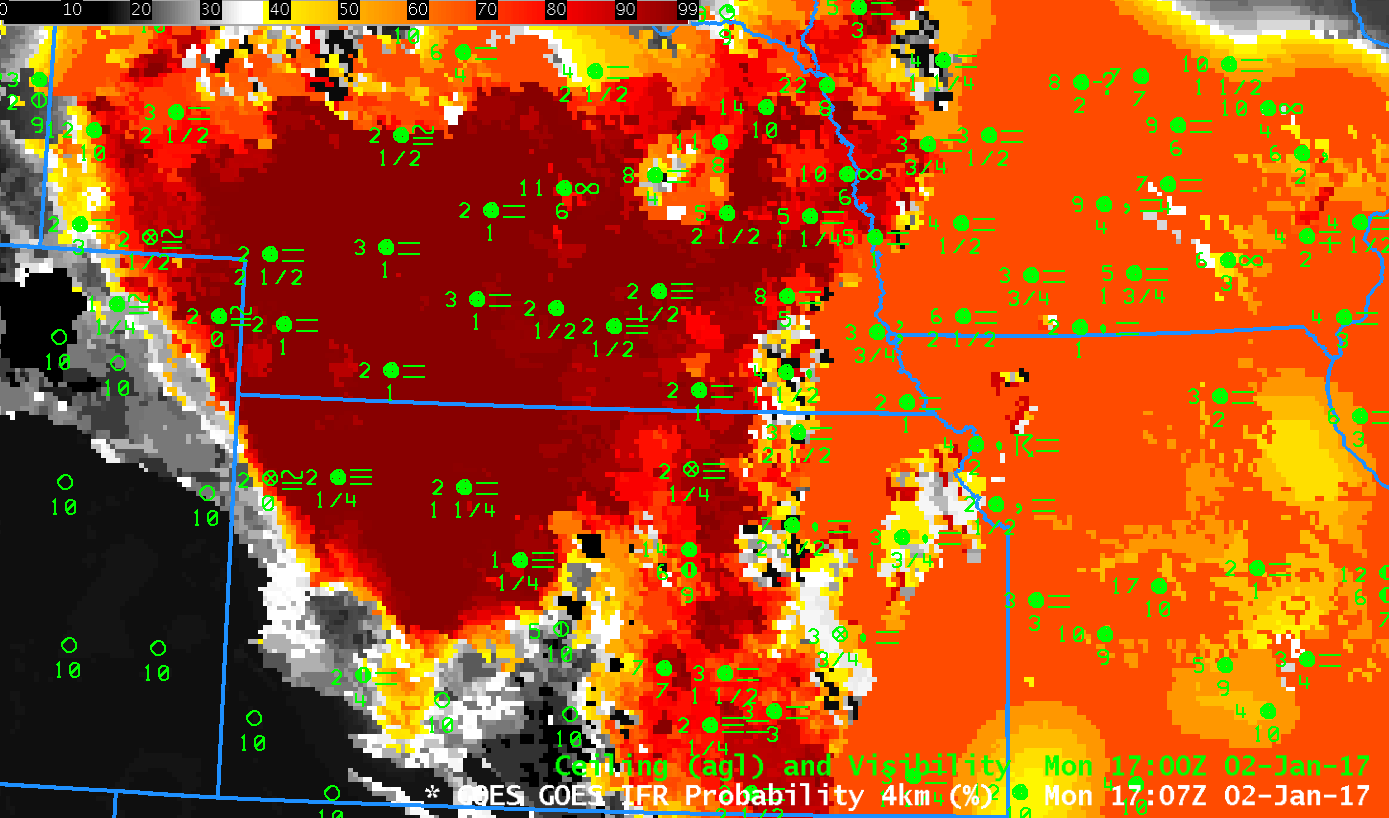
GOES-16 IFR Probability fields, every 10 minutes, from 0202 through 1412 UTC on 19 March 2018 (Click to animate)

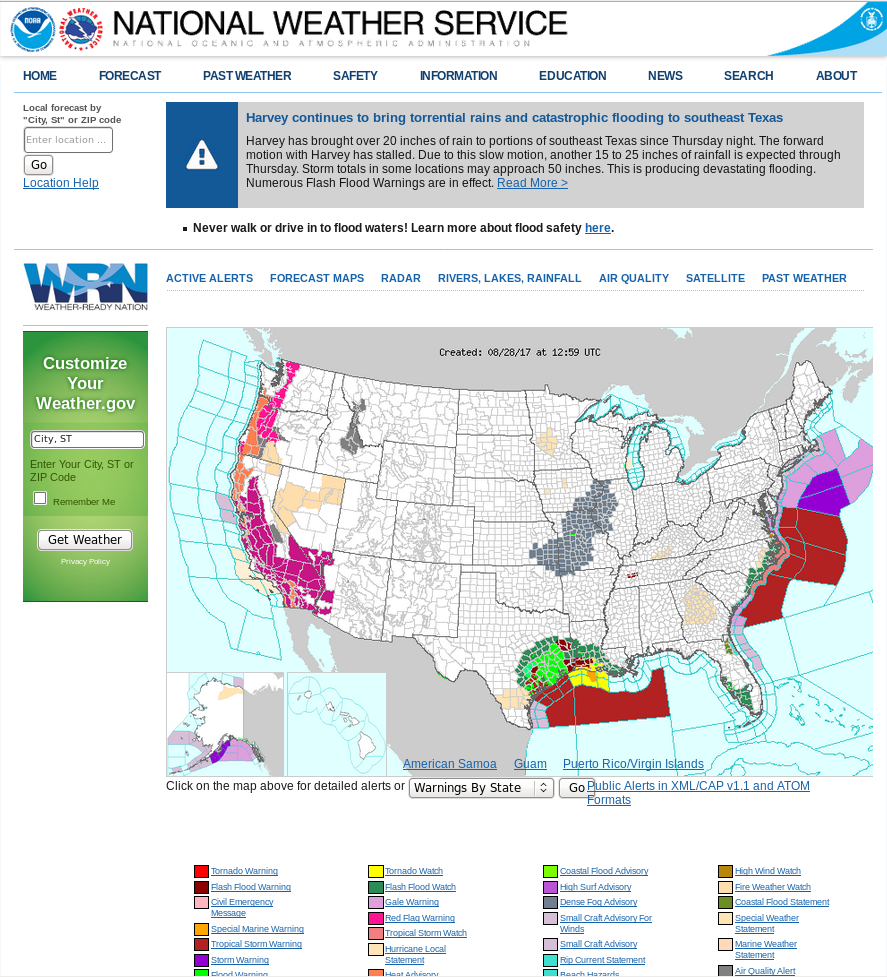
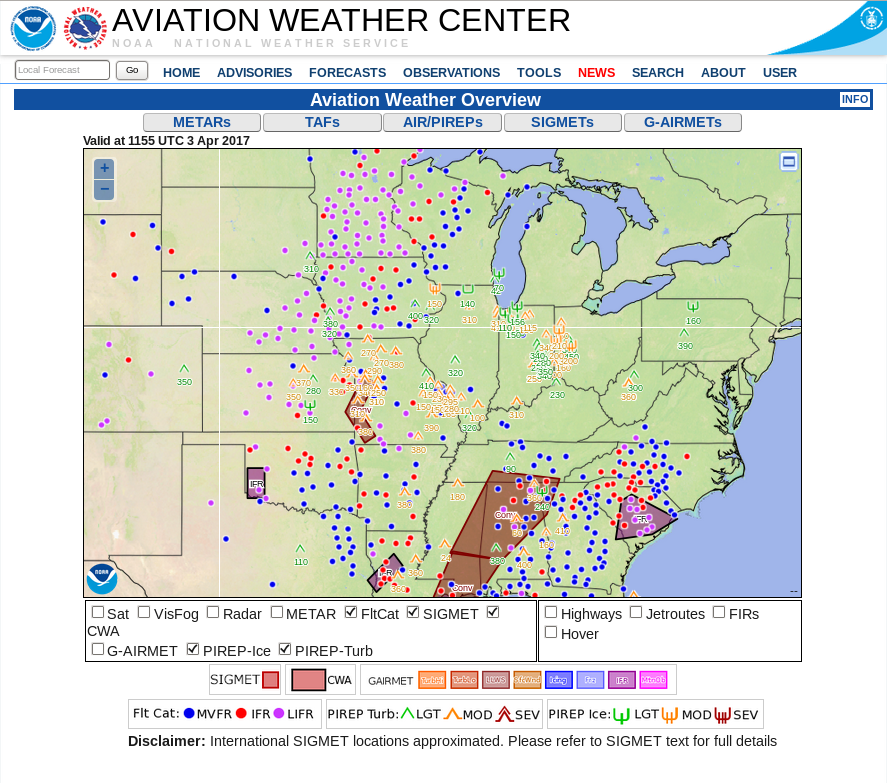
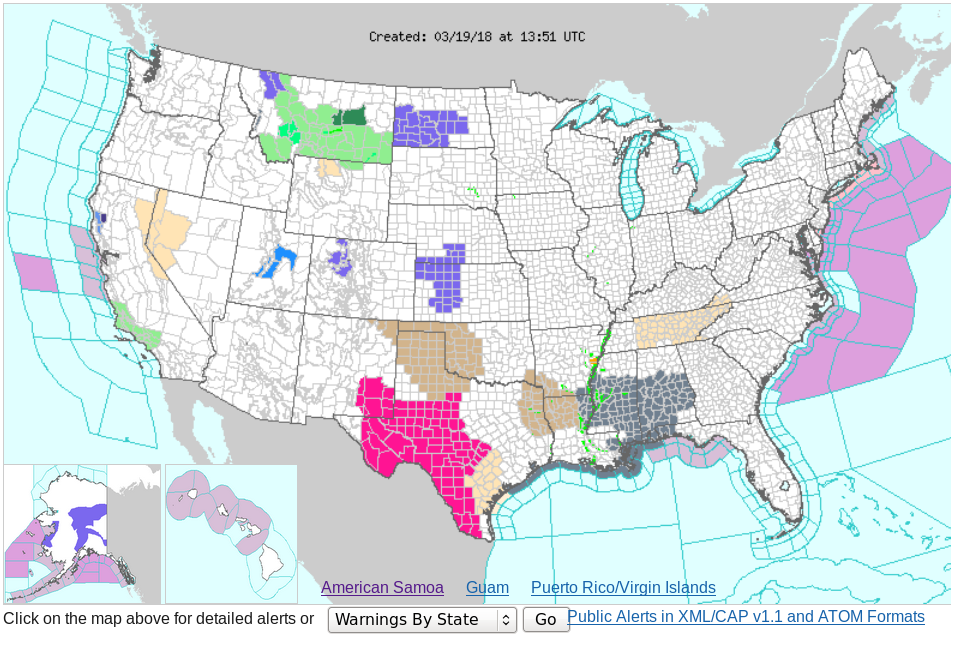
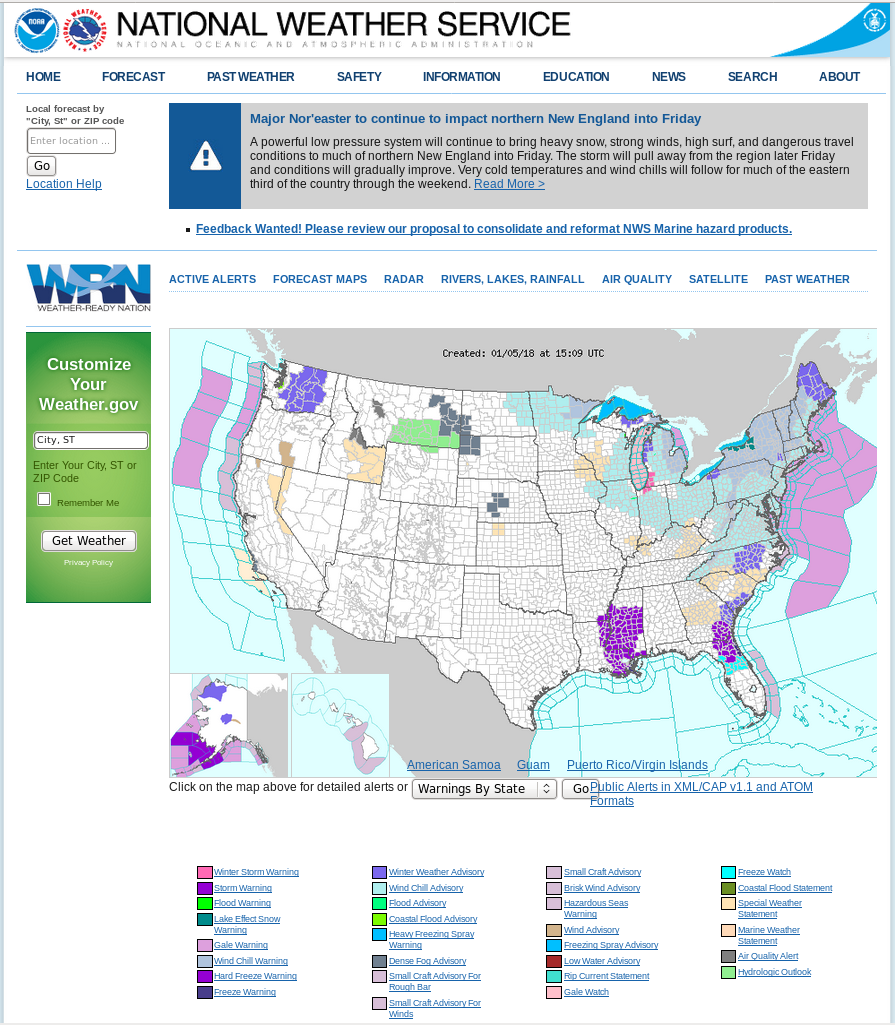
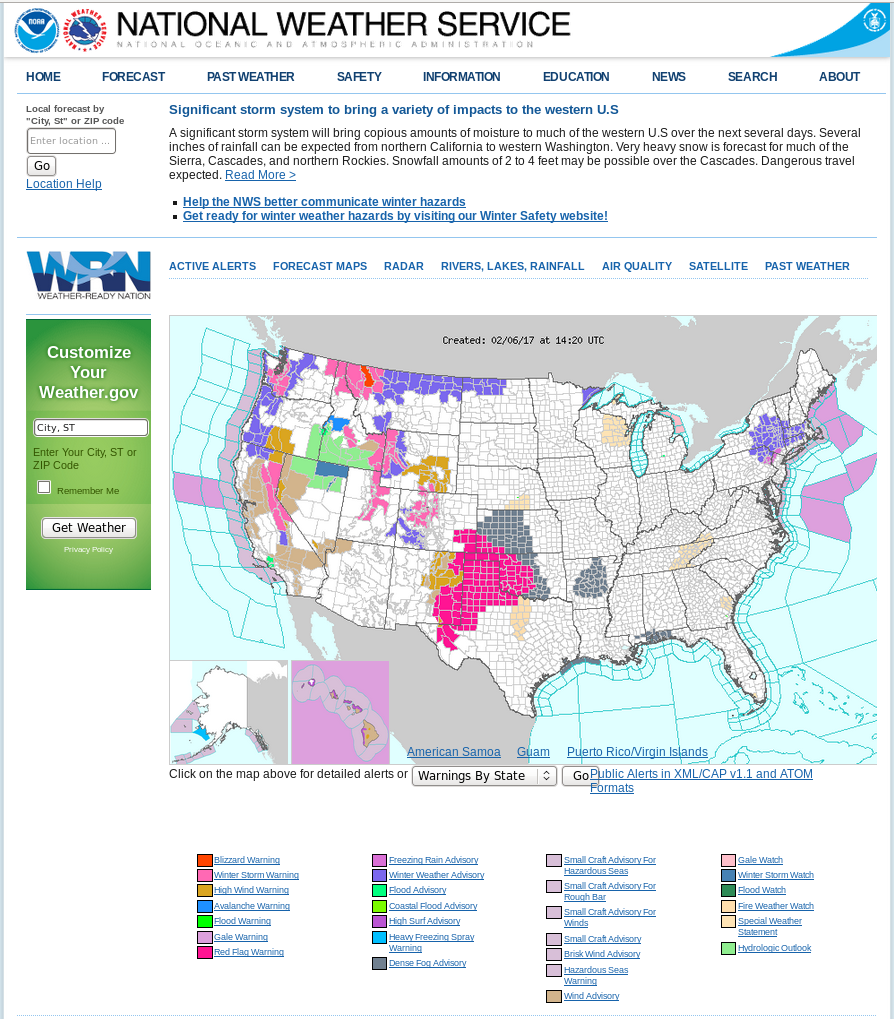
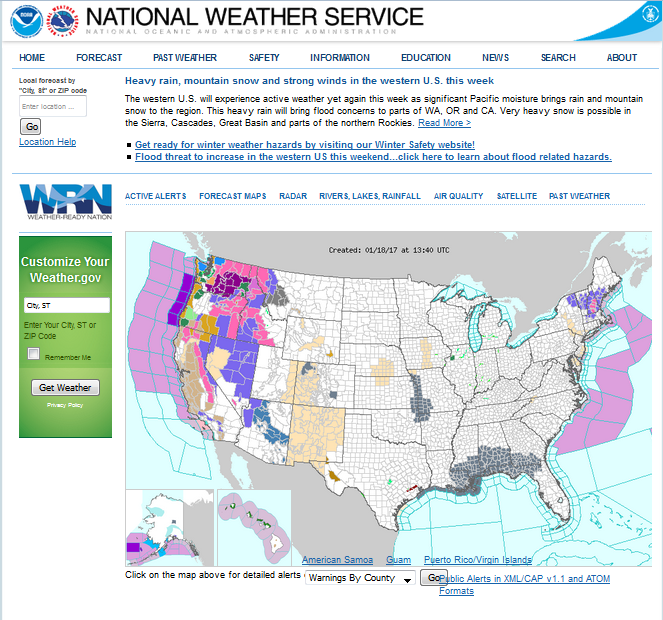
Dense Fog Advisories (click here for graphical image from this site) and widespread IFR Conditions (click here for graphical image from this site) occurred as a nearly-occluded system spun slowly eastward across the central part of the United States on 19 March 2018. (Surface; 500-hPa). GOES-16 IFR Probability, shown above, (Click the image to see the animation) outlines two large areas where consistent IFR conditions develop/persist: the upper Plains, in states around Nebraska, and the Deep South.

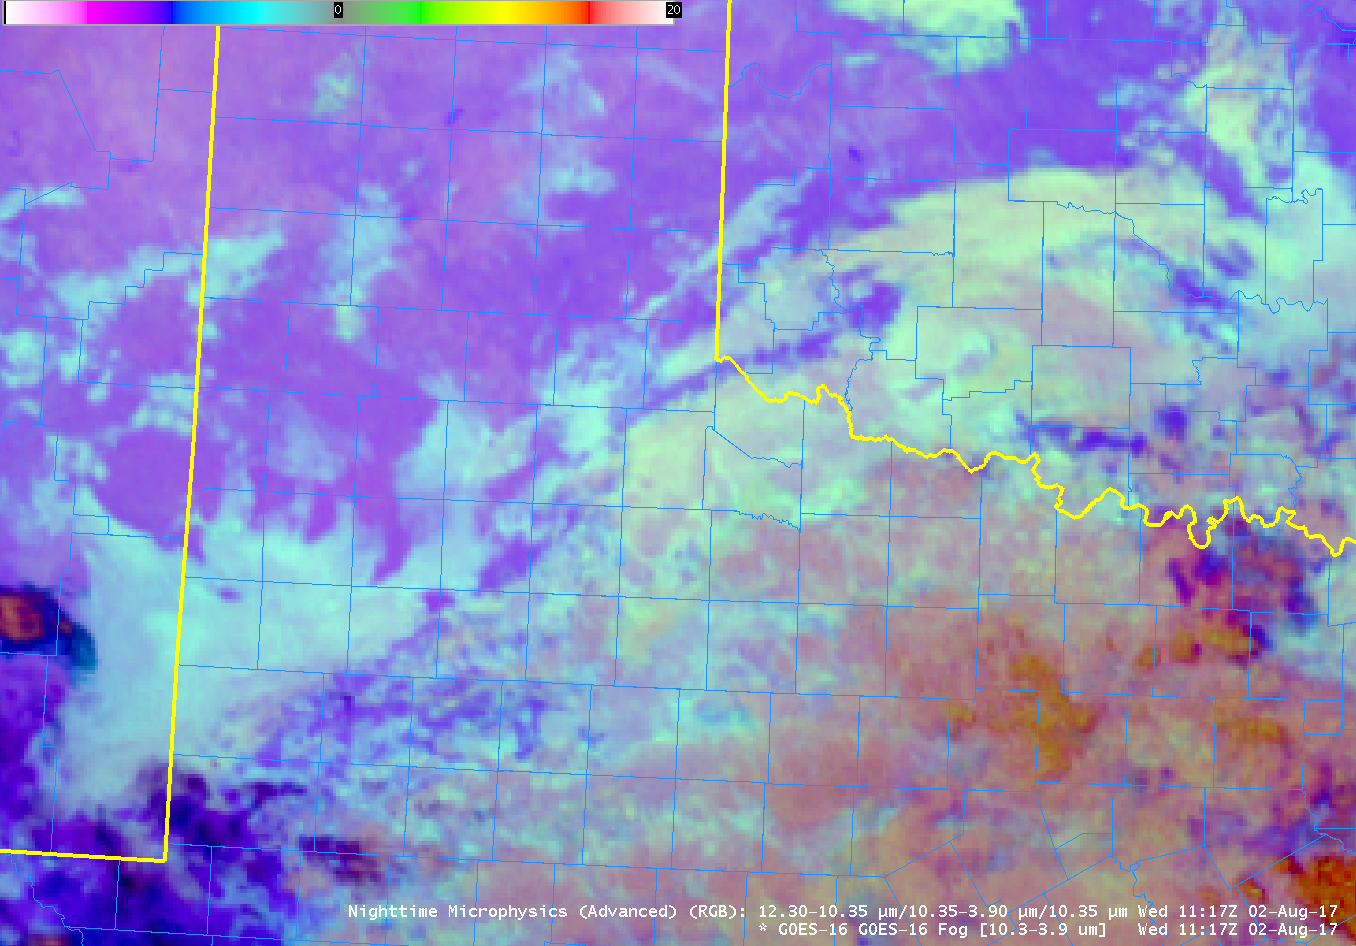
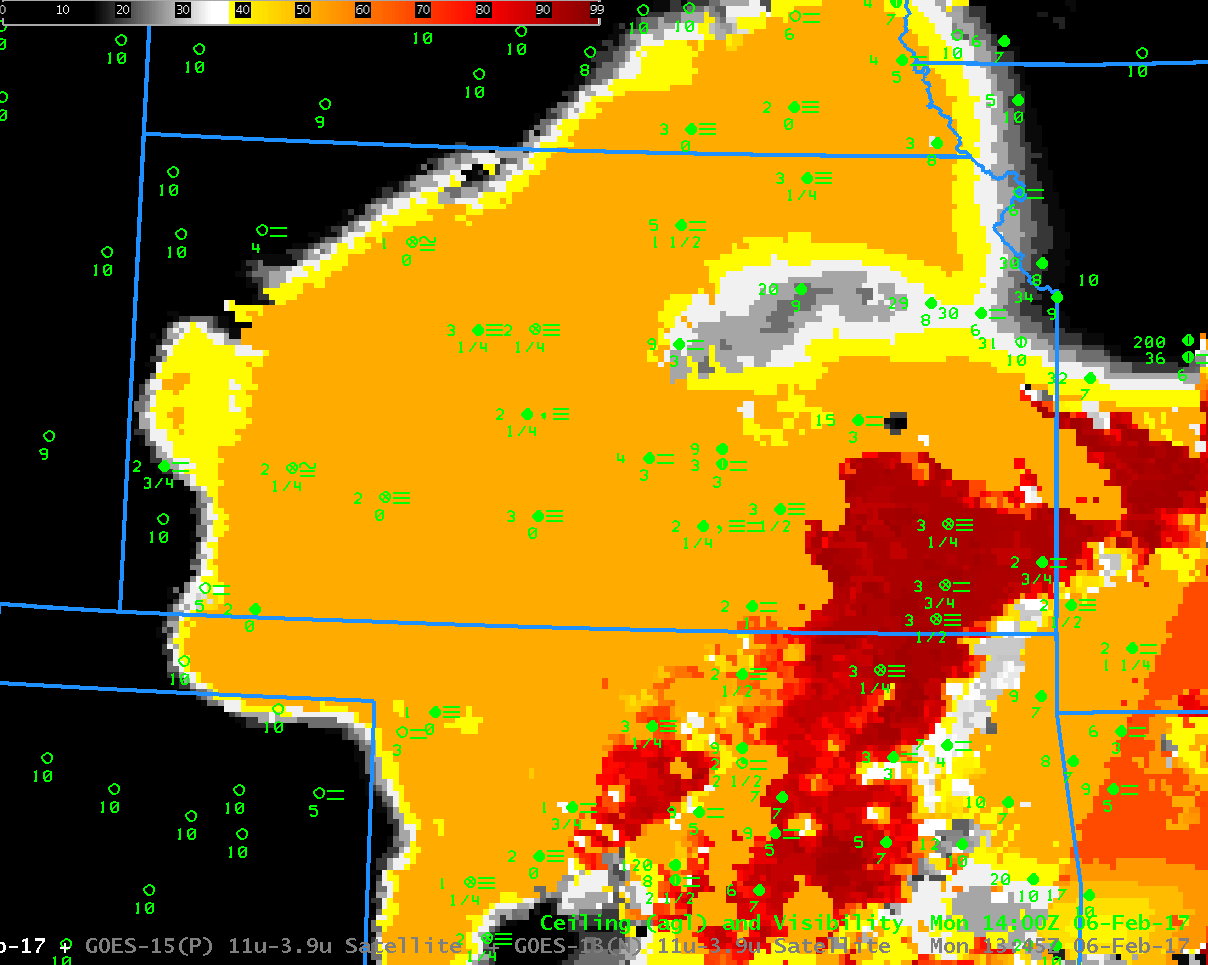
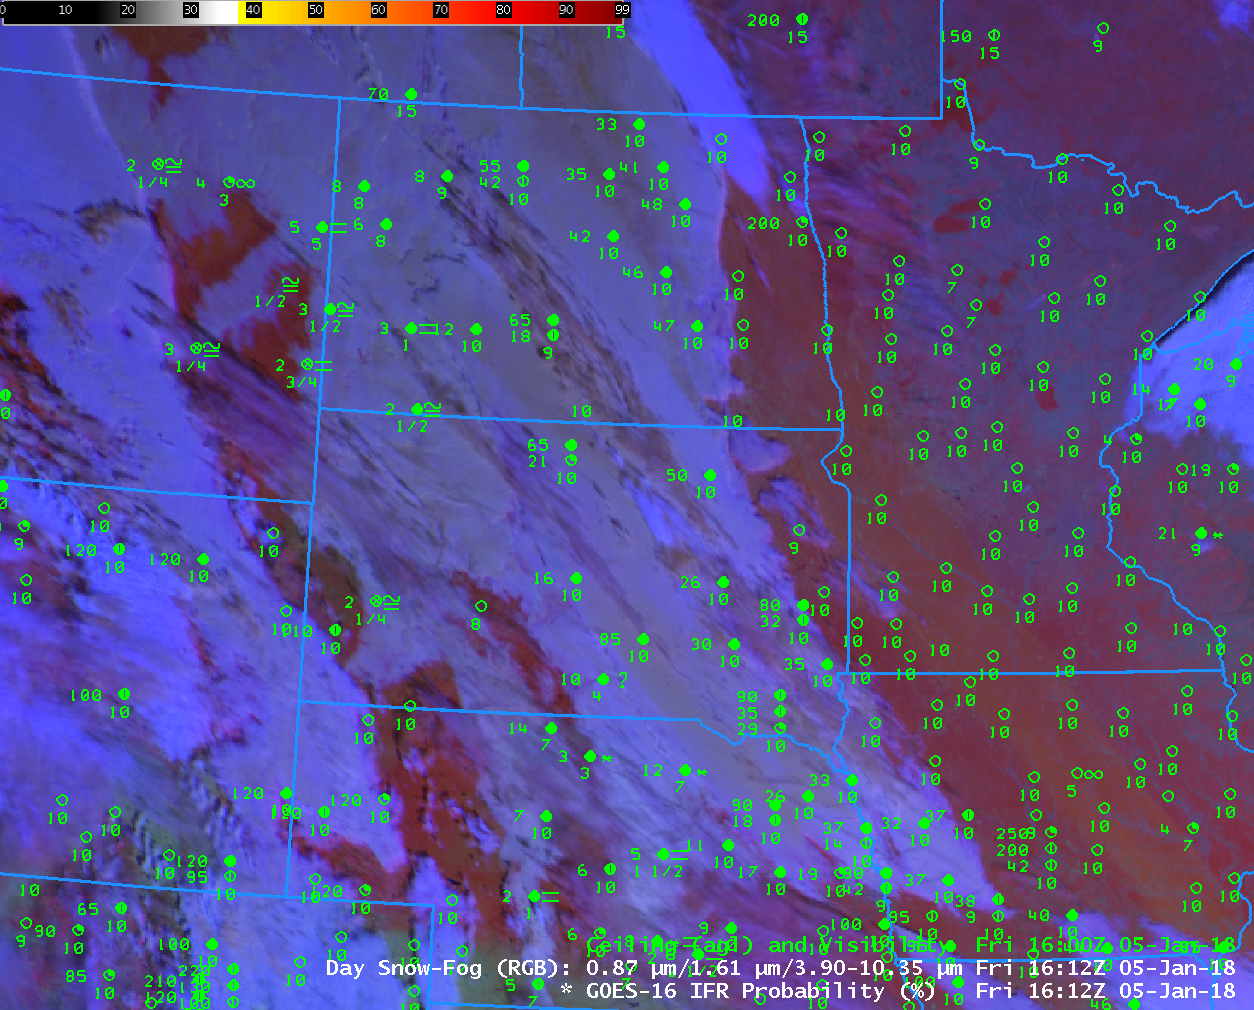
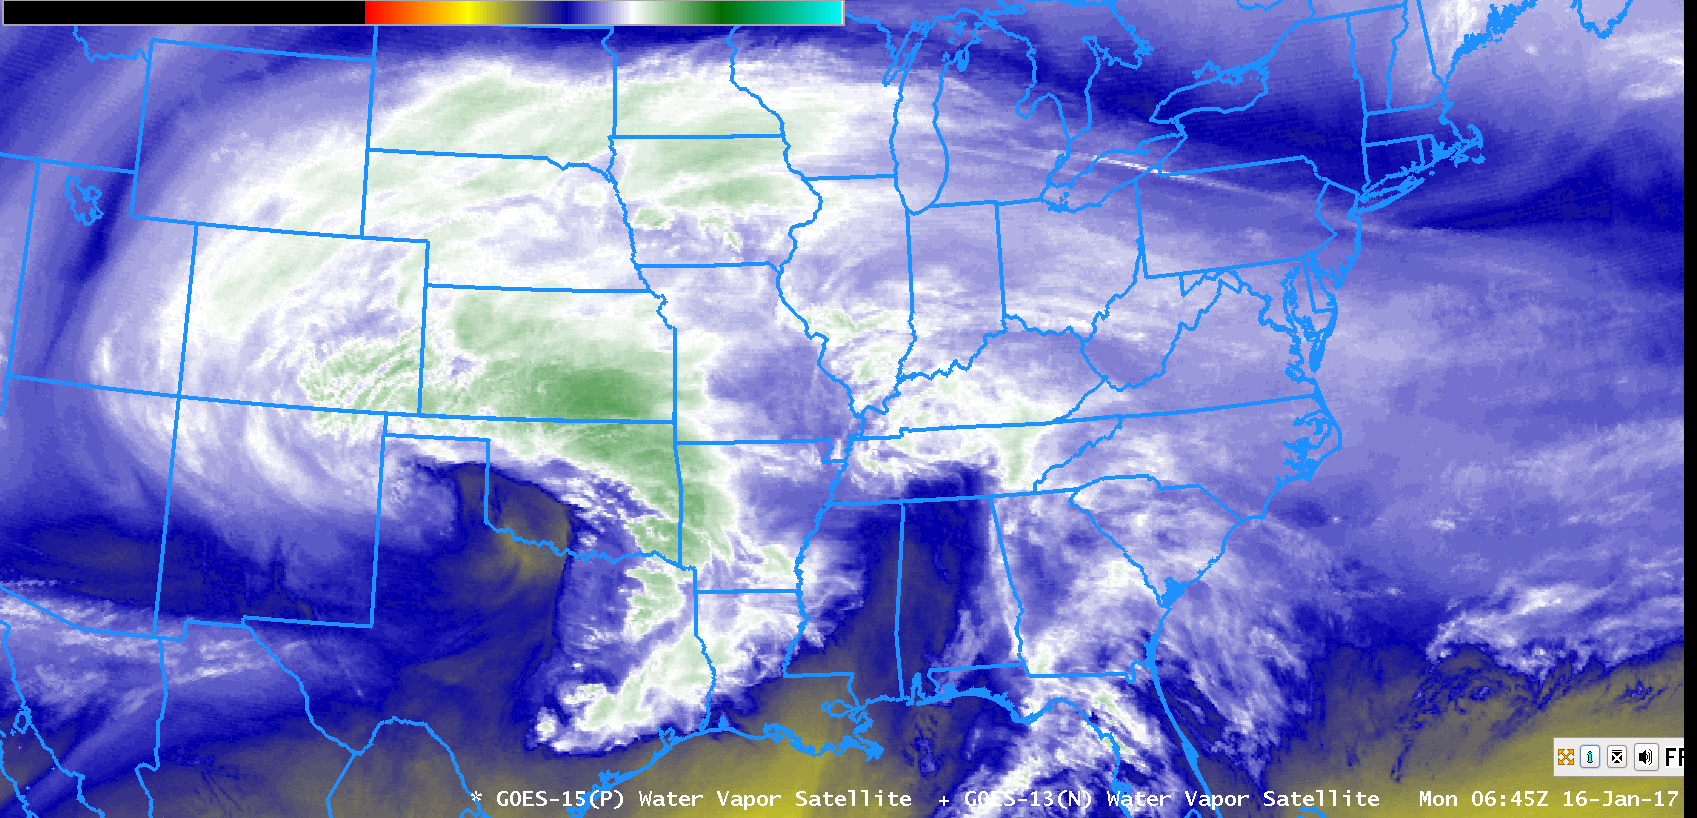
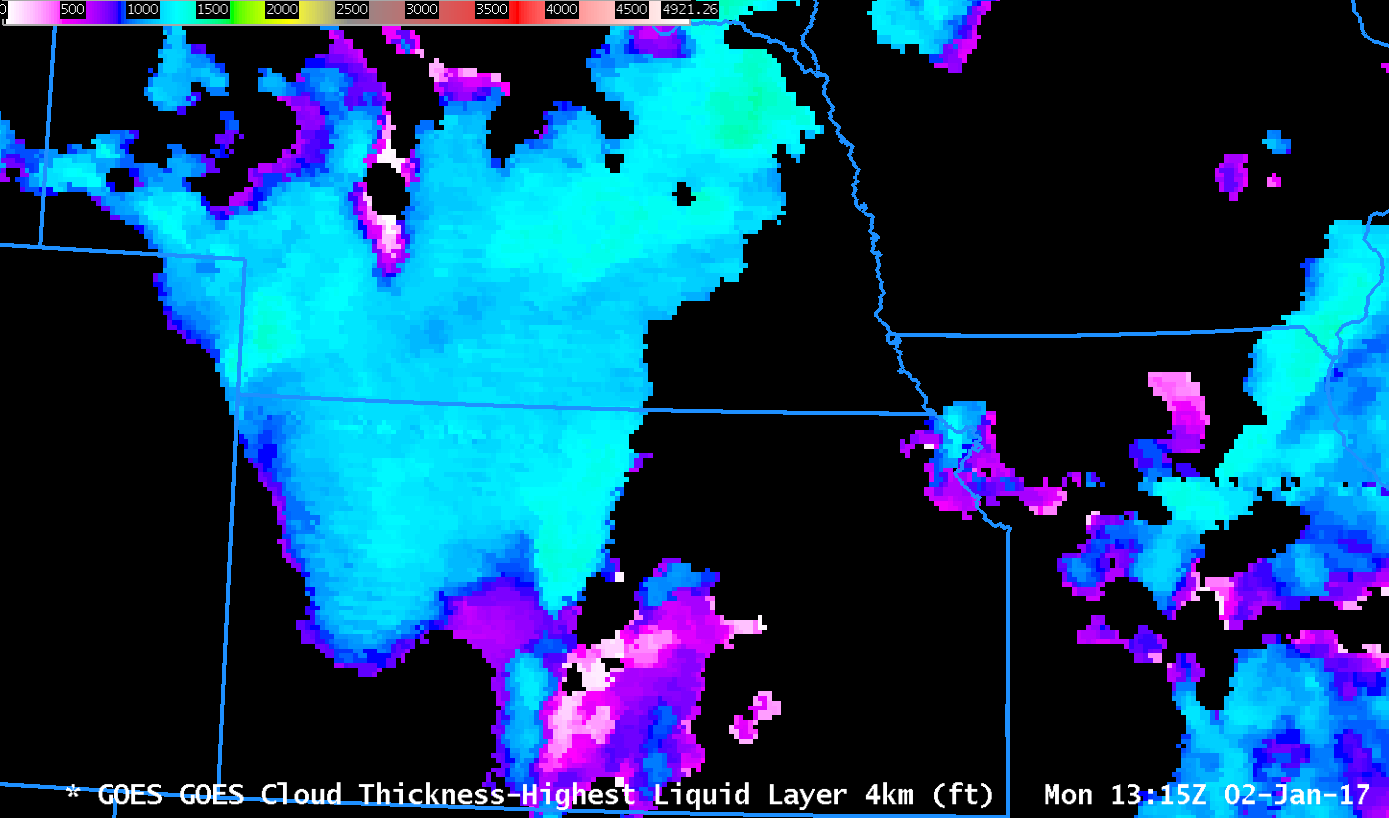
The GOES-16 Night Fog Brightness Temperature Difference field (10.3 µm – 3.9 µm), animation shown below, historically has been used to identify low stratus that is assumed to be fog at night. That detection suffers when high clouds are present (consistently on the morning of 19 March over Nebraska and surrounding states; occasionally over the Deep South as convection expels high-level cirrus into the atmosphere). Because IFR Probability fuses satellite data with Numerical Model estimates of low-level saturation (from the Rapid Refresh Model), it retains a strong signal of fog in regions where multiple clouds layers prevent the satellite from observing observed low stratus causing IFR conditions, such as over Nebraska, or over Mississippi at 0607 UTC.

GOES-16 Night Fog Brightness Temperature Difference (10.3 µm – 3.9 µm), 0202-1412 UTC on 19 March 2018 (Click to animate)

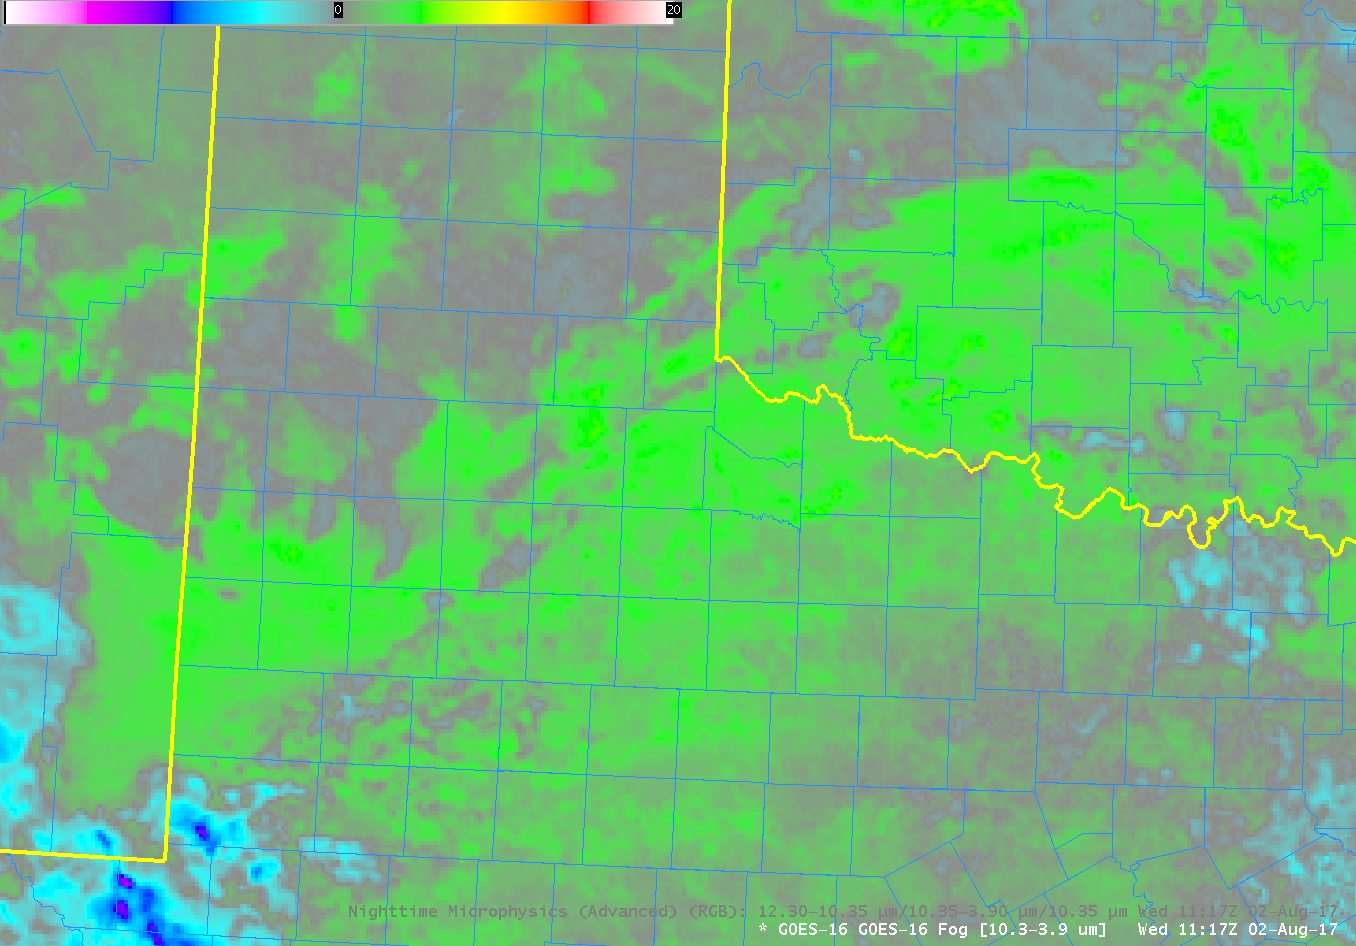
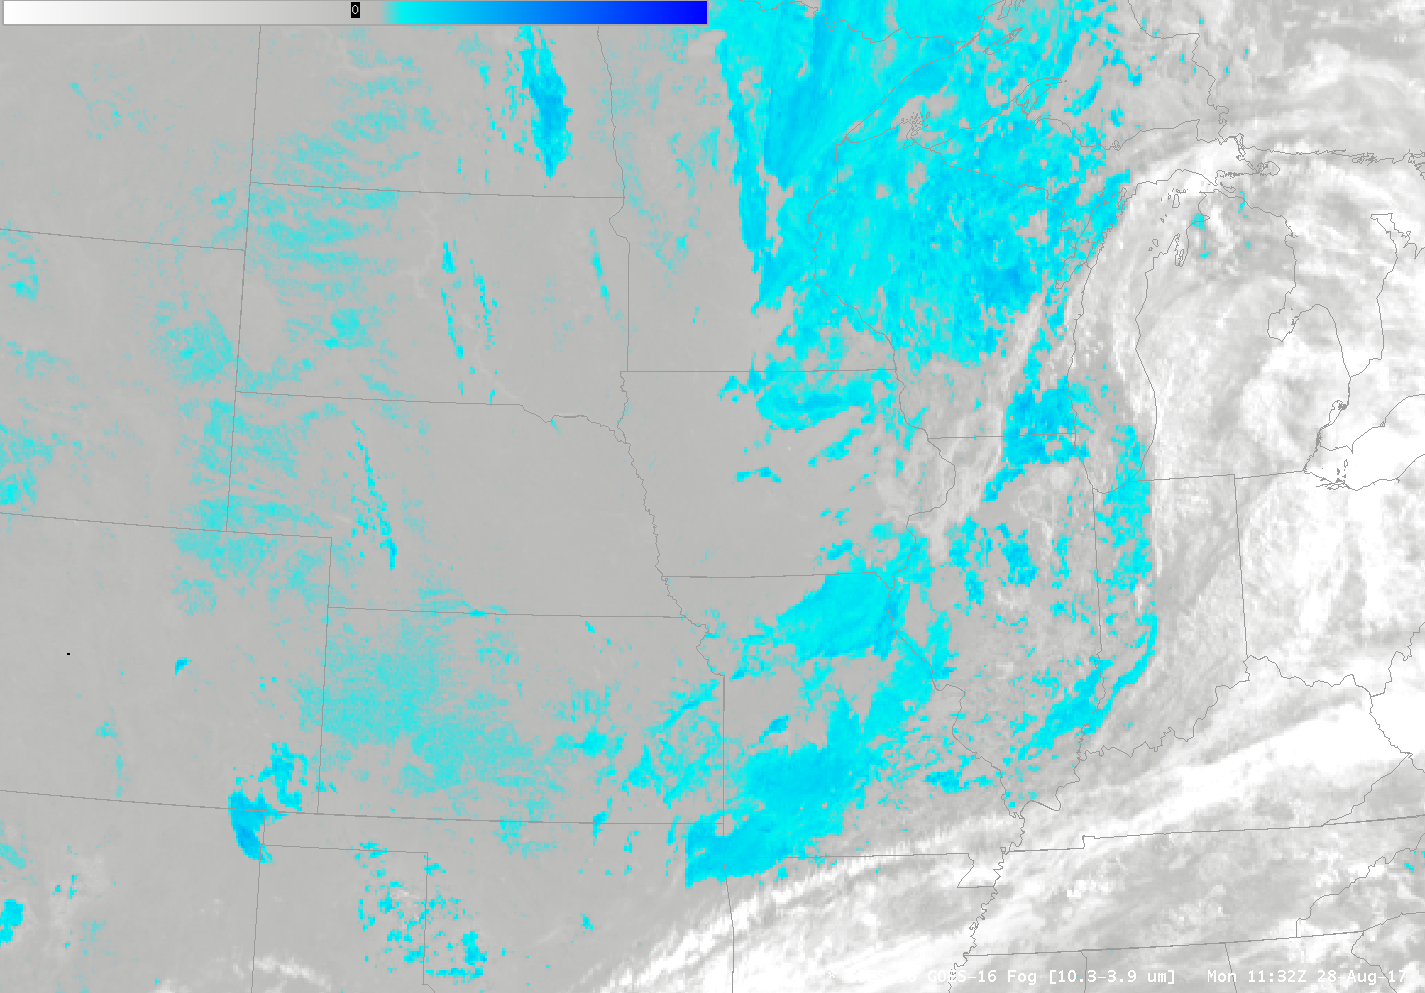
Note that there exists a Brightness Temperature Difference signal over the High Plains of Texas and New Mexico at, for example, 0800-0900 UTC. (See below). Persistent drought exists in that region (linked image from this site) and the dryness can alter the relative emissivities of the soils so that a signal develops (Click here for an earlier example).  There are no clouds in this region;  the Rapid Refresh model shows very dry air and the IFR Probability algorithm correctly diagnoses very small probabilities of IFR conditions.

GOES-16 Night Fog Brightness Temperature Difference (10.3 µm – 3.9 µm), 0802-0902 on 19 March 2018 (Click to enlarge)

Dense Fog Advisories over the Plains

Dense Fog Advisories were issued over parts of the central and northern Plains states on Friday January 5. For example, from the North Platte Office (similar warnings were issued by Billings, Rapid City and Bismark offices):

URGENT – WEATHER MESSAGE
National Weather Service North Platte NE
634 AM CST Fri Jan 5 2018

…Areas of dense fog likely this morning…

.Areas of fog reducing visibilities below one quarter mile at
times will be likely from parts of southwest into the central
Nebraska Sandhills this morning. With the fog occurring where
temperatures are below freezing, some slick spots may develop on
area roads and sidewalks as well.

NEZ025-026-037-038-059-071-051800-
/O.NEW.KLBF.FG.Y.0001.180105T1234Z-180105T1800Z/
Thomas-Blaine-Logan-Custer-Lincoln-Frontier-
Including the cities of Thedford, Halsey, Dunning, Purdum,
Brewster, Stapleton, Broken Bow, North Platte, Curtis, Eustis,
and Maywood
634 AM CST Fri Jan 5 2018

…DENSE FOG ADVISORY IN EFFECT UNTIL NOON CST TODAY…

The National Weather Service in North Platte has issued a Dense
Fog Advisory, which is in effect until noon CST today.

* Visibilities…as low as one quarter mile or less at times.

* Timing…Through the morning hours with visibilities improving
after noon CST.

* Impacts…Hazardous driving conditions due to low visibility.
Fog may freeze on area roads and walkways as well.

PRECAUTIONARY/PREPAREDNESS ACTIONS…

A Dense Fog Advisory means visibilities will frequently be
reduced to less than one quarter mile. If driving, slow down, use
your headlights, and leave plenty of distance ahead of you.

&&

$$

JWS

GOES-16 IFR Probability fields captured the development of these regions of dense fog. The animation from 0400-1200 UTC on 5 January is below. Highest values of IFR Probability are consistent in the areas where IFR Conditions are developing and where Dense Fog Advisories were issued.

GOES-16 IFR Probability, 0402 – 1207 UTC on 5 January 2018 (Click to animate)

Note that IFR Probability fields are fairly high over Iowa and the eastern Dakotas, regions where mid-level stratus was widespread but where IFR observations did not occur. On this day, Low IFR Probability fields better screened out this region of mid-level stratus. The toggle below compares IFR Probability and Low IFR Probability on 0957 UTC. The region where dense fog advisories were issued shows high values in both fields. The stratus deck over Iowa and the eastern Dakotas shows much smaller values of Low IFR Probability.

GOES-16 also has a ‘Fog Product’ brightness temperature difference (10.3 – 3.9) that has historically been used to detect low clouds. However, when cirrus clouds are present, as on 5 January, the efficacy of this product in fog detection is affected. Although fog and stratus detection is identifiable underneath the moving cirrus (the same is true in the Advanced NightTime Microphysics RGB product below), identifying the low cloud as stratus or fog from satellite data is a challenge because a consistent color married to IFR Probability does not exist.

GOES-16 ‘Fog Product’ Brightness Temperature Difference (10.3 µm – 3.9 µm), 0402 – 1207 UTC, 5 January 2017 (Click to animate)

GOES-16 Advanced Nighttime Microphysics RGB, 0402-1207 UTC on 5 January 2018 (Click to animate)

GOES-16 IFR Probability fields maintain a consistent look from night to day. Both the (10.3 µm – 3.9 µm) Brightness Temperature Difference field and the Advanced Nighttime Microphysics RGB (that uses the ‘Fog Product’ BTD) will change because the increase in reflected solar radiation at 3.9 µm will change the sign of the Brightness Temperature Difference field. There is a Daytime Day/Snow/Fog RGB Product in AWIPS, and the toggle below from 1612 UTC on 5 January compares IFR Probability and the Day/Snow/Fog RGB. As with the nighttime products, the presence of high (or mid-level) clouds makes it difficult to use the RGB alone to identify regions of fog/low stratus. In contrast, the IFR Probability field continues to correctly identify where the obstructions to visibility exist.

Dense Fog over Missouri and over Alabama

GOES-R IFR Probability Fields, Hourly from 0215-1315 UTC on 19 September 2017 (Click to enlarge)

GOES-R IFR Probabilities are computed using Legacy GOES (GOES-13 and GOES-15) and Rapid Refresh model information; GOES-16 data will be incorporated into the IFR Probability algorithm in late 2017

Dense fog developed over Missouri on Tuesday 19 September and Dense Fog Advisories were issued. The animation above shows the hourly development of GOES-R IFR Probability fields; values increased from northern Missouri to southern Missouri as dense fog developed, first north of I-70, then south into the rest of the state. The morning of 19 September was mostly devoid of mid-level and high-level clouds over Missouri (exception: west-central Missouri starting after 0900 UTC), and that kind of night means that traditional methods of fog detection work well. The brightness temperature difference field between the shortwave Infrared and the Longwave Infrared (3.9 µm and 10.3 µm on GOES-16, 3.9 µm and 10.7 µm on GOES-13) shows the fog development.

Note that the IFR Probability field, above, does not show fog dissipating around sunrise. That’s in contrast to the Brightness Temperature Difference field below. As the sun rises, the amount of solar radiation at 3.9 µm that is reflected off the clouds increases; this changes the brightness temperature difference from positive (cyan in the color enhancement shown) to negative (grey or black in the enhancement shown).

GOES-16 has better spatial resolution than GOES-13; thus, the small valley fogs that can develop in the rugged (ish) terrain of southern Missouri are resolved in GOES-16, but not in GOES-13. When GOES-R IFR Probability is created using GOES-16 data (slated to begin in late 2017), the resolution improvements in GOES-16 will migrate to IFR Probability fields.

GOES-16 data posted on this page are preliminary, non-operational and are undergoing testing.

GOES-16 Brightness Temperature Difference (10.3 µm – 3.9 µm), hourly from 0412 to 1112 UTC on 19 September (Click to enlarge)


==========================================================
On 20 September, Dense Fog developed over Tennessee and Alabama, leading to the issuance of Dense Fog Advisories. The GOES-R IFR Probability field, below, shows good agreement between high probabilities and reduced ceilings/visibilities.

GOES-R IFR Probability Fields, Hourly from 0415-1315 UTC on 20 September 2017 (Click to enlarge)

As on the 19th over Missouri, top, this was a night with relatively few middle- and upper-level cloud decks. On such nights, the GOES-16 Brightness Temperature Difference field can capably identify regions of stratus (it’s up to a human to decide if the stratus deck extends to the surface; on this night, much of the stratus did). The 2-hour animation of Brightness Temperature Difference, below, highlights two particular strengths of GOES-16: Better spatial resolution that allows small valleys to be sampled correctly, and good temporal resolution (every 5 minutes vs. every 15 minutes for GOES-13) that allows superior monitoring of the cloud evolution with time. Note that the rising sun is eroding the GOES-16 Brightness Temperature Difference signal by the end of the animation below.

GOES-16 Brightness Temperature Difference (10.3 µm – 3.9 µm), hourly from 1002 to 1202 UTC on 20 September (Click to enlarge)

The Brightness Temperature Difference field (10.3 µm – 3.9 µm) is a key component to the Nighttime Microphysics Red/Green/Blue Composite. As the toggle below shows, the Brightness Temperature Difference field overwhelmingly controls the region identified by the RGB as one with a potential for fog.

Dense Fog over the central Mississippi River Valley

GOES-16 Brightness Temperature Difference field (10.3 µm – 3.9 µm) from 0417 to 1357 UTC on 28 August 2017 (Click to animate)

GOES-16 data posted on this page are preliminary, non-operational and are undergoing testing.

GOES-16 Brightness Temperature Difference fields (10.3 µm – 3.9 µm), above, show the development of stratus clouds (made up of water droplets) over the Plains during the morning of 28 August 2017.  The Brightness Temperature for 10.3 µm is warmer than that for 3.9 µm during the night because cloud water droplets do not emit 3.9 µm radiation as a blackbody but those same cloud water droplets do emit 10.3 µm radiation more nearly as a blackbody would.   The conversion from sensed radiation to brightness temperature does assume blackbody emissions;  thus, the 3.9 µm brightness temperature is cooler where clouds made up of small water droplets exist.  The animation above shows stratus clouds developing over Missouri and adjacent states.  Dense Fog Advisories were issued near sunrise for much of the region (see image at bottom of this blog post) and IFR Conditions were widespread.

The animation above shows a positive signal over the western High Plains from Kansas northward to North Dakota. (Click here for the view at 1132 UTC on 28 August).

GOES-R IFR Probabilities are computed using Legacy GOES (GOES-13 and GOES-15) and Rapid Refresh model information; GOES-16 data will be incorporated into the IFR Probability algorithm in late 2017

How did GOES-R IFR Probability fields capture this event? The animation showing the fields every 30 minutes from 0215 through 1345 UTC on 28 August 2017, below, shows the development of High Probabilities in the region where Dense Fog was observed. There is a signal along the western High Plains, but it has low Probability; a conclusion might be that thin stratus has developed but that the Rapid Refresh model does not suggest that widespread low-level saturation is occurring. As the sun rises, the signal over the western High Plains disappears. Click here for a toggle between the GOES-R IFR Probability and the GOES-16 Brightness Temperature Difference field at 1115 UTC.

GOES-R IFR Probability fields, 0215-1345 UTC, 28 August 2017 (Click to enlarge)

Screen Capture of http://www.weather.gov at 1300 UTC on 28 August 2017 (Click to enlarge)

Dense Fog over the Texas High Plains

GOES-R IFR Probability fields, hourly from 0215-1115 UTC on 2 August 2017 (Click to enlarge)

GOES-R IFR Probabilities are computed using Legacy GOES (GOES-13 and GOES-15) and Rapid Refresh model information; GOES-16 data will be incorporated into the IFR Probability algorithm in late 2017

The National Weather Service in Lubbock issued Dense Fog Advisories (below) for parts of their CWA early in the morning on 2 August 2017.  GOES-R IFR Probability fields, above, show a slow increase in values over west Texas during the night of 1-2 August 2017, as visibilities drop and ceilings lower in the region.  This followed a band of showers that moved through the area around sunset on 1 August (Click here for a visible image from 0017 UTC on 2 August, from this site).  Highest IFR Probability values at the end of the animation generally overlay the Dense Fog Advisory.  As a situational awareness tool for the developing fog/low stratus, IFR Probability performed well.


GOES-16 data posted on this page are preliminary, non-operational and are undergoing testing

GOES-16 Brightness Temperature Difference field (10.3 µm – 3.9 µm) at 1117 UTC on 2 August 2017 (Click to enlarge)

The GOES-R IFR Probability fields above mostly show the small-scale variability (i.e., pixelation) that is common when both (legacy) GOES data and Rapid Refresh Data are used to produce a probability that IFR conditions will be present.  Some exceptions:  southeastern New Mexico at the end of animation (1115 UTC);  the yellow and orange region there overlain by mid-level or high clouds that prevent a satellite view of the low clouds.  The GOES-16 Brightness Temperature Difference (10.3 µm – 3.9 µm) field at 1117 UTC shows a signal of high clouds there (cyan / blue / purple enhancement showing negative values that typify thin cirrus in the Brightness Temperature Difference field at night).  The Green values in the color enhancement are positive values and correspond to stratus (composed of water droplets) clouds.  Because the Brightness Temperature Difference field shows a signal, the Advanced Nighttime Microphysics RGB will also have a signal for fog (the whitish/cyan color), as shown below.

GOES-16’s better temporal and spatial resolution allow for more accurate monitoring of the development of small-scale features.  However, the shortcomings of using a Brightness Temperature Difference from satellite to monitor fog development should not be forgotten:  In regions of cirrus, satellite views of low stratus and fog are blocked.  In addition, over Texas and the rest of the High Plains, upslope flow can generate stratus over the central Plains that becomes fog over the High Plains as the terrain rises into the clouds.  The top of the stratus cloud and the fog bank in such a case can look very similar from satellite.

Advanced Microphysics RGB Composite at 1117 UTC on 2 August 2017 (Click to enlarge)

Below is a toggle between the 1115 UTC IFR Probability field, the GOES16 Brightness Temperature Difference Field, and the GOES16 Advanced Microphysics RGB Composite.

GOES-R IFR Probability fields computed with legacy GOES data and Rapid Refresh model output, GOES-16 Brightness Temperature Difference (10.3 µm – 3.9 µm) field and GOES-16 Advanced Microphysics RGB, all near 1115 UTC on 2 August 2017 (Click to enlarge)


Low IFR and IFR Conditions over the central United States

Note: GOES-R IFR Probabities continue to be computed with GOES-13 and GOES-15 data only. Incorporation of GOES-16 data will occur near the end of 2017.

Front Page from the Aviation Weather Center webpage (http://www.aviationweather.gov) at 1155 UTC 3 April 2017. Stations with IFR / LIFR conditions are indicated by red / magenta. (Click to enlarge)

A wide swath of Dense Fog Advisories were hoisted over the central part of the United States on Monday 3 April 2017 in association with southerly flow and a variety of fronts. The Aviation Weather Center front page (screen-captured, as shown above), showed Low IFR and IFR conditions throughout the central Plains.

The development of the Low IFR Conditions coincided with an increase in Low IFR Probabilities during the night, as shown by the stepped animation below showing data from 0200, 0500 and 0915 UTC. Low IFR Probabilities over Iowa, Nebraska and Kansas, part of a smooth yellow field, are driven solely by Rapid Refresh Data in a region where high and mid-level clouds are preventing the satellite from observing low clouds.

GOES-R Low IFR Probabilities at 0200, 0500, 0915 UTC on 3 April 2017 (Click to enlarge)

GOES-R IFR Probabilities, below, generally cover the same region as Low IFR Probabilities shown above, but have larger values. As with the Low IFR Probabilities, model data only are determining the probabilities over much of Iowa, Nebraska and Kansas, a region where the probability field is uniform and flat, especially at the end of the animation.

GOES-R IFR Probabilities at 0200, 0500, 0915 UTC on 3 April 2017 (Click to enlarge)

GOES-R Low IFR Probability is shown below with surface observations superimposed. There is a good relationship between high probabilities and observed IFR and Low IFR conditions.

GOES-R IFR Probability fields, 0945 UTC on 3 April 2017 along with surface observations of ceilings and visibilities at 1000 UTC (Click to enlarge)

Note: GOES-R IFR Probabities continue to be computed with GOES-13 and GOES-15 data only. Incorporation of GOES-16 data will occur near the end of 2017.

Fog over Kansas

GOES-R IFR Probability fields, 1345 UTC on 6 February 2017, along with 1400 UTC surface observations of ceilings and visibilities (Click to enlarge)

Dense Fog Advisories were issued for much of central Kansas early on 6 February 2017.  This was an example of how GOES-R IFR Probability fields (above) can help identify regions of dense fog when high clouds prevent satellite detection of low clouds.  The brightness temperature difference field, below, shows high clouds over much of Kansas — it’s therefore very difficult to relate cloud signatures to obstructions to visibility near the surface.  In contrast, IFR Probability fields, above, use saturation in the lowest part of the Rapid Refresh Model and capably highlight regions where fog/low ceilings are occurring.

Brightness Temperature DIfference field (3.9µm – 10.7µm) at 1345 UTC on 6 February 2017, along with surface observations of ceilings and visibility (Click to enlarge)

Ice Fog in Kansas City

GOES-R IFR Probabilities, hourly from 0115 through 1815 UTC, and surface observations of ceilings and visibilities, on 18 January 2017 (Click to enlarge)

Ice Fog developed over Kansas City during the early morning hours of 18 January 2017, with accidents that snarled traffic (tweeted image courtesy @DrWxologist Chad Gravelle)  starting before sunrise and continuing through the morning rush hour  (Screenshot of News link from here).    Dense Fog Advisories were issued.  The animation above, of GOES-R IFR Probability fields, shows the slow westward progression of the Fog/Low Clouds into the Kansas City Metro area shortly after 4 AM CST.  High IFR Probabilities persist through 1800 UTC and diminished shortly thereafter.

During this case, an absence of mid-level and high clouds allowed IFR Probabilities to reach very large values.  The toggle below shows Brightness Temperature Difference fields (3.9 – 10.7) and GOES-R IFR Probabilities at 1115 UTC.  Low clouds cover Missouri except for the region over the Missouri Bootheel.  Note that the western edge of the satellite-detected low clouds is slightly to the east of the western edge of the IFR Probability in this case.  Model data are suggesting that low-level saturation is occurring in those regions (over far southwest Iowa, for example) although satellite data were not yet showing a strong signal.  Observations show IFR conditions (at Clarinda, Iowa, for example, where freezing fog is reported with 200-foot ceilings and 1/4-mile visibility).

Widespread IFR Conditions over the Plains

GOES-R IFR Probability Fields, hourly from 0115-1315 UTC (Click to enlarge)

A cyclone over the southern Plains, in addition to causing severe weather over Texas on 15 January also generated widespread IFR Conditions over the southern Plains, as shown below in screengrabs from the Aviation Weather Center and from the National Weather Service. An overnight Water Vapor image (here) testifies to the ubiquitous presence of high clouds over the Plains; in such cases with widespread high clouds, low-cloud detection by satellite is a big problem. A strength of the GOES-R IFR Probability field is that it is a fused data product, incorporating both satellite information (not particularly useful for much of the overnight hours on 15-16 January) and Rapid Refresh model data that can be used to discern conditions near the surface. When the Rapid Refresh model suggests saturation is occurring near the surface (in, say, the lowest 1000 feet of the model atmosphere), IFR Probabilities will be large. They won’t be as large as they might be if both satellite and model data suggest low clouds are present, but useful information emerges in the IFR Probability fields, above, where the Rapid Refresh is predicting low-level saturation. IFR Probabilities are large over much of the southern Plains where IFR conditions are observed. This is the region where the color enhancement is orange.

The low pressure system develops such that high clouds diminish over Texas and Oklahoma. When that happens, the IFR Probability fields change in two ways. First, values increase because satellite data and model data can be used as predictors. When only model data can be used, IFR Probability fields will have smaller values. Secondly, the character of the IFR Probability field takes on a more pixelated appearance because the satellite data values will vary from pixel to pixel. In contrast, when only model data can drive the IFR Probability field (for example, over Kansas at the beginning of the animation), the IFR Probability fields vary quite slowly from pixel to pixel in part because of model smoothing.

Screen Capture from Aviation Weather Center (left, showing widespread IFR Conditions) and from Weather.Gov (right, showing Dense Fog Advisories in grey) (Click to enlarge)

The toggle below includes sampling over Abilene, TX (KABI), a station at the edge of the IFR Probability field. IFR Probabilities are relatively constant at ~40% for the two hours shown, but station conditions change from IFR to VFR. IFR Probabilities at Abilene become quite small by 1315 UTC, at the end of the animation above.

GOES-R IFR Probability at 1015 and 1215 UTC on 16 January 2017. Station conditions at KABI are indicated by the sample probe (Click to enlarge)

Persistent IFR Conditions over Kansas

GOES-R IFR Probability fields, 0400-1700 UTC on 2 January 2017 (Click to enlarge)

Late in the morning on Monday 2 January 2017, the weather.gov website shows Dense Fog Advisories persisting in parts of Kansas and Nebraska.  The animation above shows GOES-R IFR Probabilities from 0400 through 1700 UTC on the 2nd. High IFR Probabilities show excellent correspondence with very low ceilings and reduced visibilities. Note, for example, the sharp demarcation at 1700 UTC between IFR conditions (and large IFR Probabilities) and VFR/MVFR conditions (and very low IFR Probabilities) over northwestern Kansas/east central Colorado.

In the animation above, large parts of central Kansas have IFR Probabilities that are uniform, and around 52% (indicated by the mustard orange color). The IFR Probability field has this character at that time — and later in the animation over much of eastern Kansas and Missouri/Iowa — because of high clouds that are present. When high clouds prevent the satellite from viewing low clouds, model data in the form of Rapid Refresh estimates of low-level saturation are the driving force behind the IFR Probability value. The animation below of Brightness Temperature Difference fields shows the characteristic dark streak that in the enhancement used represents high clouds at night. High clouds then spread over Missouri and Iowa during the day.

GOES-13 Brightness Temperature Difference fields (3.9 µm – 10.7 µm), 0400-1700 UTC on 2 January 2017 (Click to enlarge)

GOES-R Cloud Thickness can be used in cases of radiation fog to estimate dissipation time, using the value just before sunrise, here, and this scatterplot. Low clouds on 2 January however were synoptically forced so it would be inappropriate to expect the GOES-R Cloud Thickness field to estimate dissipation times correctly.