Category Archives: Multiple Cloud Layers

IFR Conditions over Georgia on a Summer Morning

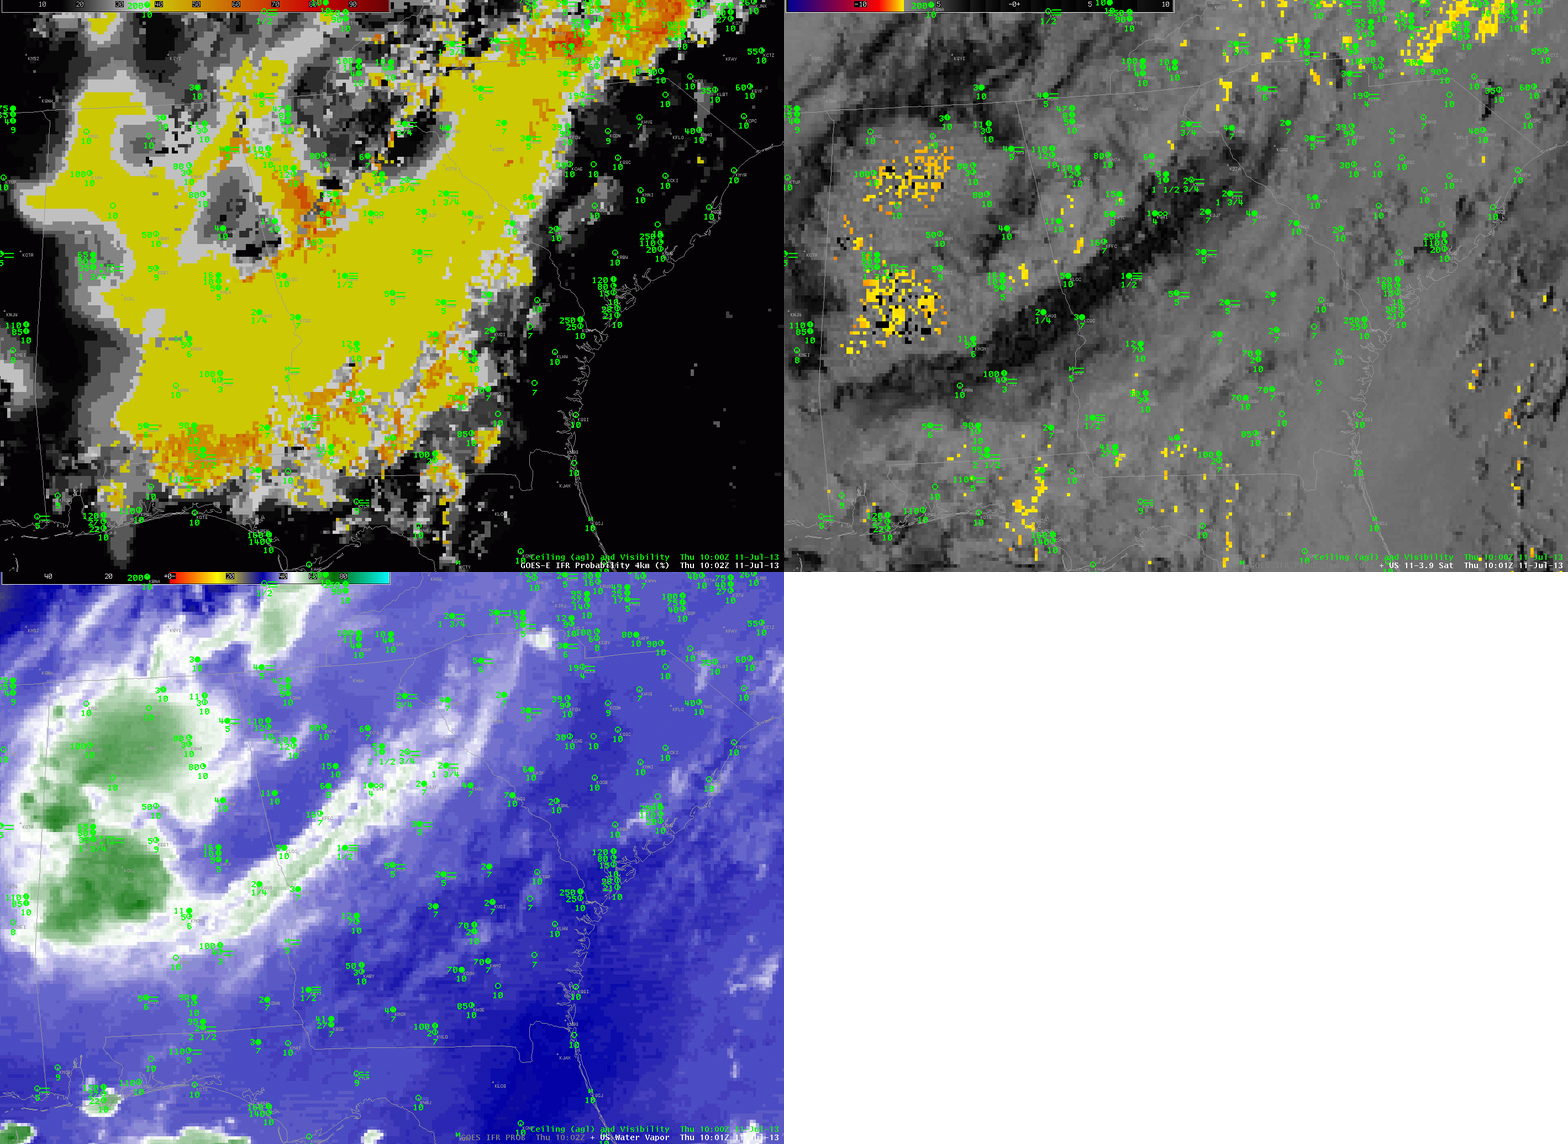
Animation of GOES-East Water Vapor Imagery (6.7 µm), Brightness Temperature Difference Product (10.7 µm – 3.9 µm) and GOES-R IFR Probability computed with GOES-East data, 1000 UTC on 11 July 2013

The satellite animation, above, shows ample evidence of multi-layered clouds over Georgia and surrounding states, in a region where ceilings and visibilities approached/exceeded IFR conditions.  The traditional method of determining regions of fog/low stratus — the brightness temperature difference between the 10.7 µm and 3.9 µm channels — gives no information here because low clouds are screened by higher ice-phase clouds.

GOES-R IFR Probability fields merge information from GOES Imager data and the Rapid Refresh Model.  Even if GOES Imager data gives little information, GOES-R IFR Probability fields will give valuable information because they are also use information from the Rapid Refresh model.  Because the IFR Probability fields don’t include satellite data, probabilities are lower.  The large region of yellow — IFR Probabilities around 40% — sits over many stations that are reporting IFR conditions.   Note how IFR Probabilities are higher over North Carolina where satellite data are being used in the computation of the field — but there are fewer reports there of IFR conditions (despite the higher probability).  Temper the interpretation of the IFR Probabilities with knowledge of what is being used to compute them.

The evolution of IFR Probability fields can give a Head’s Up to deteriorating conditions in the atmosphere.  Note in the hourly animation below how probabilities initially do increase over regions that subsequently have IFR or near-IFR conditions.  At the end of the animation, there is an obvious boundary between different probabilities over northeast Georgia (Orange values around 55%) and western Georgia (values around 40%).  That southeast-to-northwest boundary shows where nighttime predictors are being used (to the west) vs. daytime predictors (to the east) in the computation of IFR Probabilities.
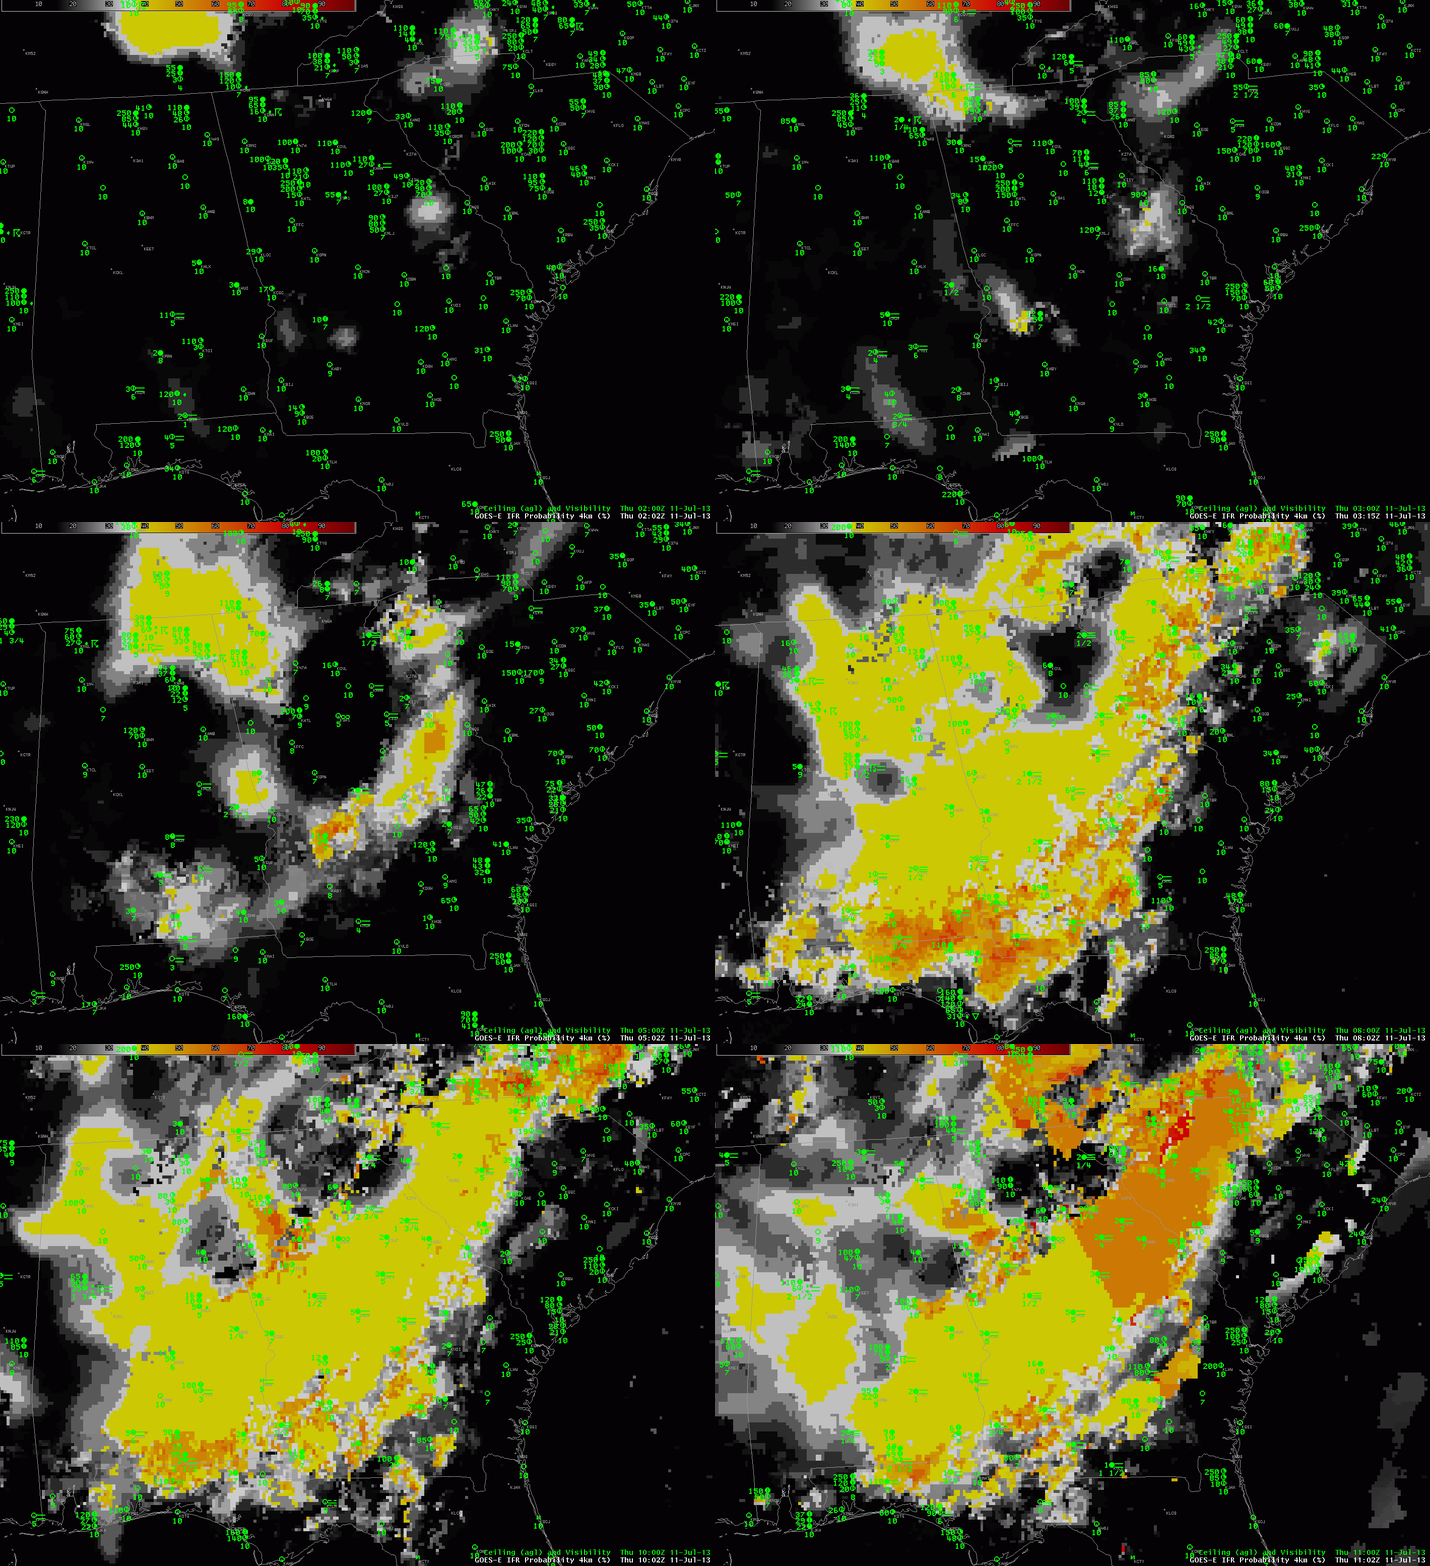
GOES-R IFR Probabilities (hourly) from 0200 through 1100 UTC, 11 July 2013

Lake Superior Plus High Dewpoints Means Fog

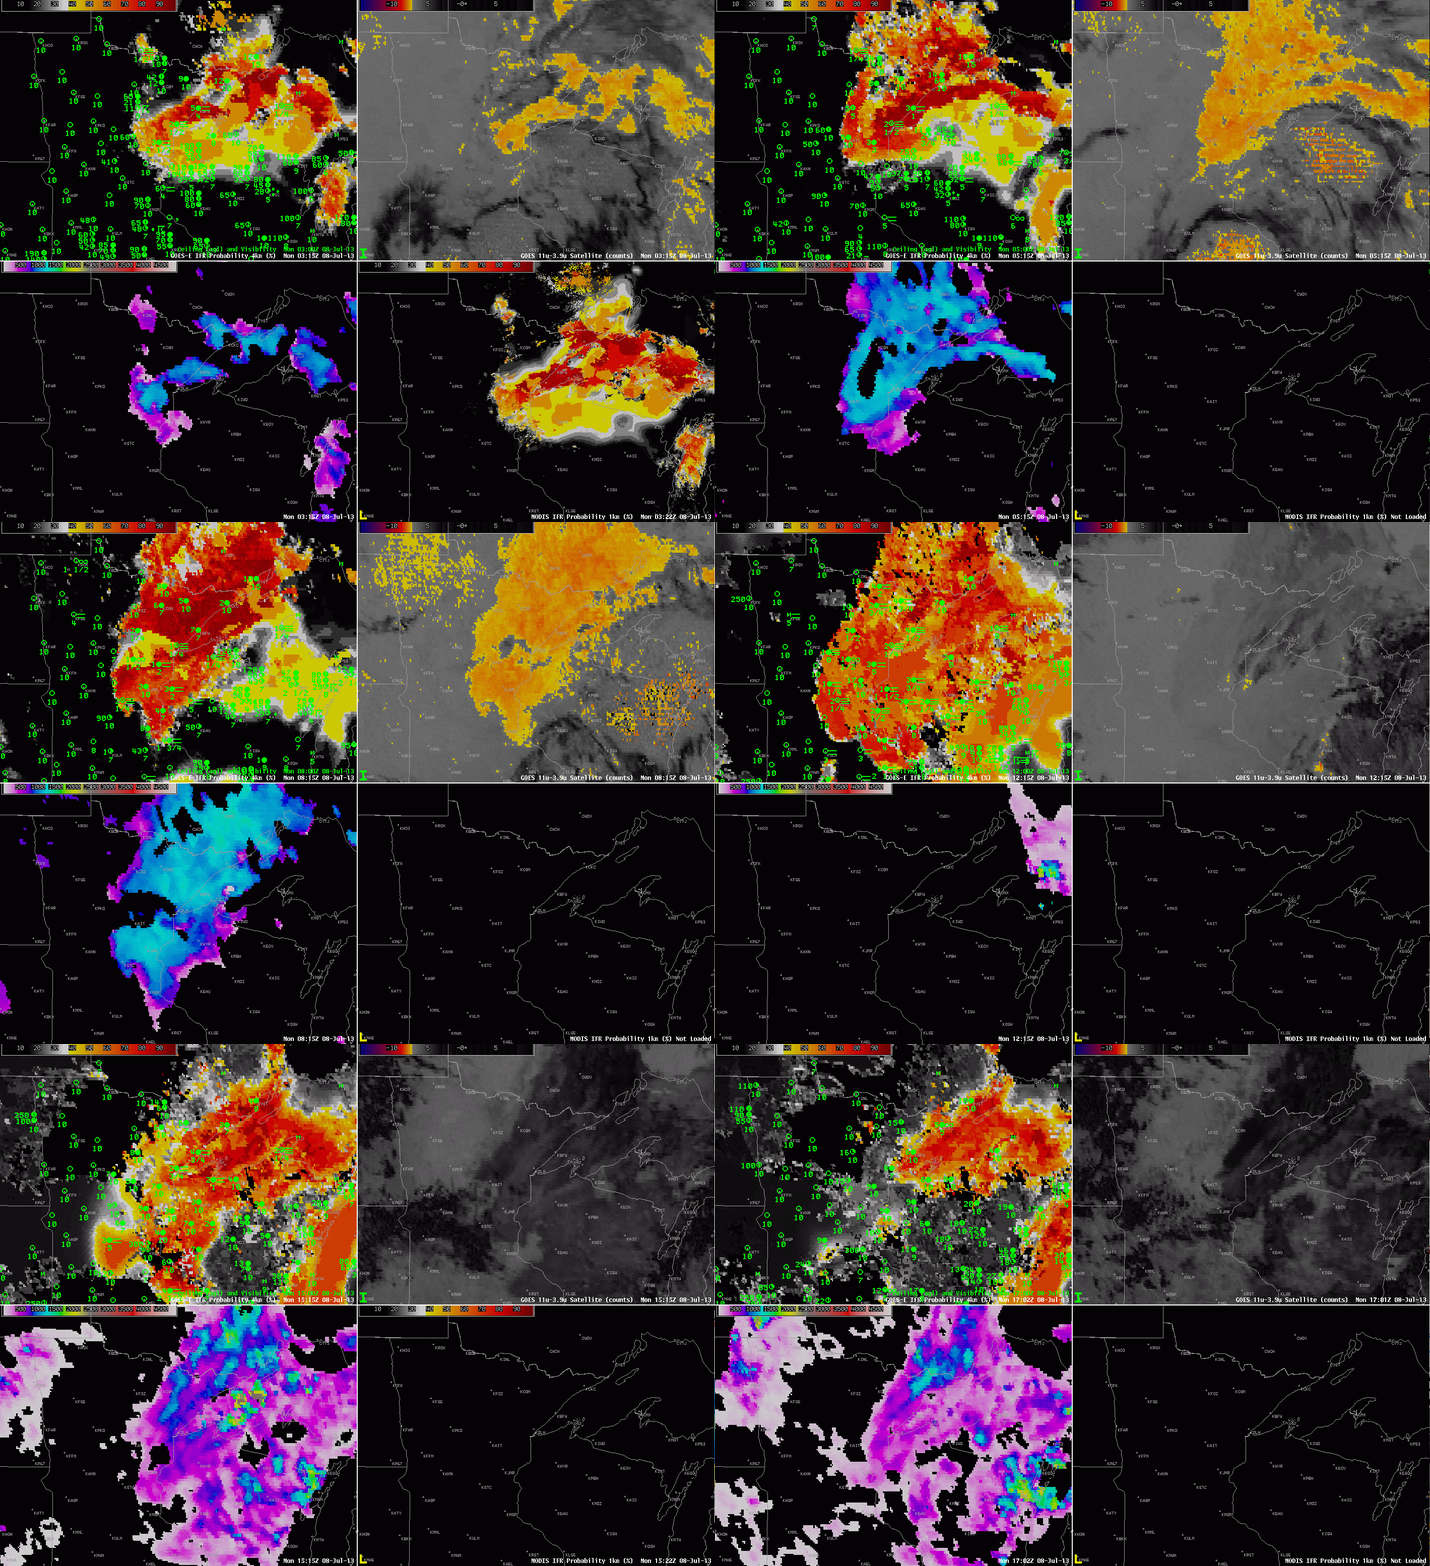
GOES-R IFR Probabilities computed from GOES-East, and surface observations of ceilings/visibilities (Upper Left), GOES-East Brightness Temperature Difference (10.7 µm – 3.9 µm) (Upper Right), GOES-R Cloud Thickness computed from GOES-East (Lower Left), GOES-R IFR Probabilities computed from MODIS (Lower Right)

The combination of cold Lake surface temperatures in the 40s and 50s over Lake Superior and mid-Summer dewpoints in the 60s to near 70 is a recipe for fog over the upper midwest. North winds behind a complex of thunderstorms fostered the development of fog and low stratus over the upper midwest early in the morning on July 8th, as shown in the imagery above.

The GOES-R IFR Probability fields seamlessly track the expansion of fog/low stratus in the region around western Lake Superior;  highest probabilities are confined to regions where IFR or near-IFR conditions are observed.  The IFR Probabilities also downplay regions where the brightness temperature difference field is showing a signal (northwest Minnesota) but where visibility obscurations are small.

IFR Probabilities are not as large over southern upper Michigan or over north-central Wisconsin, regions where multiple cloud layers mean that the satellite component does not contribute to IFR Probability computation, resulting in a smaller value.  Note that Cloud Thickness is not initially computed there either:  Cloud Thickness describes the thickness of the lowest water-based cloud layer in non-twilight conditions.  If there are multiple cloud layers that include mixed-phase of ice clouds, cloud thickness is not computed.  Note also that cloud thickness is not computed in the hours around sunrise (i.e., during twilight conditions).

By 1702 UTC, the final image, the Summer Sun has burned off much of the fog and low stratus, with the exception being along the shorline of Lake Superior.  MODIS-based IFR Probabilities have much sharper edges because of the higher resolution of the MODIS instrument compared to the GOES Imager.

Fog Development over central Illinois

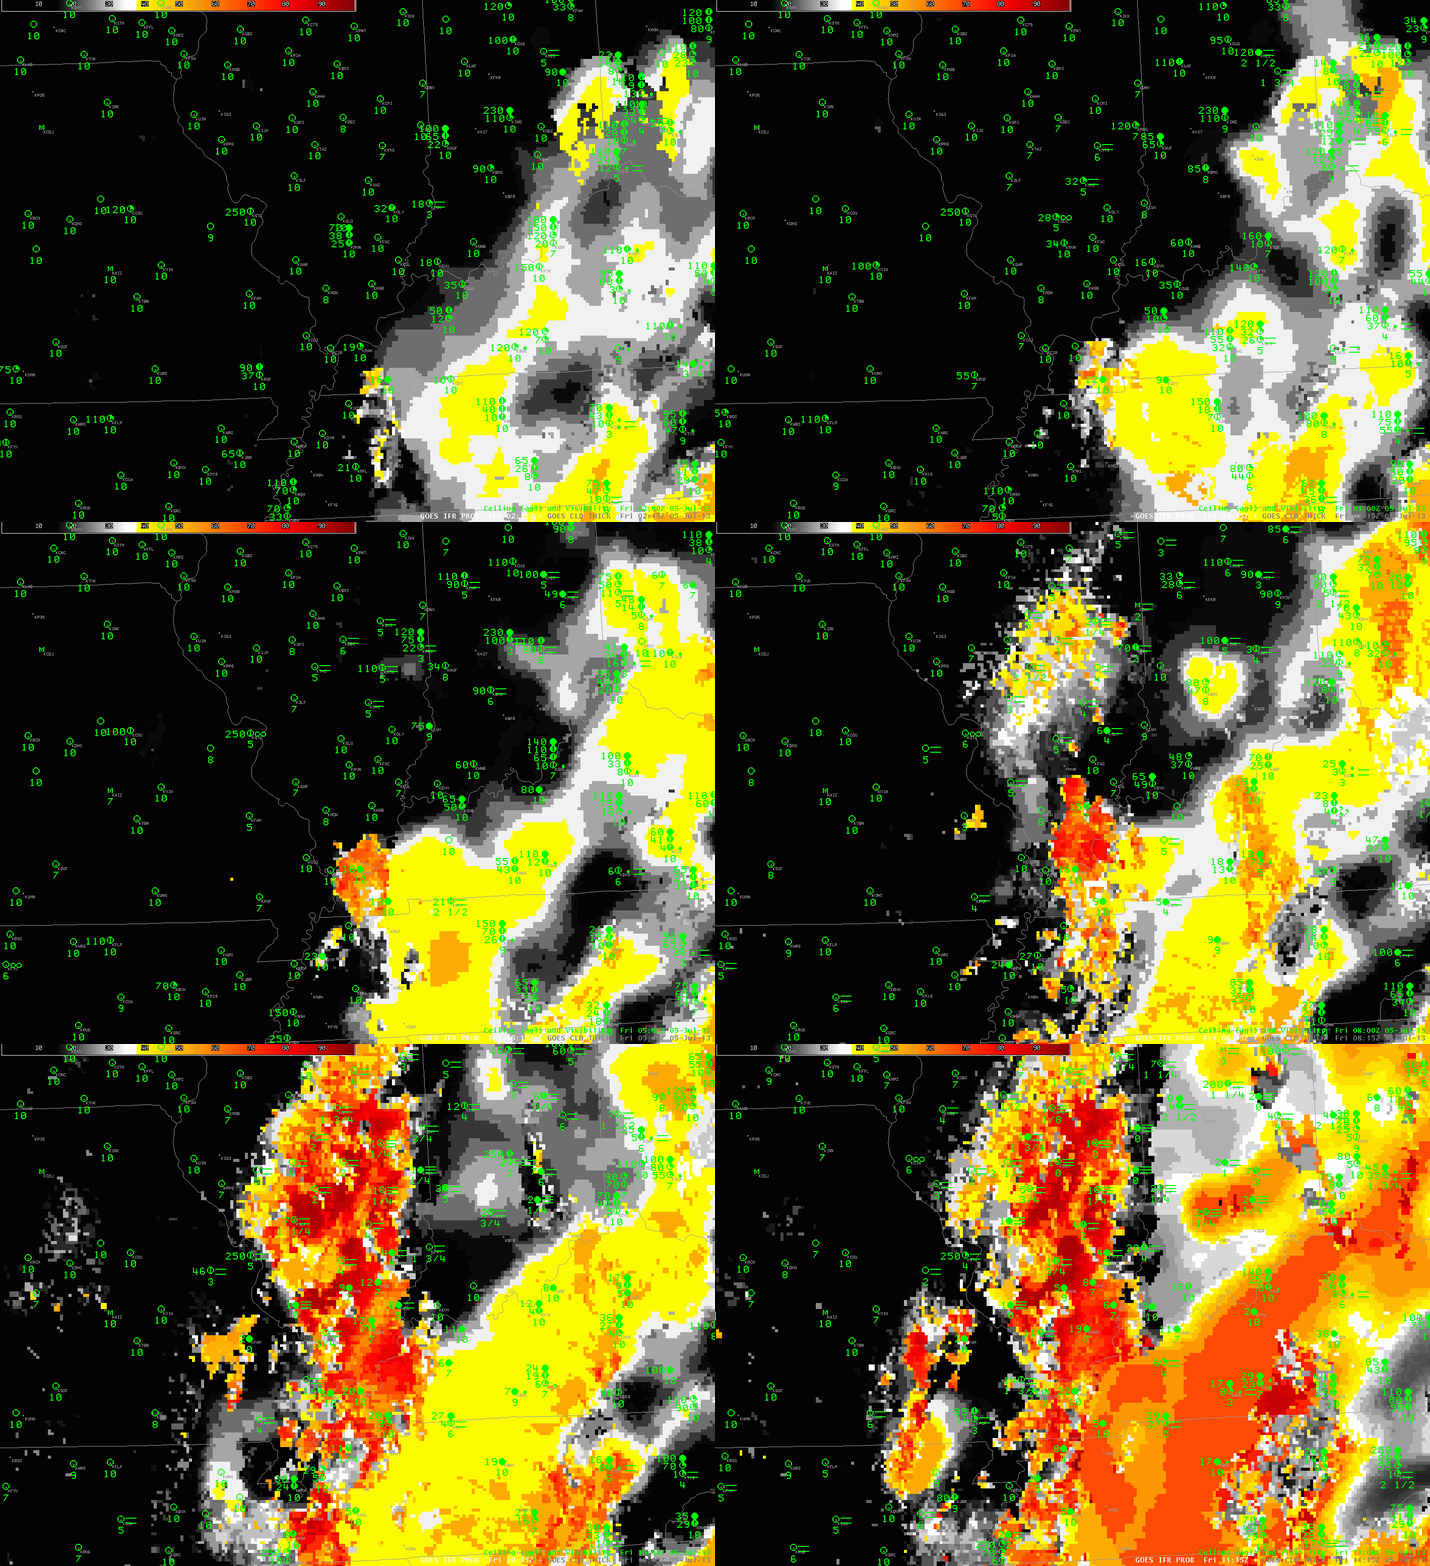
GOES-R IFR Probabilities computed from GOES-East, hourly from 0215 UTC through 1115 UTC on July 5 2013

GOES-R IFR Probabilities show a characteristic increase over central Illinois as radiation fog develops in the early morning hours of July 5 2013.  Probabilities are initially low, but gradually increase, and spread, as the fog develops.  The IFR probability field over Tennessee, Indiana and Kentucky has the characteristic flat look of a field produced mainly from model fields:  the probability field is flat, and IFR probabilities are low.  There are regions — such as near Nashville at the end of the animation — where the field includes satellite data;  IFR Probabilities there are larger and the IFR Probability field has a more pixelated appearance.

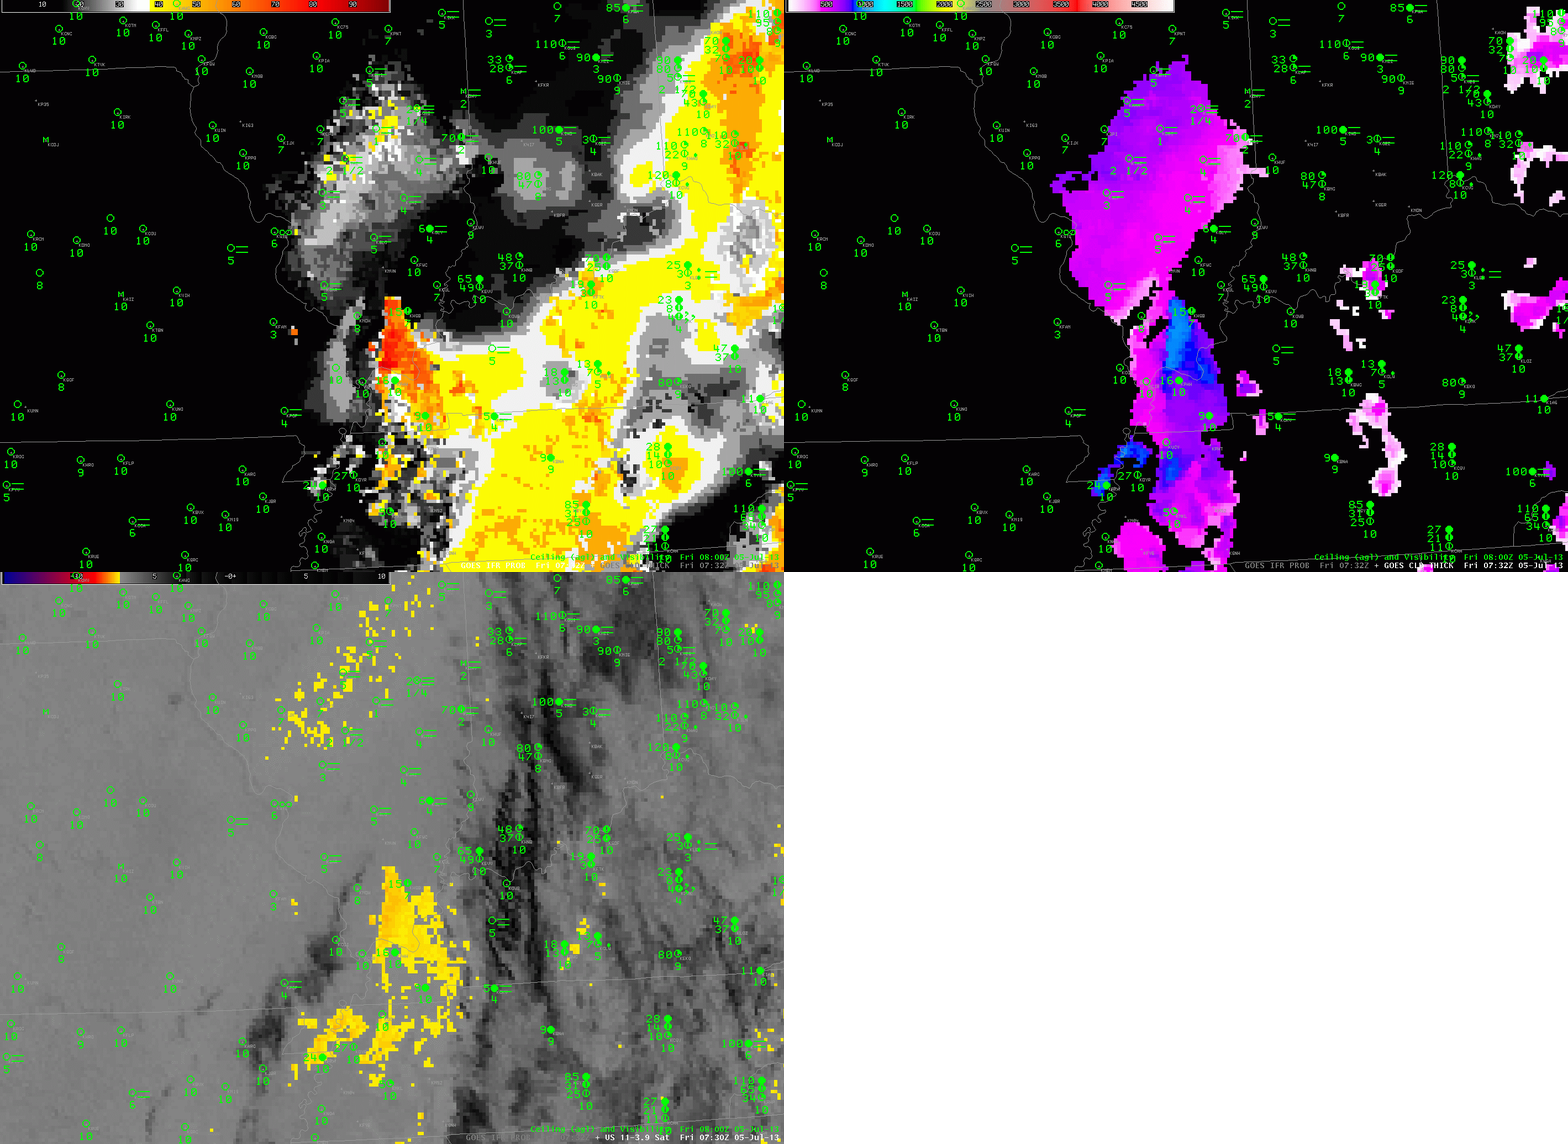
If multiple cloud layers are present, you should not expect the GOES-R Cloud Thickness product to yield a value.  GOES-R Cloud Thickness diagnoses the thickness of the highest water-based cloud in non-twilight conditions.  If ice clouds (or mixed phase) clouds are present, cloud thickness will not be computed.  The toggle below shows cloud thickness, GOES-R IFR Probabilities, and the Brightness Temperature Difference (10.7 µm – 3.9 µm)

GOES-R IFR Probabilities, GOES-R Cloud Thickness, and GOES-East Brightness Temperature Difference, 0730 UTC on 5 July 2013

There a several things of note in the image above.  IFR Probability field in central Illinois have higher values south of the peak in the brightness temperature difference field, where the lowest visibilities and ceilings are reported.  GOES-R Cloud Thickness is unavailable in regions underneath the high clouds in the eastern part of the imagery — over Tennessee and Kentucky, except where there are holes in the clouds.  Note how these regions of diagnosed GOES-R Cloud Thickness overlap with regions of pixelated GOES-R IFR Probability fields.  In both fields, Satellite data are being used for the computation.

IFR Probability Fields capture back-door cold front in New England

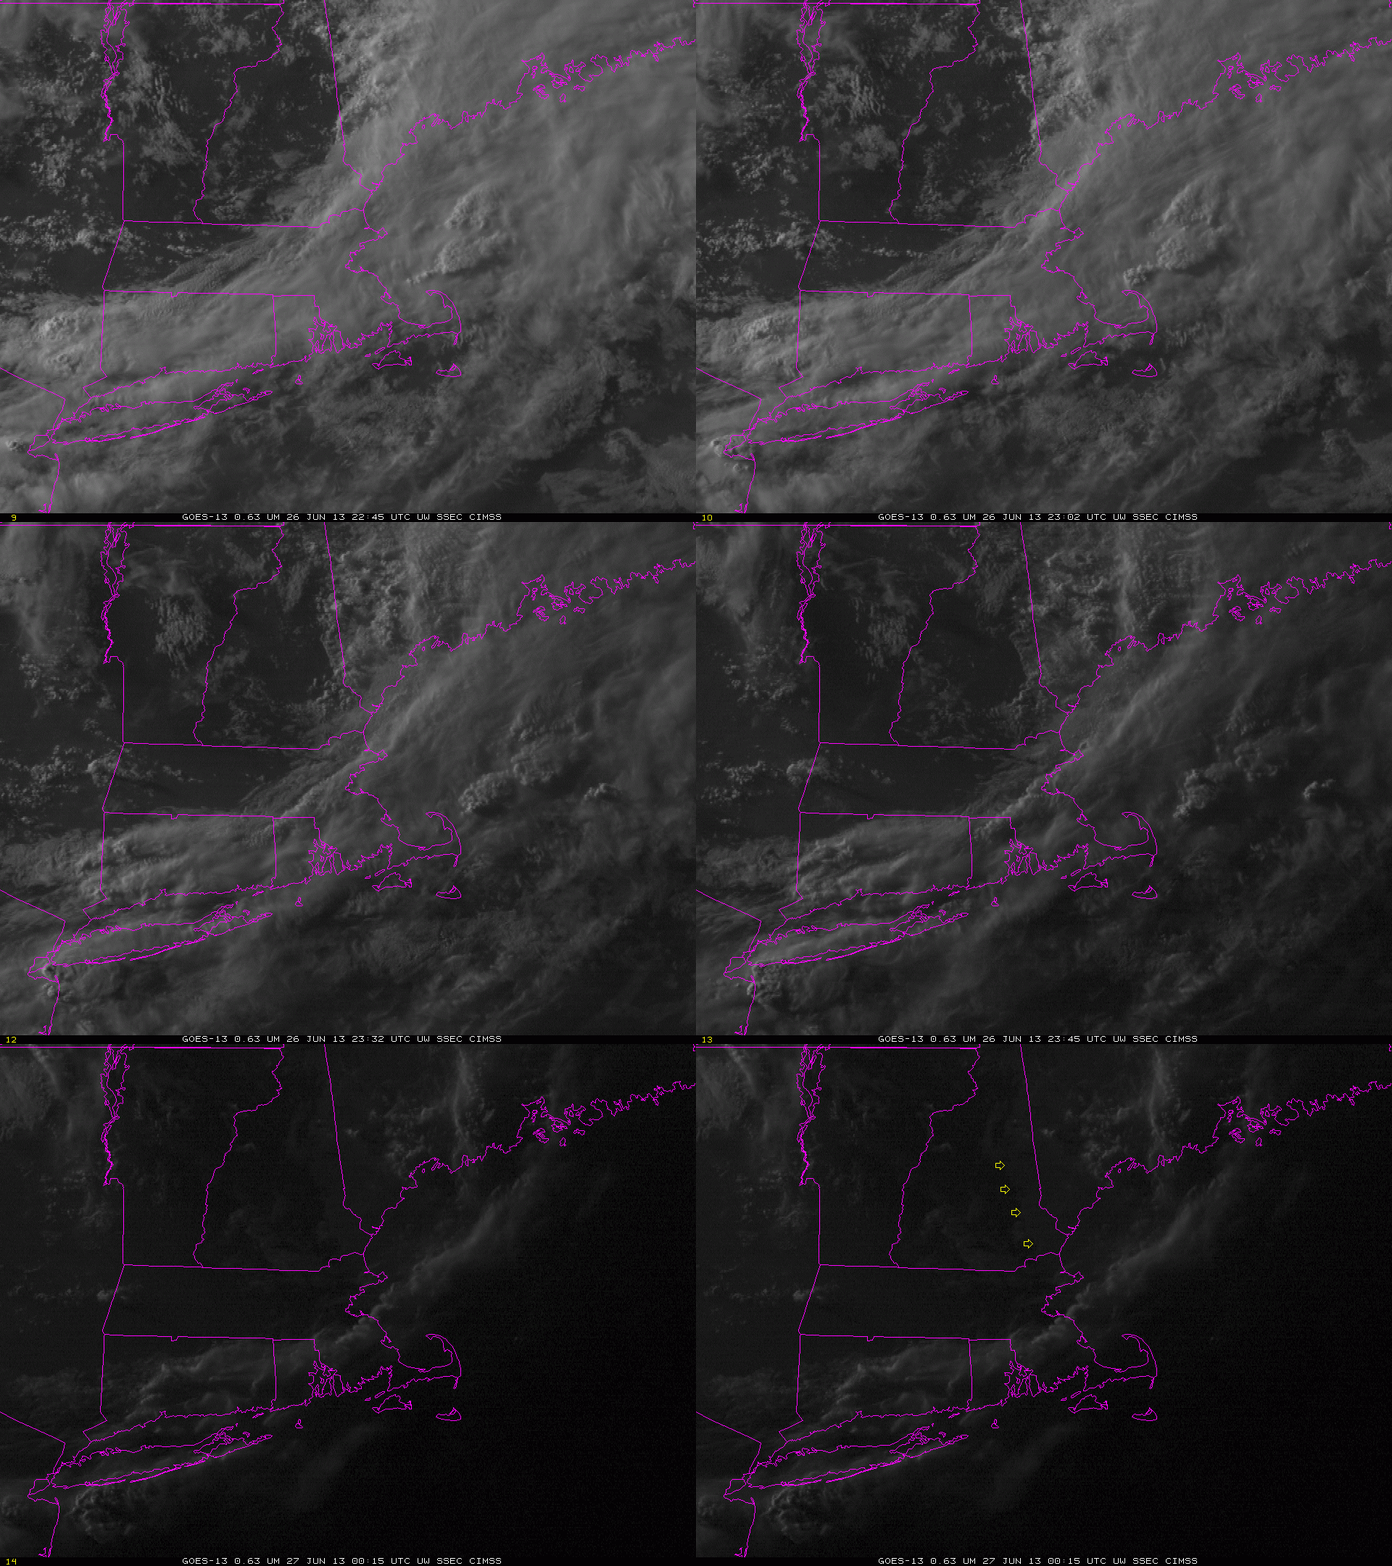
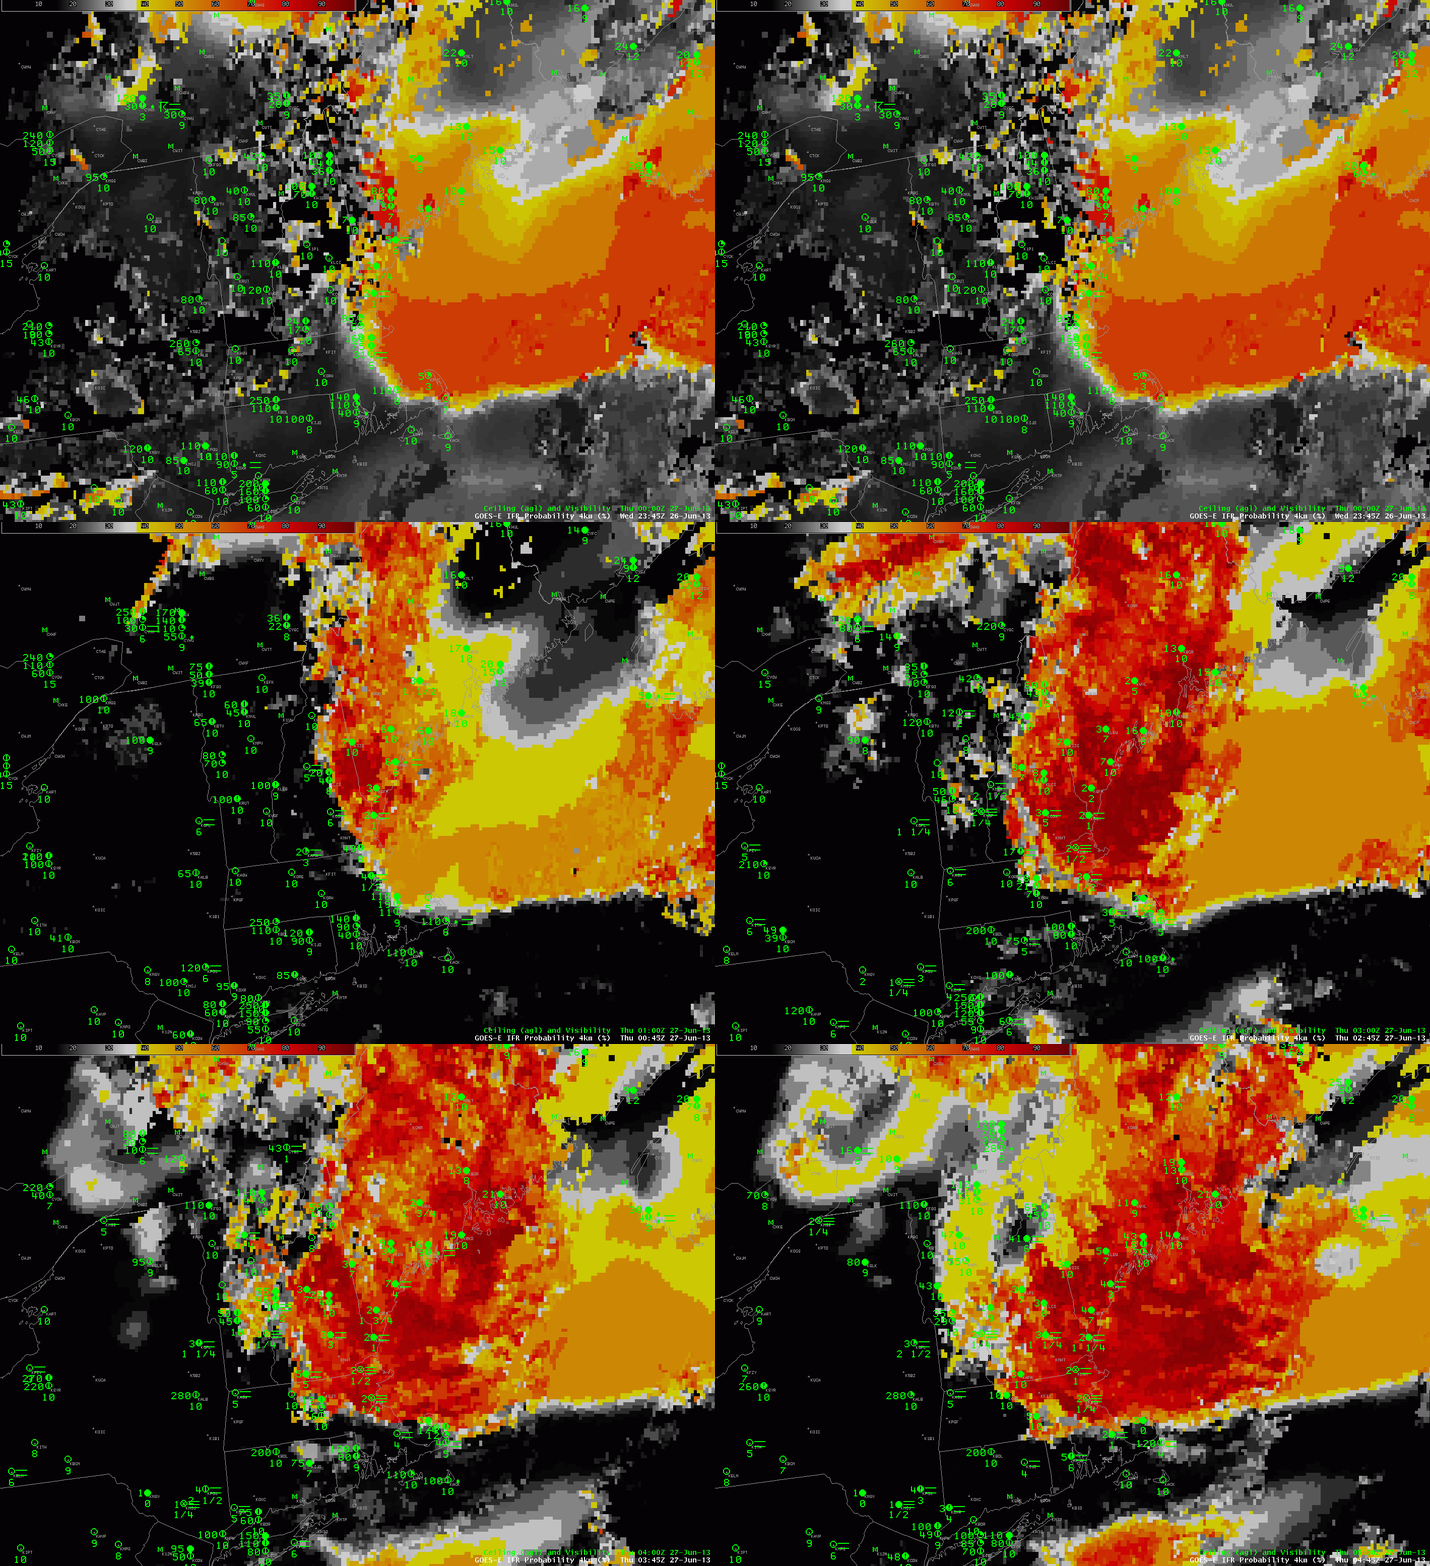
Visible imagery around 0000 UTC on 27 June 2013 showing the slow advance of a backdoor coldfront over eastern New England.  The yellow arrows at the end highlight the front over New Hampshire.

A back-door coldfront moved westward through New England late in the day on June 26th, bringing with it cooler air and lowered ceilings.  How well did the IFR Probability field capture the low ceilings that came with the cooler air?

GOES-R IFR Probability fields computed from GOES-East, hourly from 2345 UTC on 26 June to 0445 UTC on 27 June.

Intially (2345 UTC), high probabilities of IFR conditions were limited to the cold waters east of New England. This is reasonable given the high dewpoints (upper 60s Fahrenheit) that prevailed New England on the 26th.  Light westerly winds would move that moist air over the cold Gulf of Maine, and advection fog would form.  As the backdoor front moved across the region, IFR probabilities increased as visibilities declined.  The animation of the IFR probability fields captures the leading edge of the maritime air.

Low clouds over Louisiana

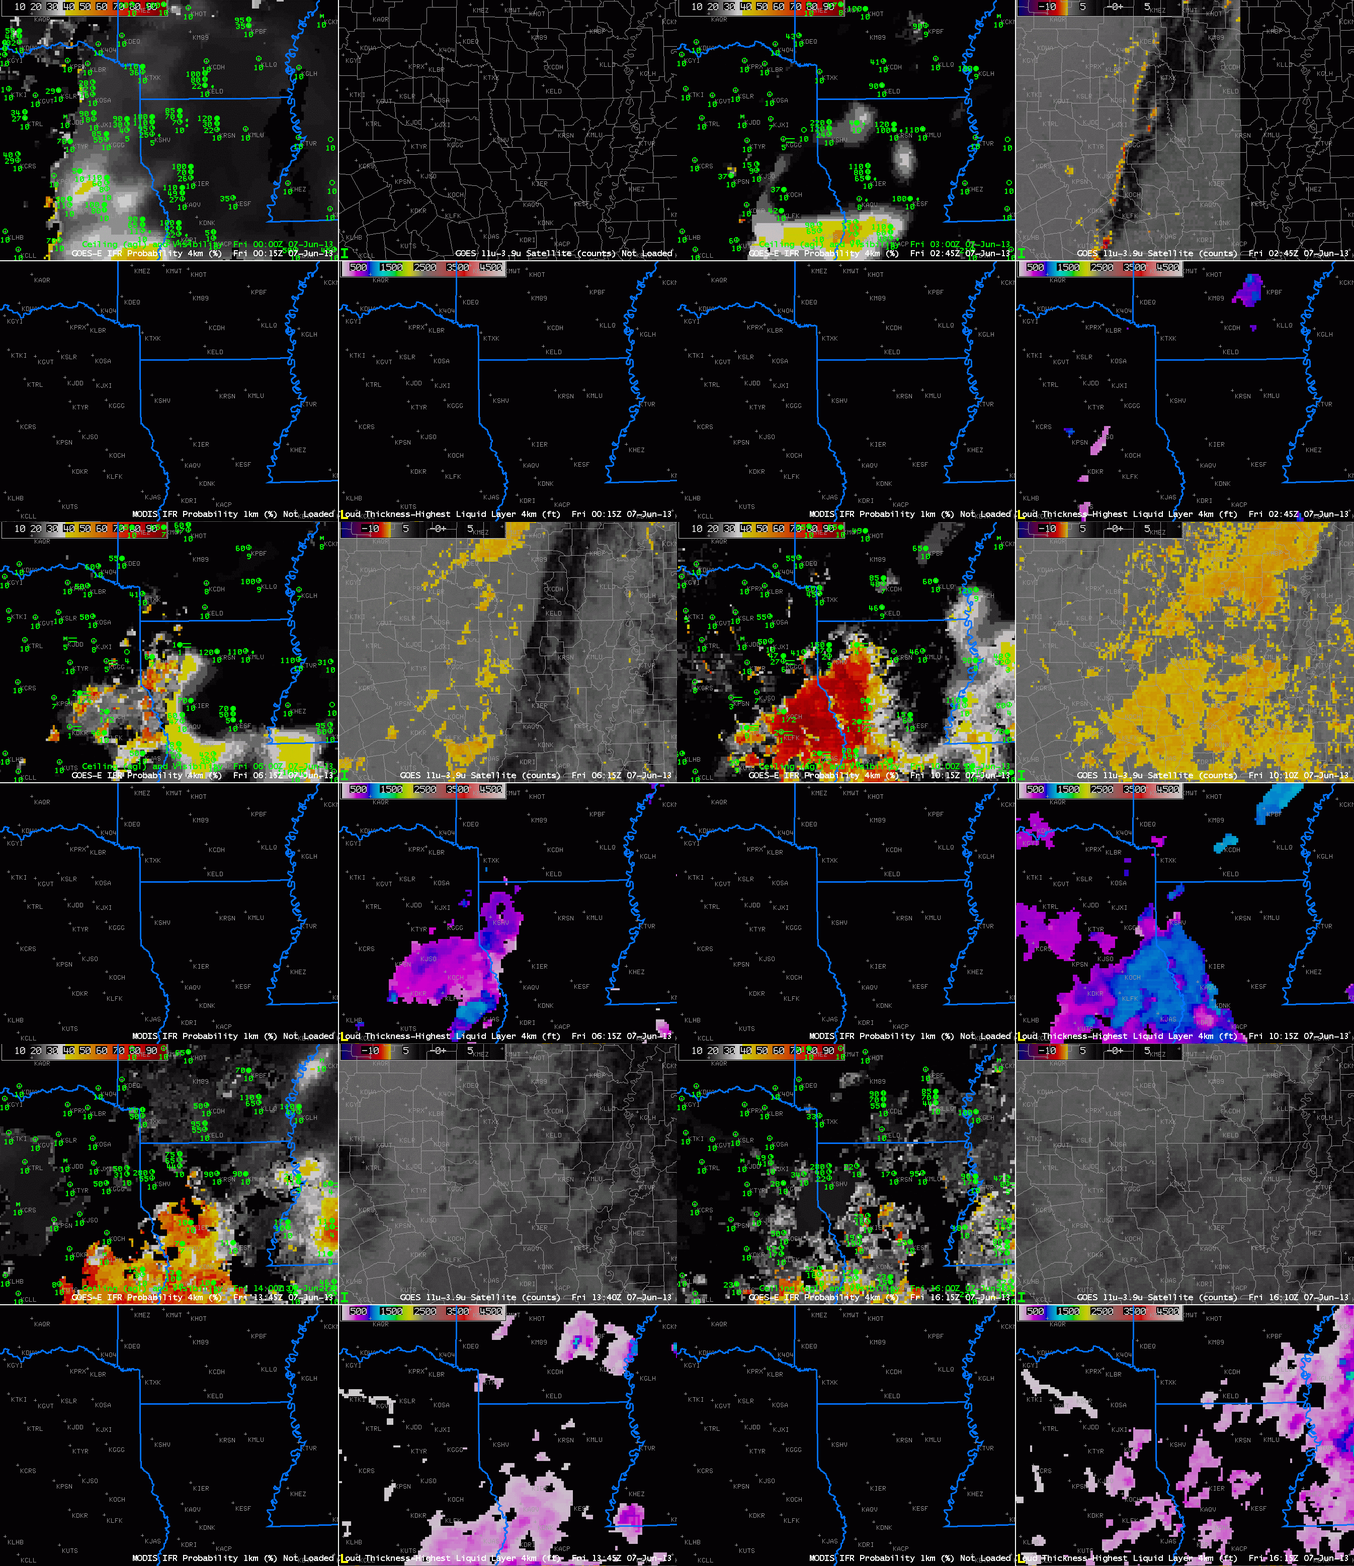
GOES-R IFR Probabilities computed from GOES-East (Upper Left), GOES-East Brightness Temperature Difference (Upper Right), GOES-R IFR Probabilities computed from MODIS data (Lower Left), GOES-R Cloud Thickness computed from GOES-East (Lower Right), every half hour from 0015 UTC to 1615 UTC on June 7 2013

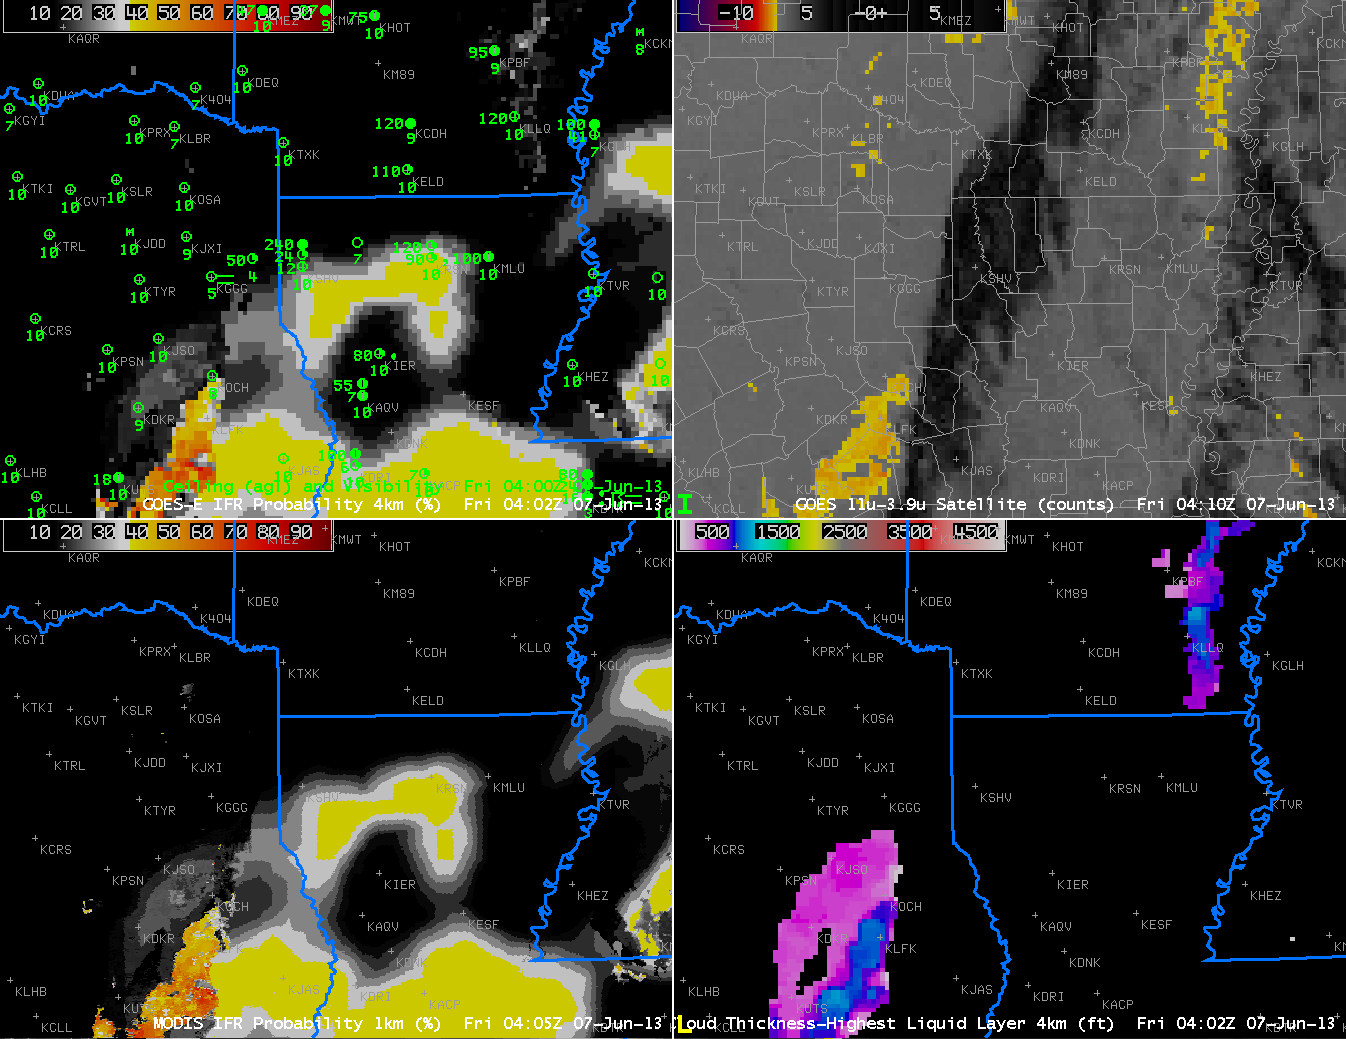
GOES-R IFR Probabilities are shown for northwest Louisiana and surrounding states.  At the beginning of the animation, GOES-R fields are mostly model-based over much of Louisiana — the north-south oriented edge of high clouds is plain in the brightness temperature difference field starting around 0315 UTC, and the GOES-R IFR Probability field over Louisiana has the characteristic flat look of a field produced from mostly model (Rapid Refresh) data.  Note also that the Cloud Thickness product is not shown when high clouds are present.  It is computed only for low clouds in non-twilight conditions.

As the high and mid-level clouds move to the east, two things happen to the GOES-R fields. One, the Cloud Thickness field starts to show values.  And second, the GOES-R IFR Probability field starts to acquire the pixelated character that is common when satellite data are part of the field.

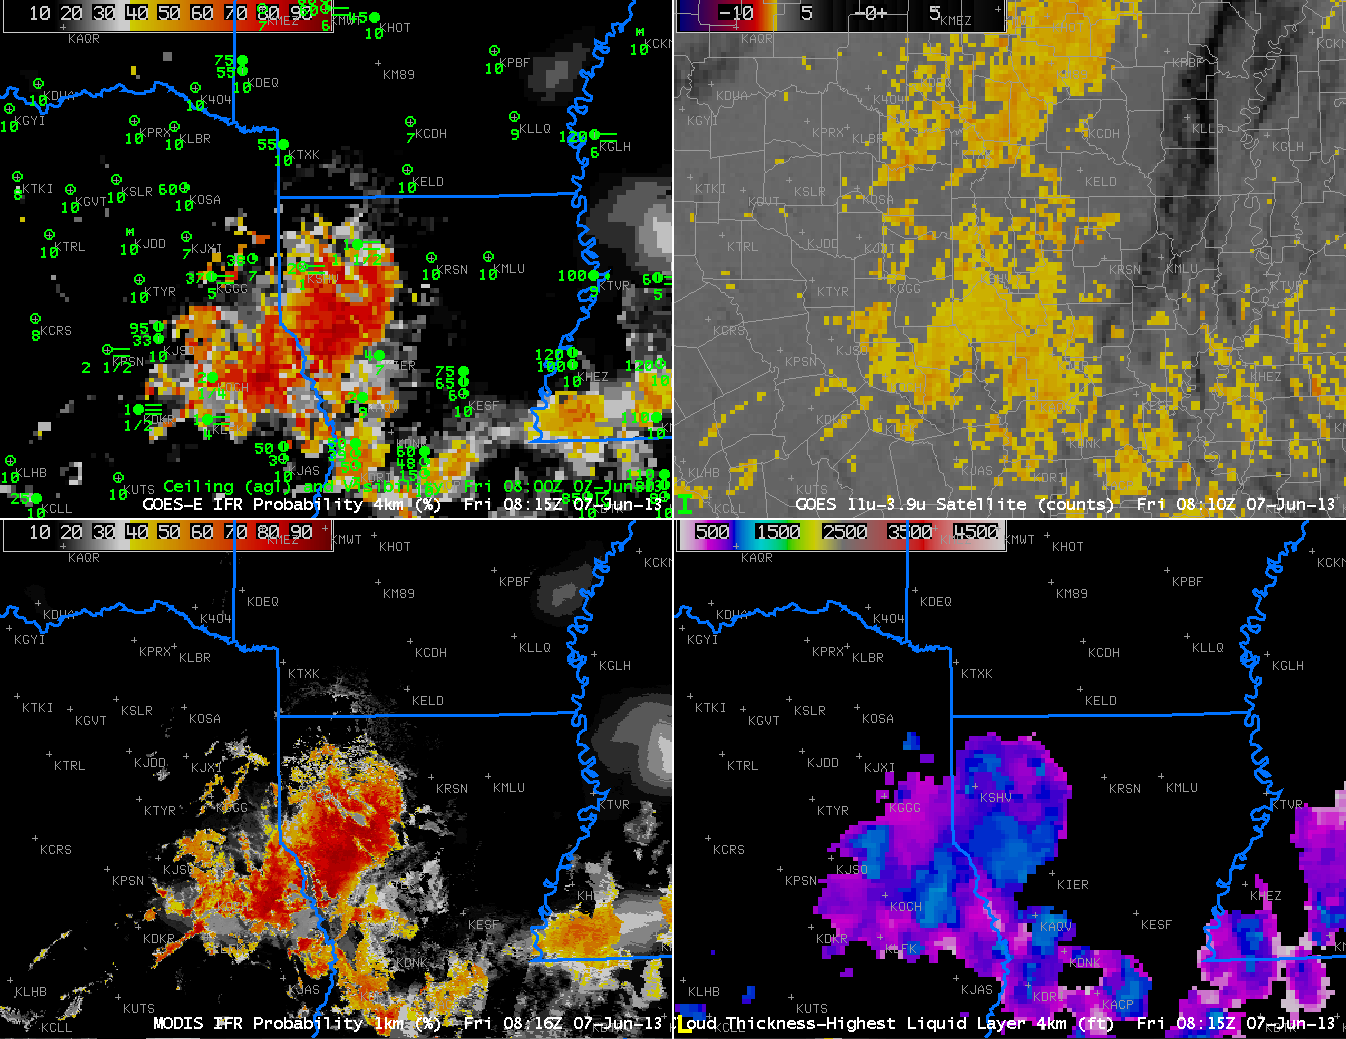
The are of high IFR probabilities is smaller than the region of enhanced brightness temperature difference, which at 0900 UTC covers much of Louisiana and Arkansas.  Over Arkansas, however, model data are de-emphasizing the possibility of reduced surface visibilities.  The low clouds there are stratus, off the ground, not fog.  Thus the IFR probability field gives a more accurate representation of where visibility restrictions at the surface are possible.  This is an important consideration in aviation forecasting.

As above, but for 0400 UTC (top) and 0815 UTC (bottom)

IFR Probabilities computed from MODIS data (lower left) show very similar areal coverage compared to the GOES-Based IFR probability fields, but small-scale variations in the field are much more evident, as should be expected given the difference in pixel footprint between the two satellites.

Advection fog over the Northeast as a front moves through

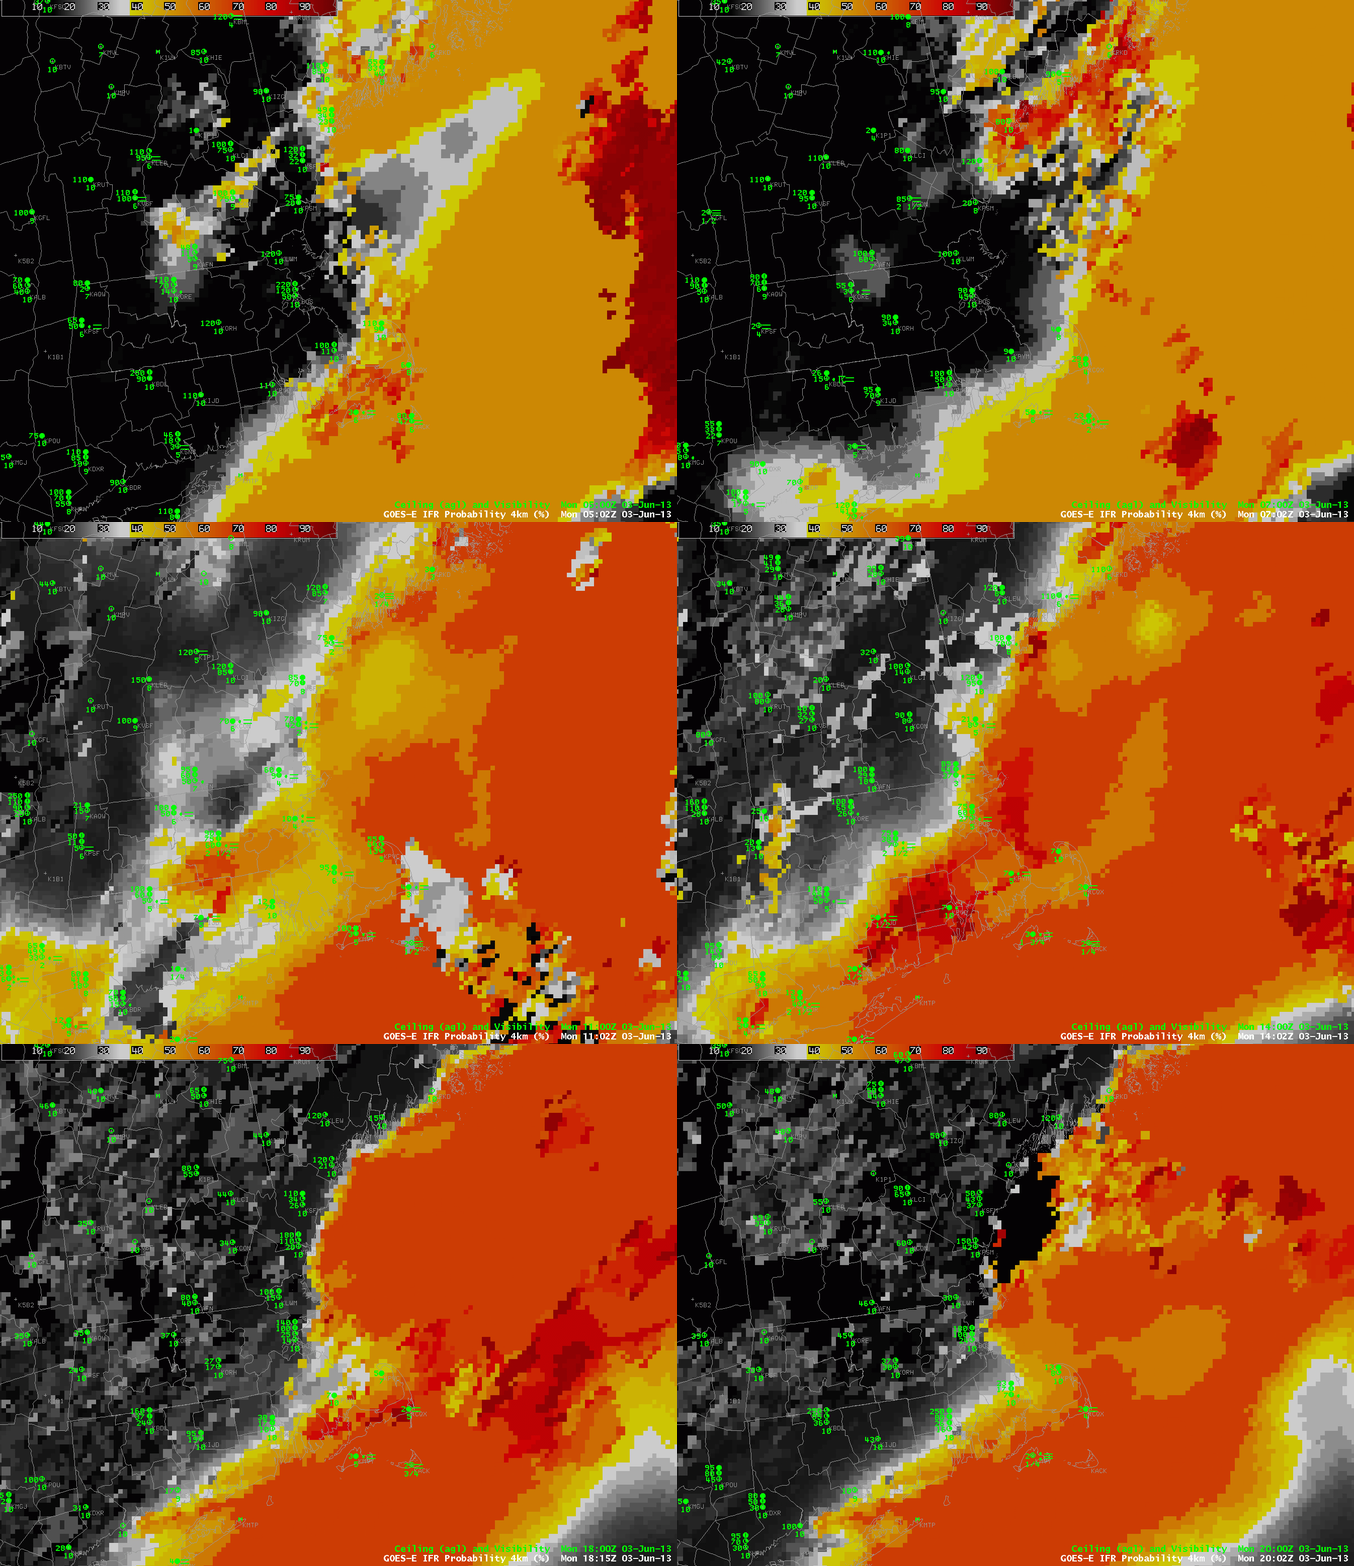
GOES-R IFR Probabilities, hourly, from 0500 UTC through 2002 UTC 3 June 2012

A cold front moving through eastern New England has drawn 60-degree dewpoints into that region of the country.  When that moist air then moves over the cold shelf waters and cold waters of the Gulf of Maine, fog and low stratus develop.  The GOES-R IFR Probability Field ably captures the regions of restricted visibility over coastal and offshore New England.  It also depicts the sharp northern edge of the restricted visibilities over Connecticut and Rhode Island.  The IFR probability field in the animation above is derived mostly from model data;  this is evident from the smooth nature of the field.  There are regions that are more pixelated within the smooth field.  These are regions where holes in the high cloud field associated with the front allow the satellite to see low water-based clouds.

Identifying regions of fog underneath multiple cloud layers

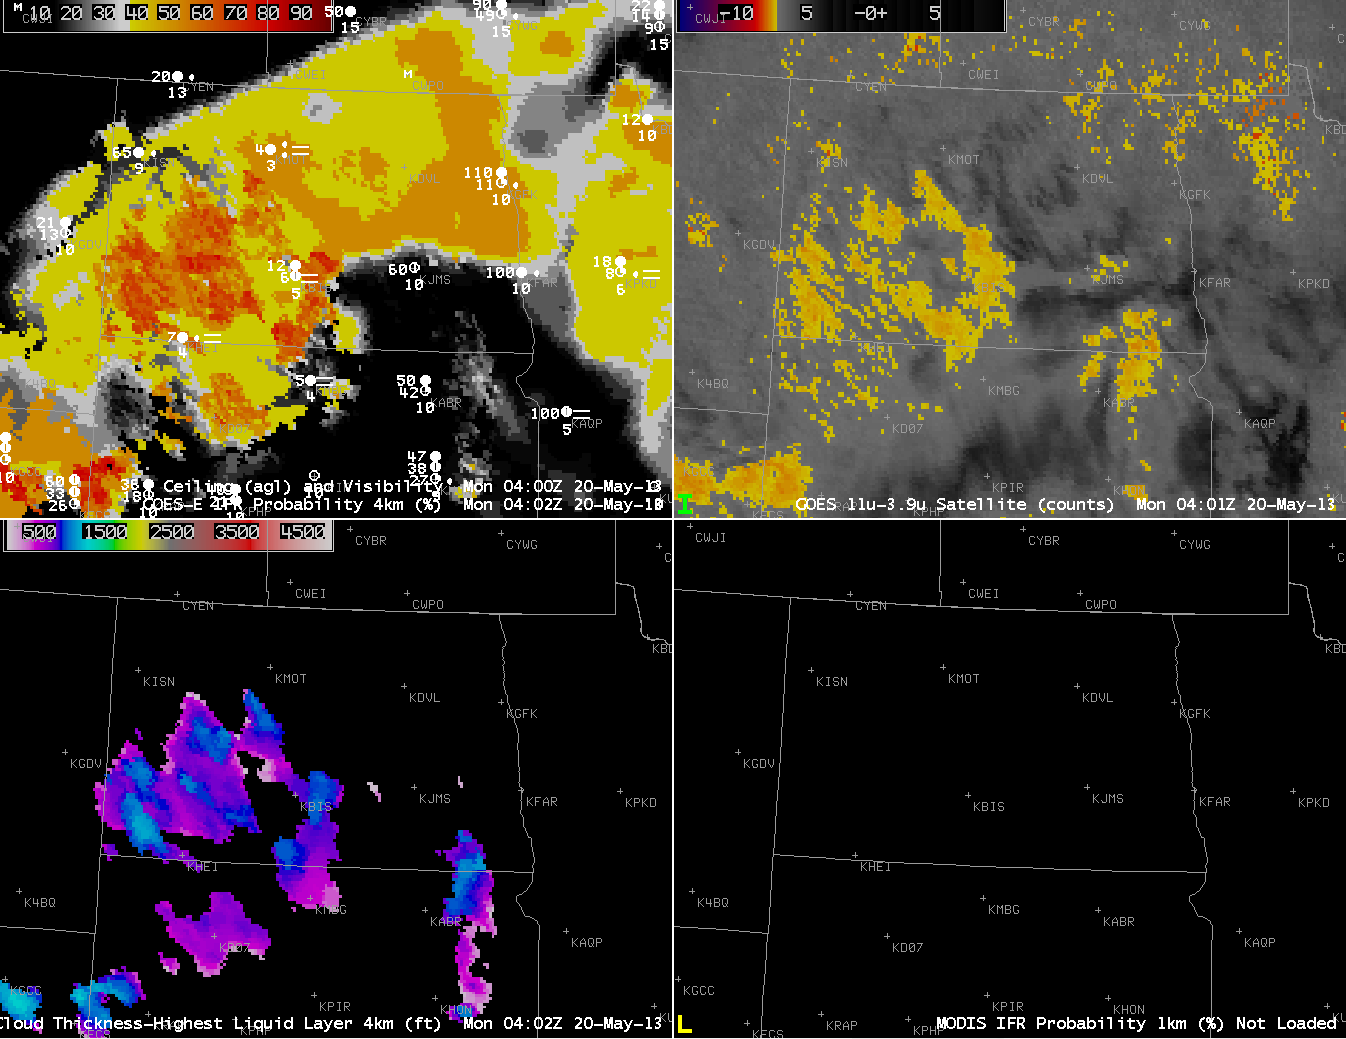
GOES-R IFR Probabilities computed from GOES-East (Upper Left), GOES-East Brightness Temperature Difference (10.7 µm- 3.9 µm) (Upper Right), GOES-R Cloud Thickness (Lower Left), GOES-R IFR Probabilities computed from MODIS (Lower Right).  All imagery around 0400 UTC 20 May 2013

When multiple cloud layers are present, the traditional method of detecting fog, the brightness temperature difference between the 10.7 µm and 3.9 µm channels on the GOES Imager, will fail.  For such a configuration of clouds, the GOES-R IFR Probability field will yield information because it also uses information from the Rapid Refresh model to predict whether fog is possible.  The image above contains regions where both model and satellite data are used to compute the IFR probability, and where model data only are used.  How can you differentiate between the two?

Regions over southwest North Dakota are not overlain by high clouds.  In those regions, a strong signal in the brightness temperature difference fields is present.  There is also a north-south oriented signal over extreme southeast North Dakota and northeast South Dakota.  In both of those regions, the Cloud Thickness product is predicting a thickness.  Such a prediction works only when low clouds are visible by the satellite.

The GOES-R IFR Probability field, in the upper left, contains regions where both satellite and model are used (and these mostly overlay the regions where the Cloud Thickness field is present) and where only model data are used (because the satellite signal for low clouds is blocked by mid- and high-level clouds).  The horizontal homogeneity of the field over northeast North Dakota is characteristic of GOES-R IFR Probability fields that are determined largely by model data only.  Compare that to the more pixelated field over southwest North Dakota where Cloud Thickness fields are also computed:  Pixelation is a hallmark of the use of satellite data in the prediction of the IFR Probability.

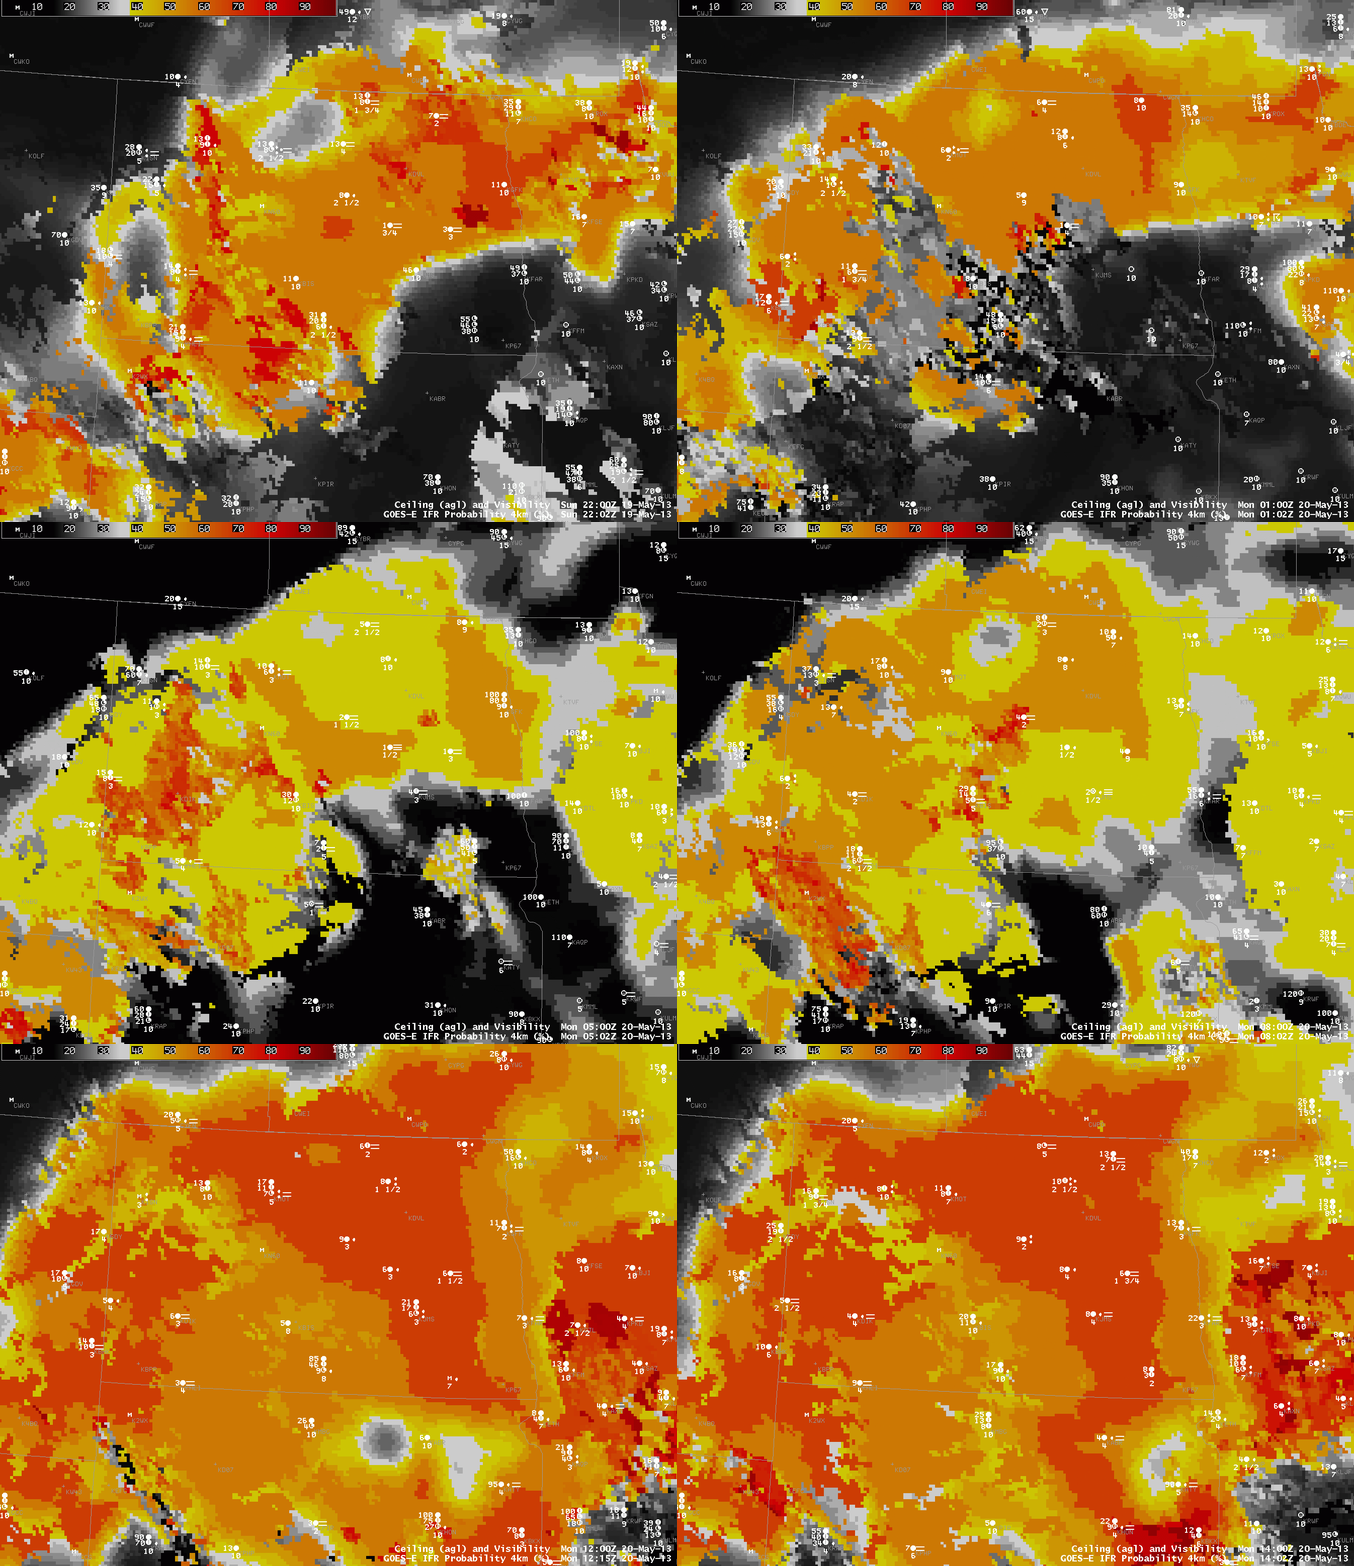
Hourly evolution of GOES-R IFR Probability (with surface plots of ceiling/visibility) over North Dakota, 2202 UTC 19 May through 1402 UTC 20 May 2013

The GOES-R IFR probability field accurately depicts the region of IFR conditions over northeast North Dakota that is separate from southeast North Dakota where higher ceilings/visibilities are present.  (Consider the observations at Jamestown, ND (KJMS), for example).  As nighttimes progresses, IFR probabilities increase over most of the state.  The switch from daytime predictors (initially) to nighttime predictors is apparent in the 0202 UTC image (the terminator slants southwest to northeast).  The switch back to daytime predictors occurs between the 1102 UTC and 1215 UTC imagery.

Fog over coastal North Carolina

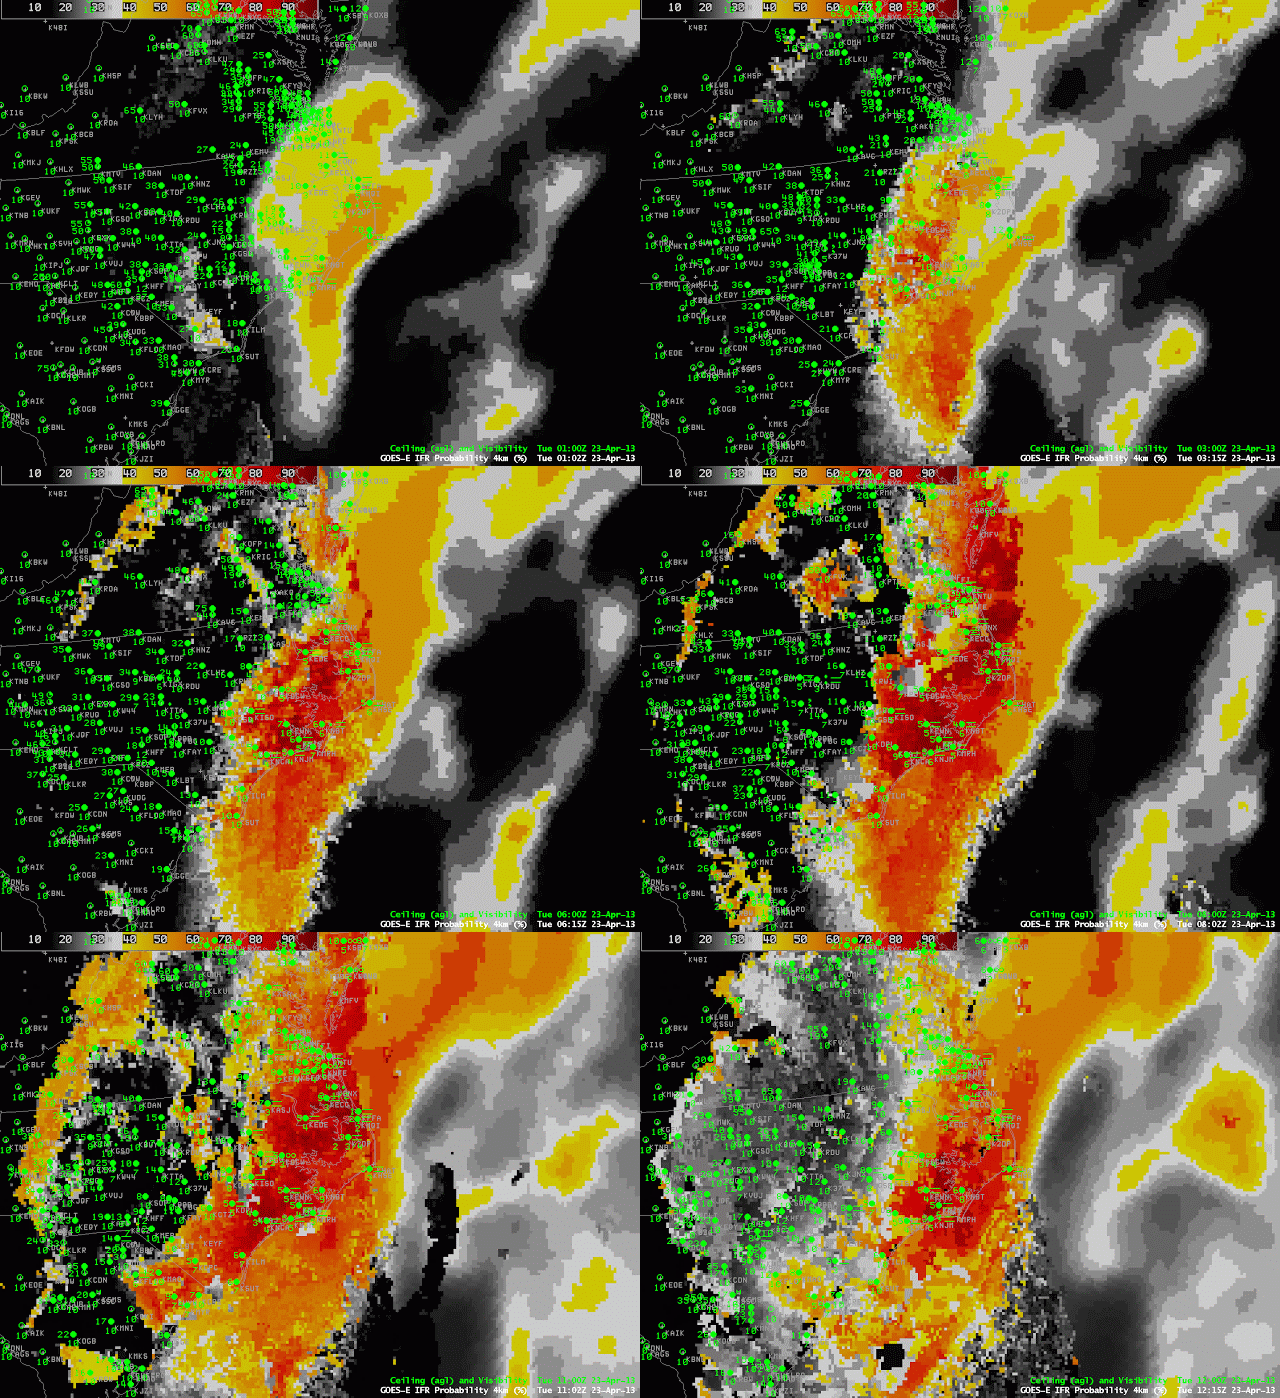
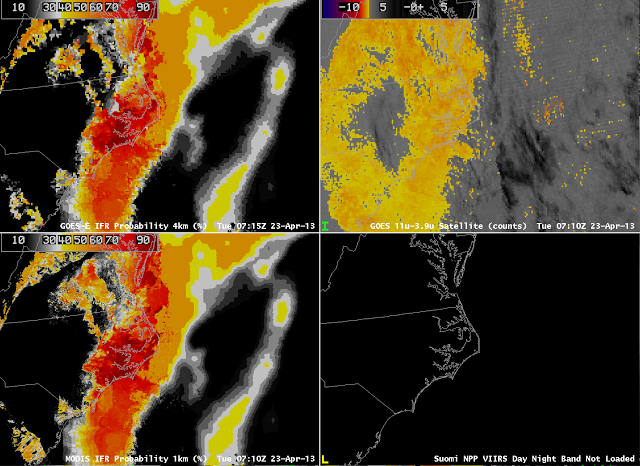
GOES-R IFR Probabilities computed from GOES-East data, hourly from 0100 through 1200 UTC, 23 April 2013

A coastal storm along the east coast was responsible for low-level moisture over eastern North Carolina that resulted in IFR conditions.  Multiple cloud layers in the beginning of the animation above mean that IFR probabilities were computed using model data.  By 0315 UTC, however, upper level clouds had moved off the coast, leaving behind clouds at low layers that meant cloud data (brightness temperature difference) could influence the IFR probability fields;  consequently, the probability increased.  High clouds remained offshore, however, and the character of the IFR probability field shows the characteristic pixelated appearance over land — where satellite data are used in the computation of IFR probabilities — and the characteristic smoothed appearance over water where only model data are used to produce IFR probabilities.  Note how the highest IFR probabilities over eastern North Carolina do overlap the stations reporting IFR and near-IFR conditions.

GOES-R IFR Probabilities (Upper Left) computed using GOES-East, GOES-East Brightness Temperature Difference (10.7 µm- 3.9µm) (Upper Right), GOES-R IFR Probabilities computed using MODIS data (Lower Left).  All for times around 0715 UTC 23 April

The image above compares GOES-R IFR probabilities computed with MODIS and with GOES-East.  They do show very similar overall structures, with highest probabilities over land where the Brightness Temperature Difference field can contribute to the probability, and lower, smoother probability fields over water where only model data are used.  Note that both GOES-R IFR fields correctly ignore the low cloud signal over eastern South Carolina and central North Carolina.

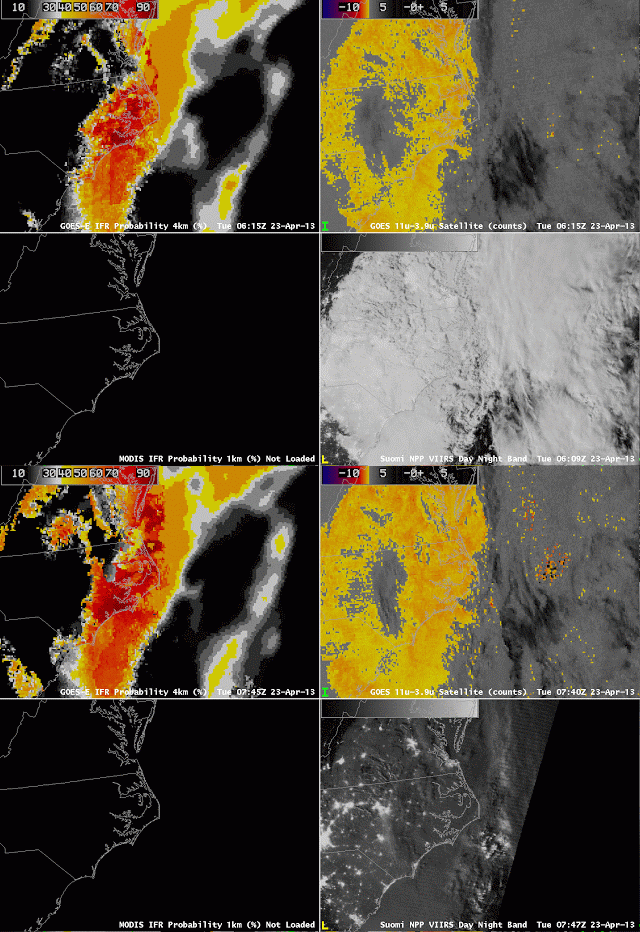
GOES-R IFR Probabilities (Upper Left) computed using GOES-East, GOES-East Brightness Temperature Difference (10.7µm – 3.9µm) (Upper Right), Suomi/NPP Day/Night band from VIIRS (Lower Right).  Toggle for times 0615 and 0745 UTC 23 April

The GOES-based IFR probability field can also be compared to the Day/Night band sensed by VIIRS on board Suomi/NPP.  The 0609 UTC Day/Night band shows the effects of a near-full moon on the product.  The extensive cloud shield east of the Appalachians is visible, even though the image is at night, because of strong lunar illumination.  As with the traditional brightness temperature difference field, however, the cloud information from the Day/Night band gives little information about the cloud bases;  for that, the IFR probability field is needed, and low cloud bases are correctly restricted to extreme eastern North Carolina.  The Day/Night band at 0747 UTC is from a time after the moon has set;  only city lights and airglow are illuminating the clouds over Virginia and the Carolinas.  Cloud edges are still easily discerned.

Stratus over Missouri, low clouds over Ohio

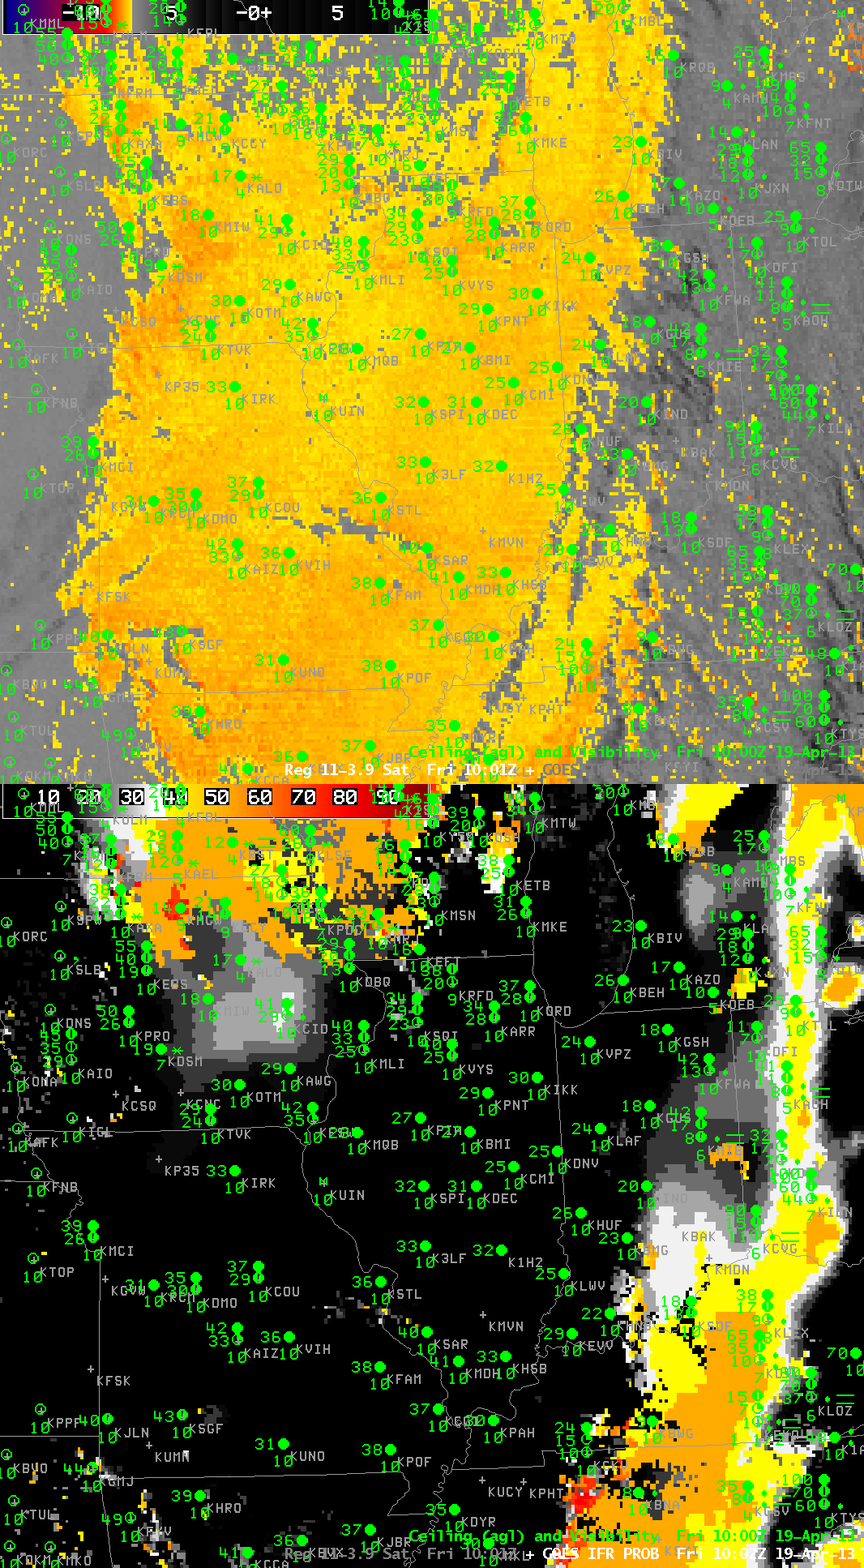
Toggle between the traditional brightness temperature difference field from GOES-East and the GOES-R IFR Probabilities, 1000 UTC on 19 April 2013

A significant shortcoming to the traditional method of detecting fog, the brightness temperature difference between 10.7 and 3.9 microns, which difference arises because of differences in the emissivity properties of water-based clouds at the two wavelengths, is that stratus decks and fog banks look very similar when viewed from a satellite.  In this example from early morning on April 19th, low-level moisture trapped near the surface behind a significant rain-producing cyclone has allowed the formation of clouds over Missouri.  But the brightness temperature difference field cannot say if these clouds are an aviation hazard.  The surface observations of ceilings and visibilities show that ceilings are high and visibilities are unobstructed.  The GOES-R IFR probability field correctly minimized the influence of the satellite signal in this region, because the Rapid Refresh Model does not predict conditions consistent with fog and low stratus.

There are reduced visibilities and lowered ceilings near the cold front that at 1000 UTC was pushing into western Ohio, and these are correctly suggested by the IFR probability fields.  Multiple cloud layers there preclude the detection of low-level clouds by the traditional brightness temperature difference method.

In this case, the IFR Probabilities did a good job of eliminating the false positive from the brightness temperature difference over Missouri — where IFR conditions were absent — and of rectifying the false negative from the brightness temperature difference over Ohio — where IFR and near-IFR conditions were found.

IFR Conditions surround Chicago’s O’Hare Airport

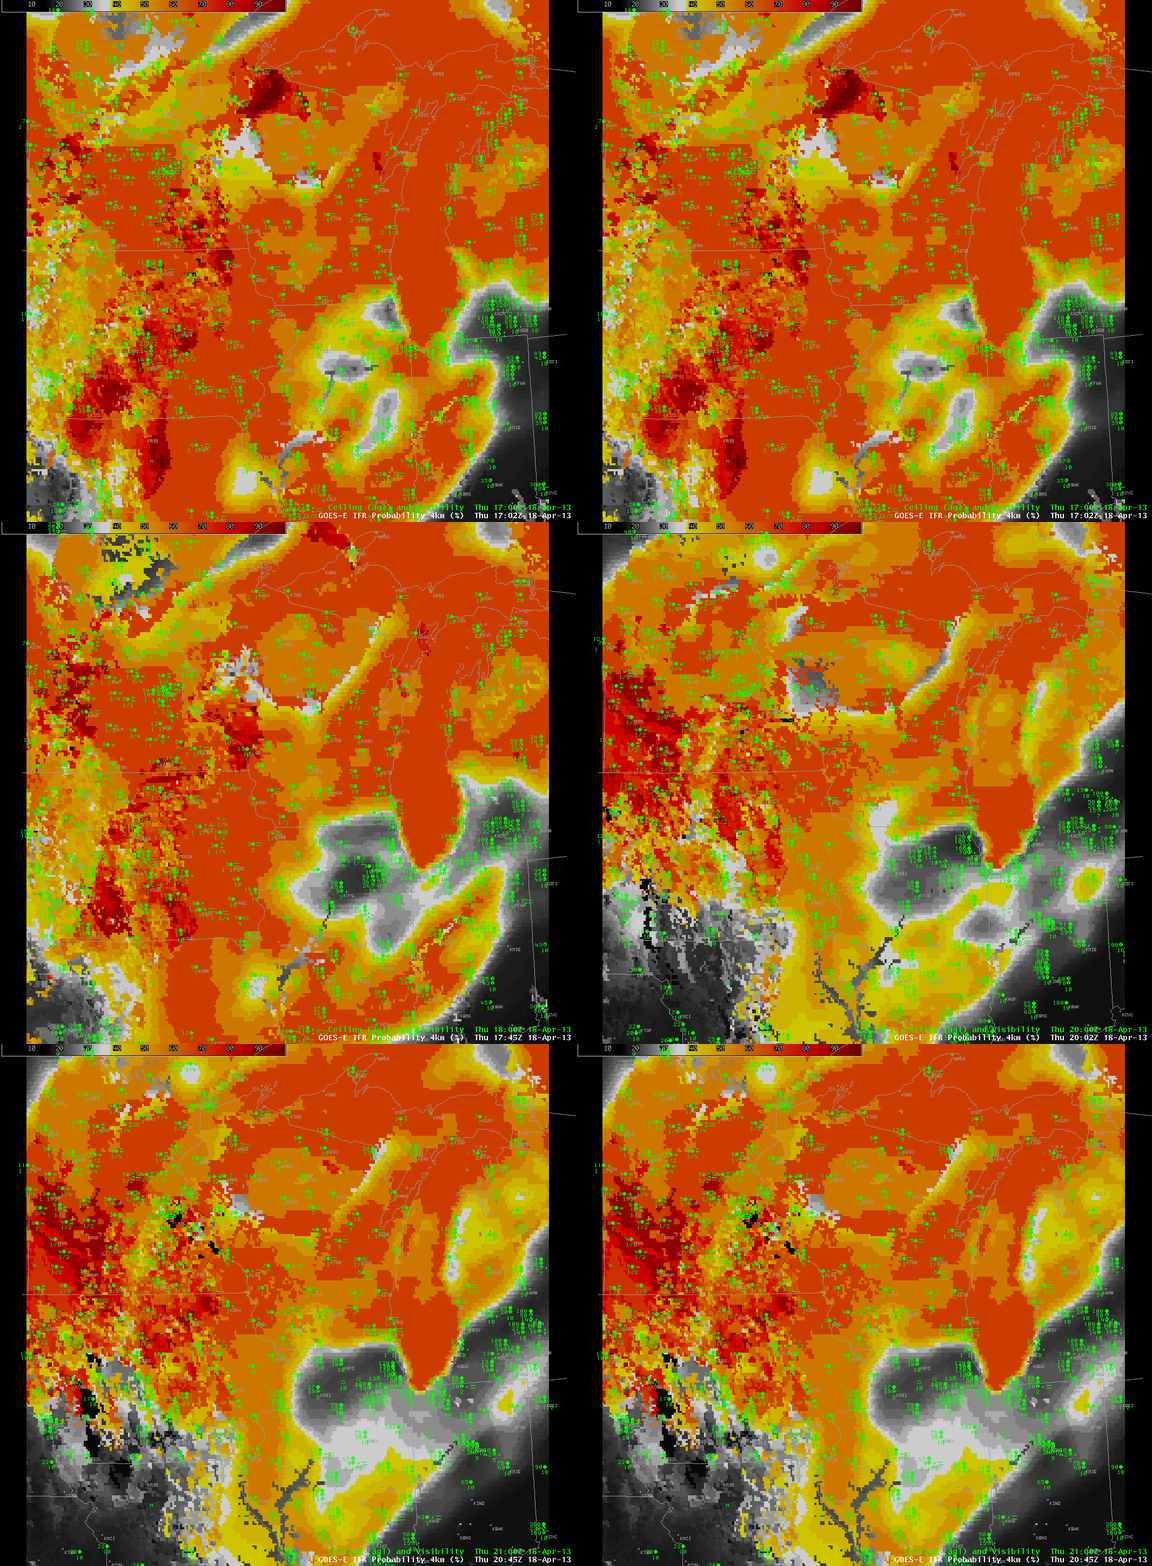
GOES-R IFR Probabilities and Surface Observations of ceilings and visibilities, hourly from 1700 through 2100 UTC, 18 April 2013

Chicago O’Hare is a busy hub airport, and obstructions to visibility there have a great impact on air routing.  Thus, any tool that can give information about ceilings and visibilities — IFR conditions — can help.  In this animation from late afternoon on April 18, 2013, IFR Probabilities show a distinct minimum over northeast Illinois, and surface observations from airports in that region are consistent with the lack of low ceilings.  In contrast, higher IFR probabilities exist over Wisconsin, where IFR conditions are widespread.  IFR probabilities are high over Lake Michigan because high dewpoint air is moving over still-cold lake waters;  advection fog results.