
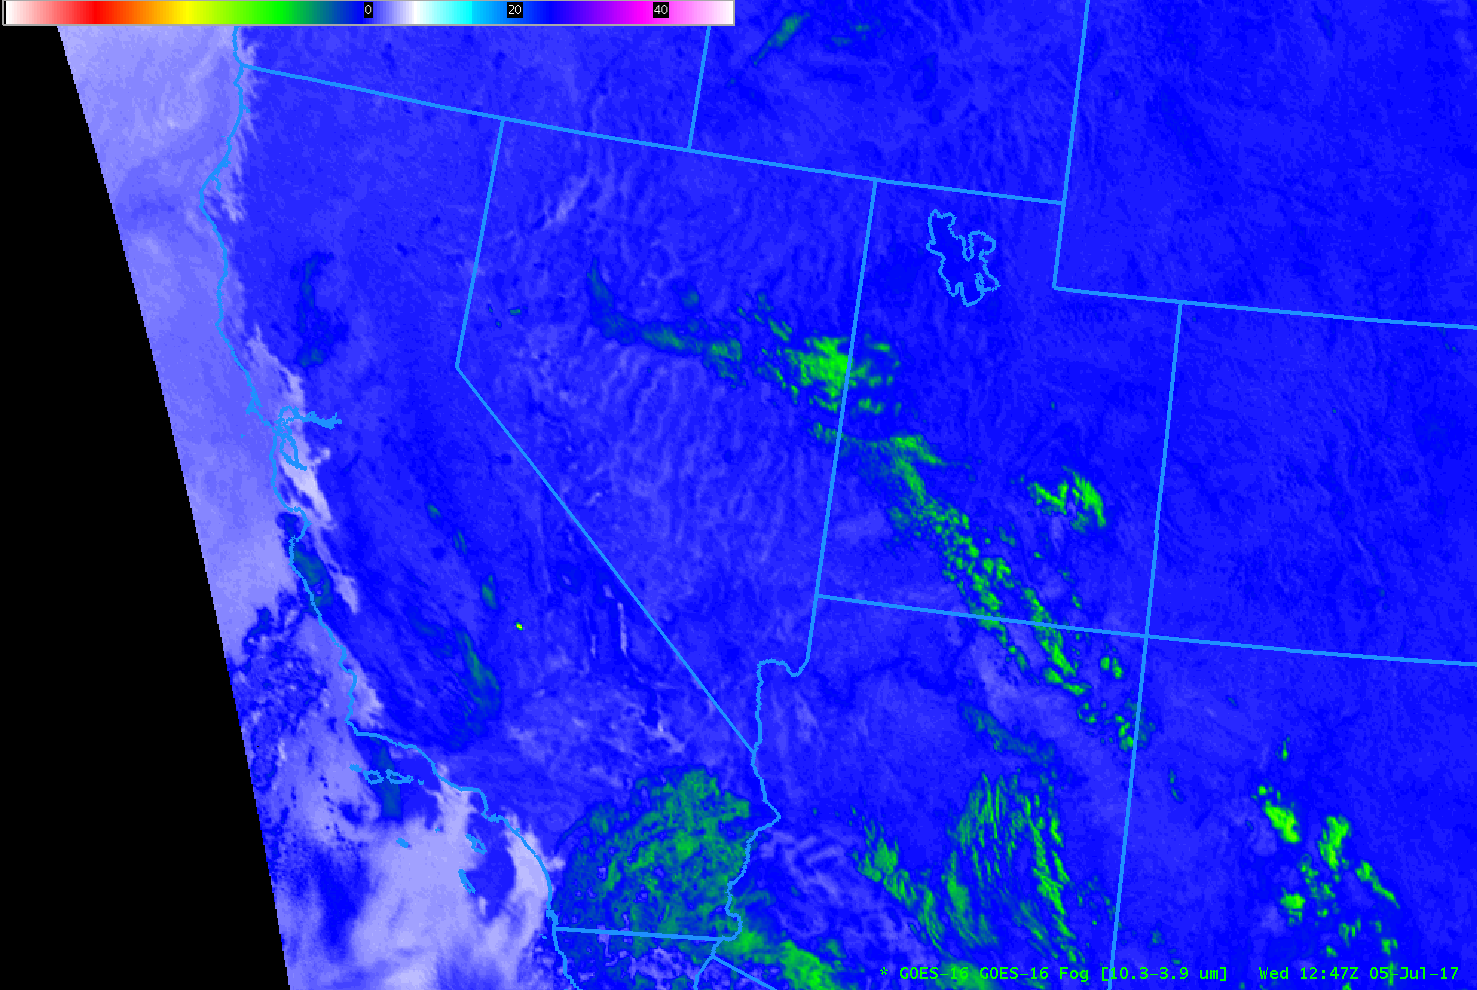
GOES-16 Brightness Temperature Difference field (10.3 µm – 3.9 µm) at 1247 UTC on 5 July 2017 (Click to enlarge)
GOES-16 data posted on this page are preliminary, non-operational data and are undergoing testing
GOES-R IFR Probabilities are computed using Legacy GOES (GOES-13 and GOES-15) and Rapid Refresh model information; GOES-16 data will be incorporated into the IFR Probability algorithm in late 2017
GOES-R IFR Probability fields continue to be created using legacy GOES (GOES-13 and GOES-15) data. This is slated to continue through late 2017. The toggle above, over Oregon, hints at how the change in resolution in GOES-16, even far from the sub-satellite point, will likely improve GOES-R IFR Probability performance in regions where topography can constrain low clouds and fog. The GOES-16 Brightness Temperature Difference field, above, is color enhanced so that positive values (that is, where the brightness temperature at 10.3 µm is warmer than the 3.9 µm brightness temperature, which regions indicate cloud tops composed of water droplets, i.e., stratus) are whitish — and the data shows stratus/fog along the Oregon Coast, with fingers of fog advancing up small valleys. The image below shows the GOES-R IFR Probability field for the same time (Click here for a toggle).
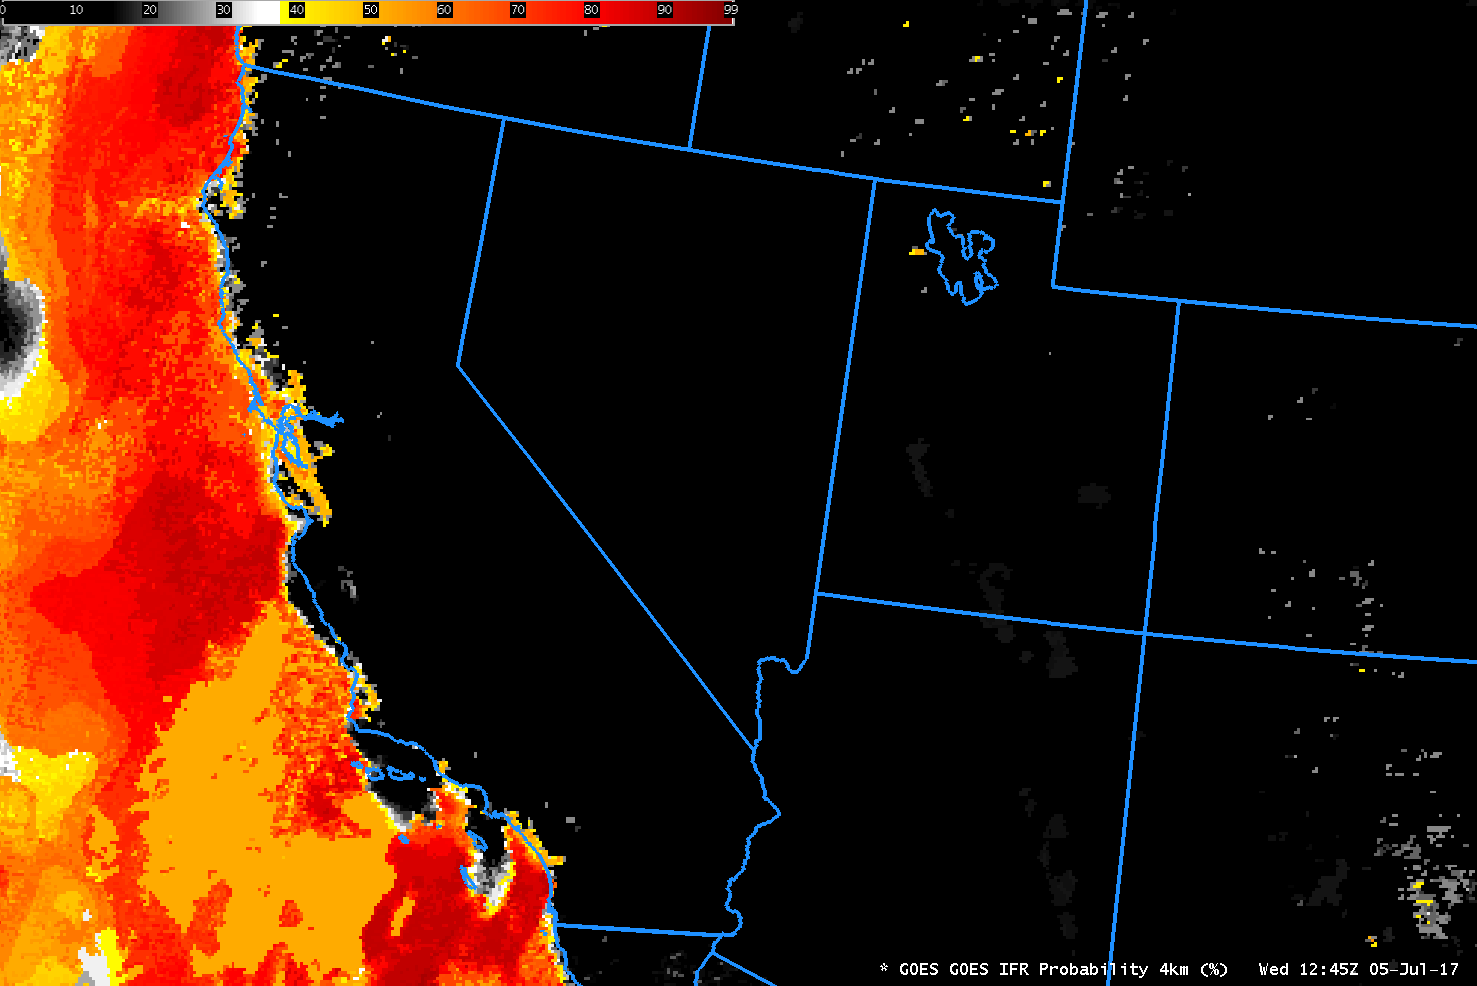
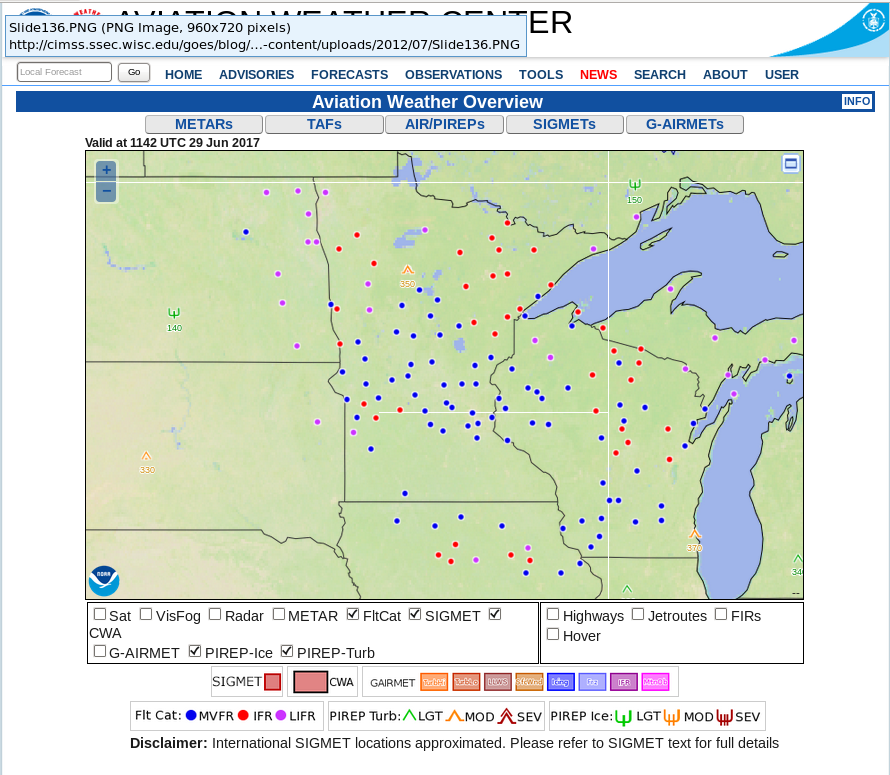
GOES-R IFR Probability fields show strong probabilities where the Brightness Temperature Difference field above is indicating low clouds. This is not surprising as the morning fog on this date was not overlain by higher clouds. However, the resolution inherent in the legacy GOES (inferior resolution compared to GOES-16), shows up plainly as a blocky field. When GOES-R IFR Probability fields are computed using GOES-16 data, the IFR Probability field resolution will match the GOES-16 resolution. (Click here for a aviationweather.gov observation of IFR / Low IFR conditions on the morning of 5 July).

GOES-R IFR Probability field computed from GOES-15 data at 1245 UTC on 5 July 2017 (Click to enlarge)
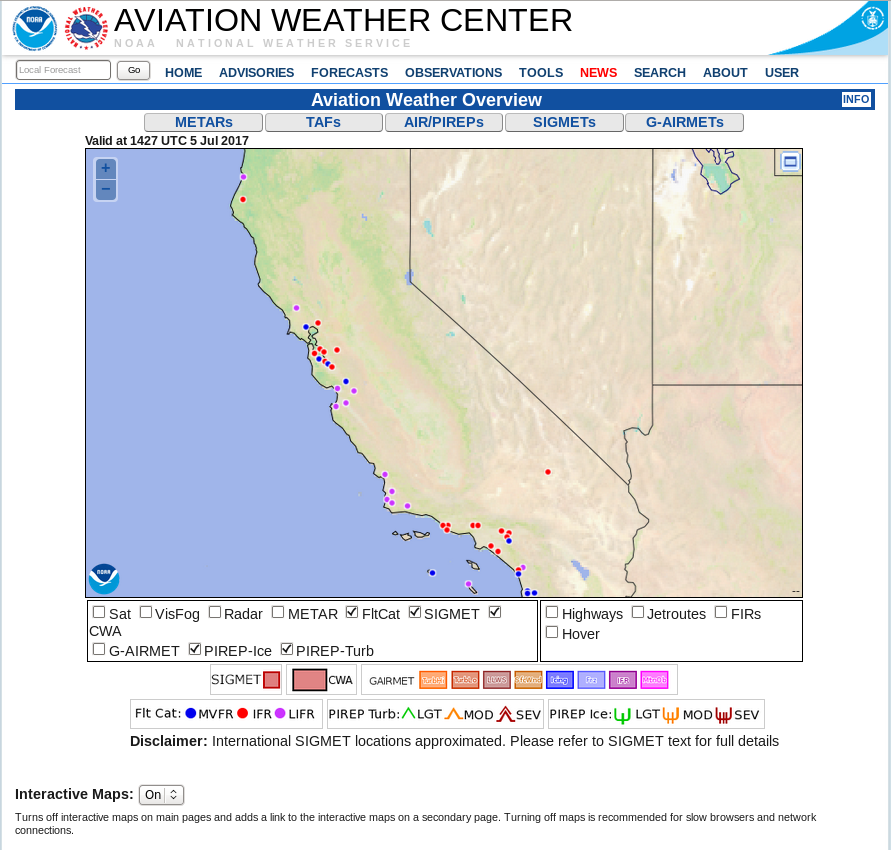
A similar set of figures for California at the same time is below. The toggle is here, and the aviationweather.gov screen capture is here.
GOES-16 Brightness Temperature Difference field (10.3 µm – 3.9 µm) at 1247 UTC on 5 July 2017 (Click to enlarge)
GOES-R IFR Probability field computed from GOES-15 data at 1245 UTC on 5 July 2017 (Click to enlarge)