 |
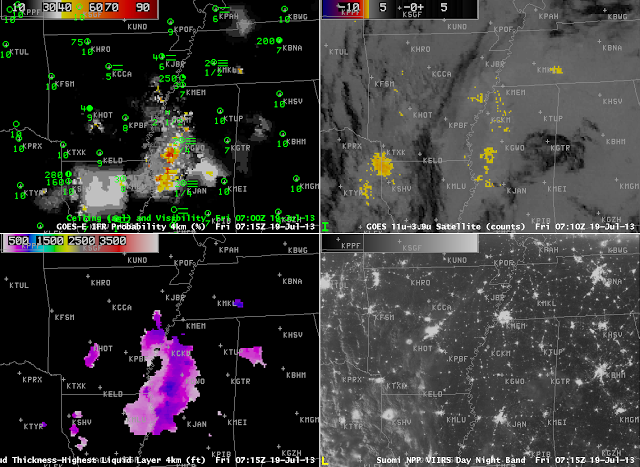
| GOES-R IFR Probabilities computed from GOES-East (Upper Left), GOES-East Brightness Temperature Difference (10.7 µm – 3.9 µm) (Upper Right), GOES-R Cloud Thickness (Lower Left), GOES-East Visible Imagery (Lower Right), all images hourly from 0415 UTC through 1415 UTC 19 July 2013 |
Hourly imagery of GOES-R IFR Probabilities show the development of high probabilities in a region where low clouds and fog develop to cause IFR and near-IFR conditions in and around the lower Mississippi River Valley. The traditional method of detecting low stratus will be hampered by an abundance of high and mid-level clouds (as evidenced in the brightness temperature difference product, above, and in the day/night band imagery, below). Different polar-orbiting satellites can give snapshots at high spatial resolution that describe the fog/low cloud fields. The Suomi/NPP overpass at 0715 UTC (early in the night for radiation fog development), shows the abundance of high clouds over the western part of the domain, for example, that are illuminated by the setting half-moon. It is difficult to discern low clouds in regions where IFR probabilities are high.
 |
| As above, but with Suomi/NPP Day/Night Band (Bottom Right), 0715 UTC. |
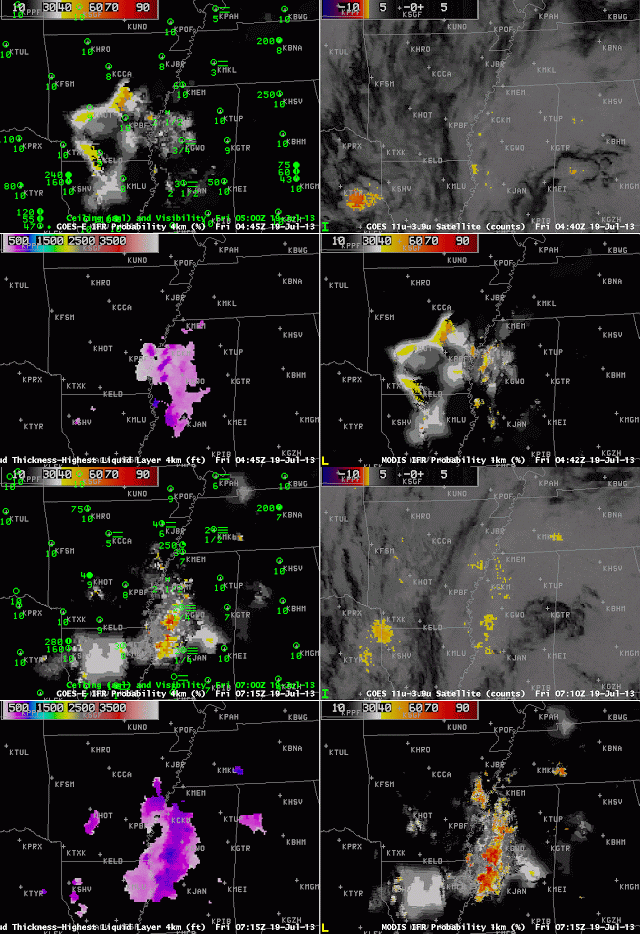
MODIS data are used to produce IFR probabilities, and those images are shown below. The later of the images matches the time of the Suomi/NPP band shown above.
 |
| As above, but with MODIS-based GOES-R IFR Probabilities (Lower Right), at 0445 and 0715 UTC 19 July 2013 |
MODIS-based IFR probabilities are higher than GOES-based probabilities over the west-central part of Mississippi where satellite data are included in the predictors. This occurs when the MODIS-based satellite signal of low clouds is stronger than that from GOES, which difference in signal can occur because of the finer resolution of the MODIS data. In central Arkansas and northern Louisiana, however, where high clouds are present (and therefore where Satellite data are not used in the computation of the IFR Probability), the GOES-based and MODIS-based fields are nearly identical.
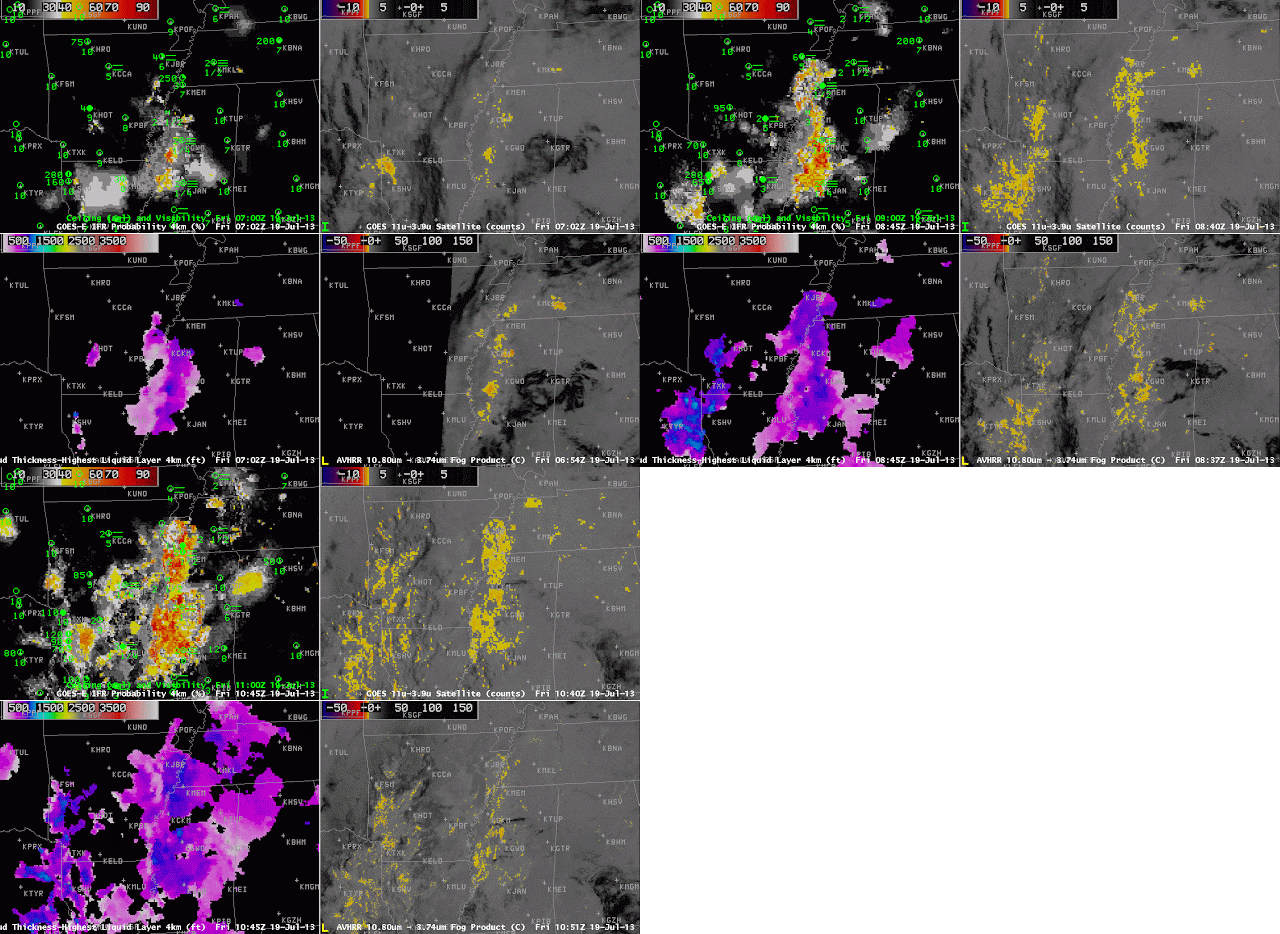
AVHRR data (below) can also be used to compute brightness temperature differences, but those data are not yet incorporated into the GOES-R algorithms. However, the trend of the brightness temperature difference field can be used to monitor trends in low clouds/fog. High clouds will obscure the view, however. It is very difficult to infer a change in the amount of fog, and the concomitant decreases in visibility, based on the brightness temperature difference changes displayed below.
 |
| As above, but with the AVHRR Brightness Temperature Difference (10.8 – 3.74), bottom right, at 0654 UTC, 0837 UTC and 1051 UTC on 19 July 2013. |


