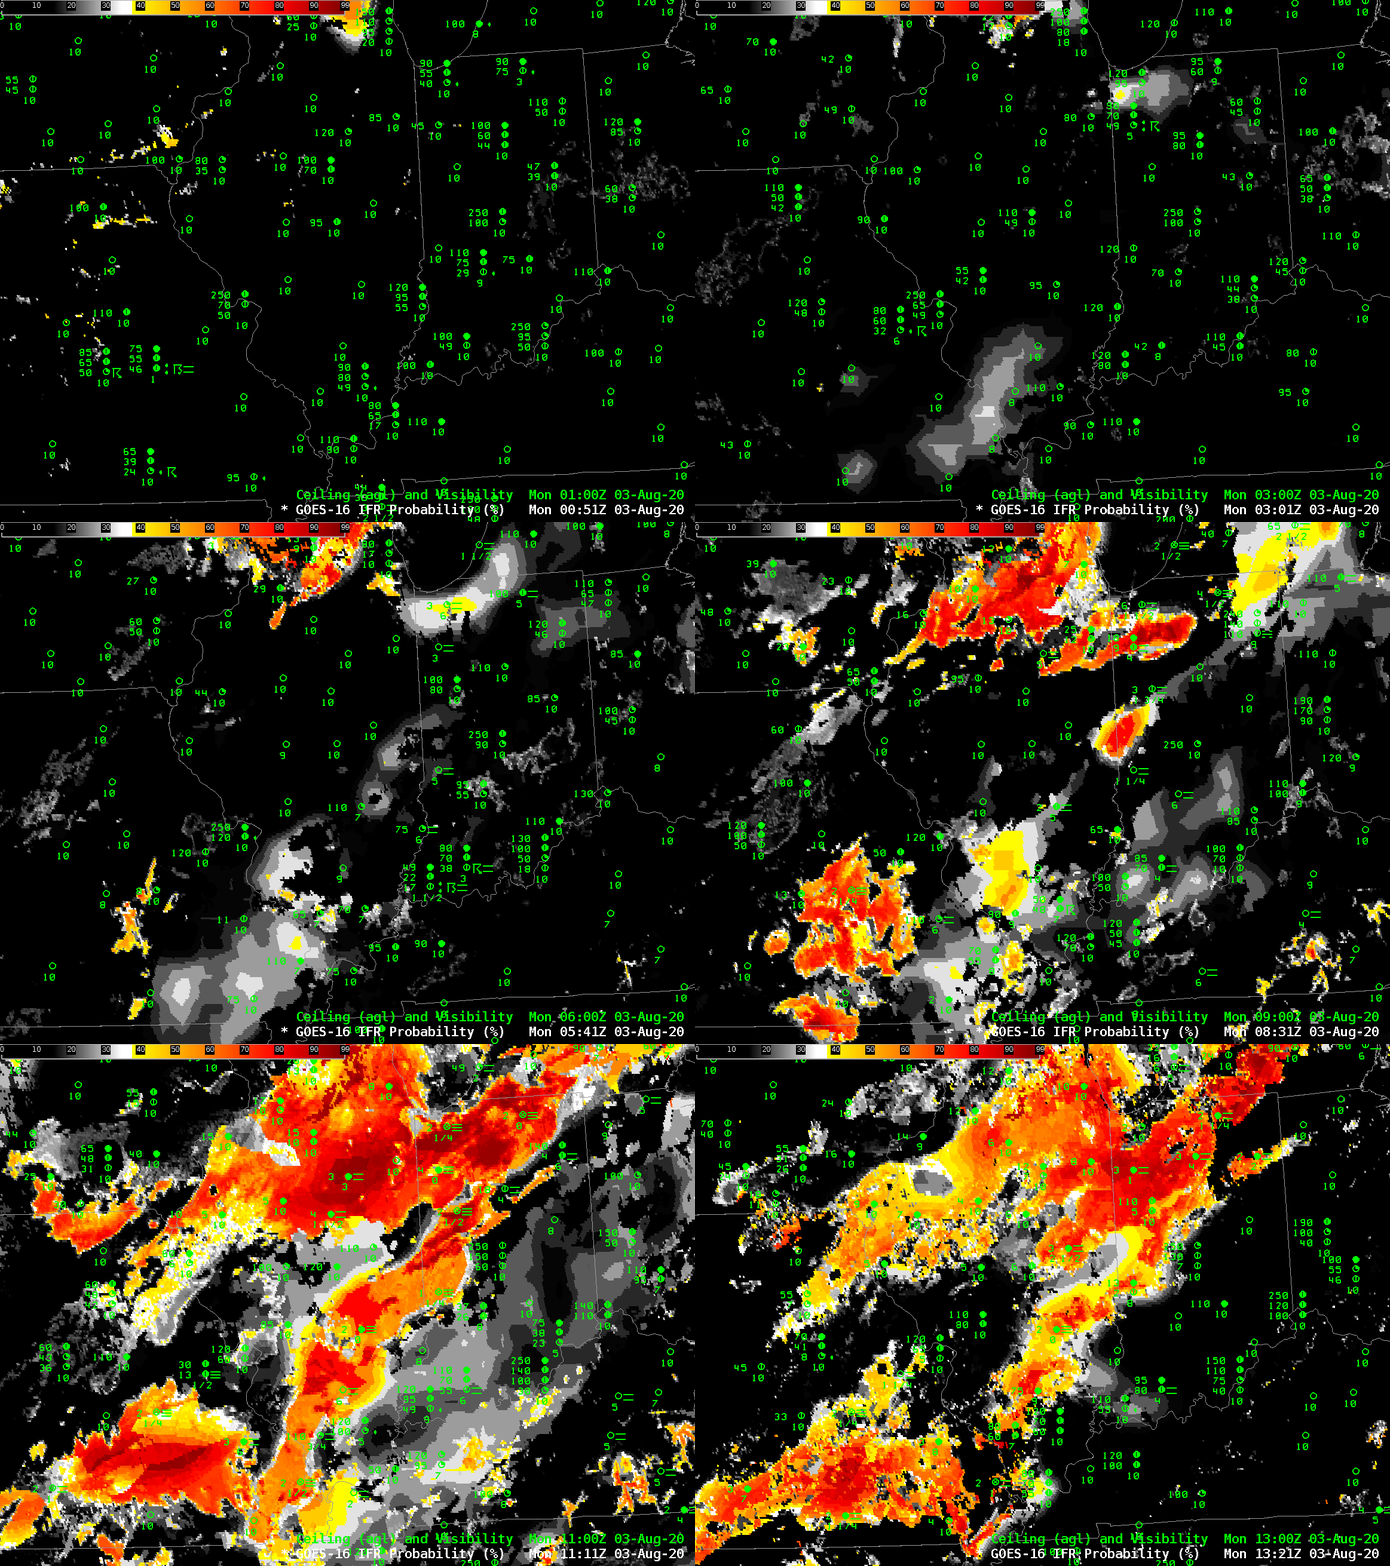
Because IFR Probability includes both model information on low-level saturation and satellite information on low-level clouds, it can give an advanced warning on the development of fog when high clouds — at might occur behind departing convection, for example — prevent the satellite from viewing the low cloud beneath high clouds. Consider the animation below, that shows IFR Probability fields along with surface observations of ceilings and visibilities plotted so that regions with IFR conditions can be identified. IFR probability fields develop over northwest Indiana over the course of the night, especially over extreme northern Indiana where the east-west Indiana Toll road sits.
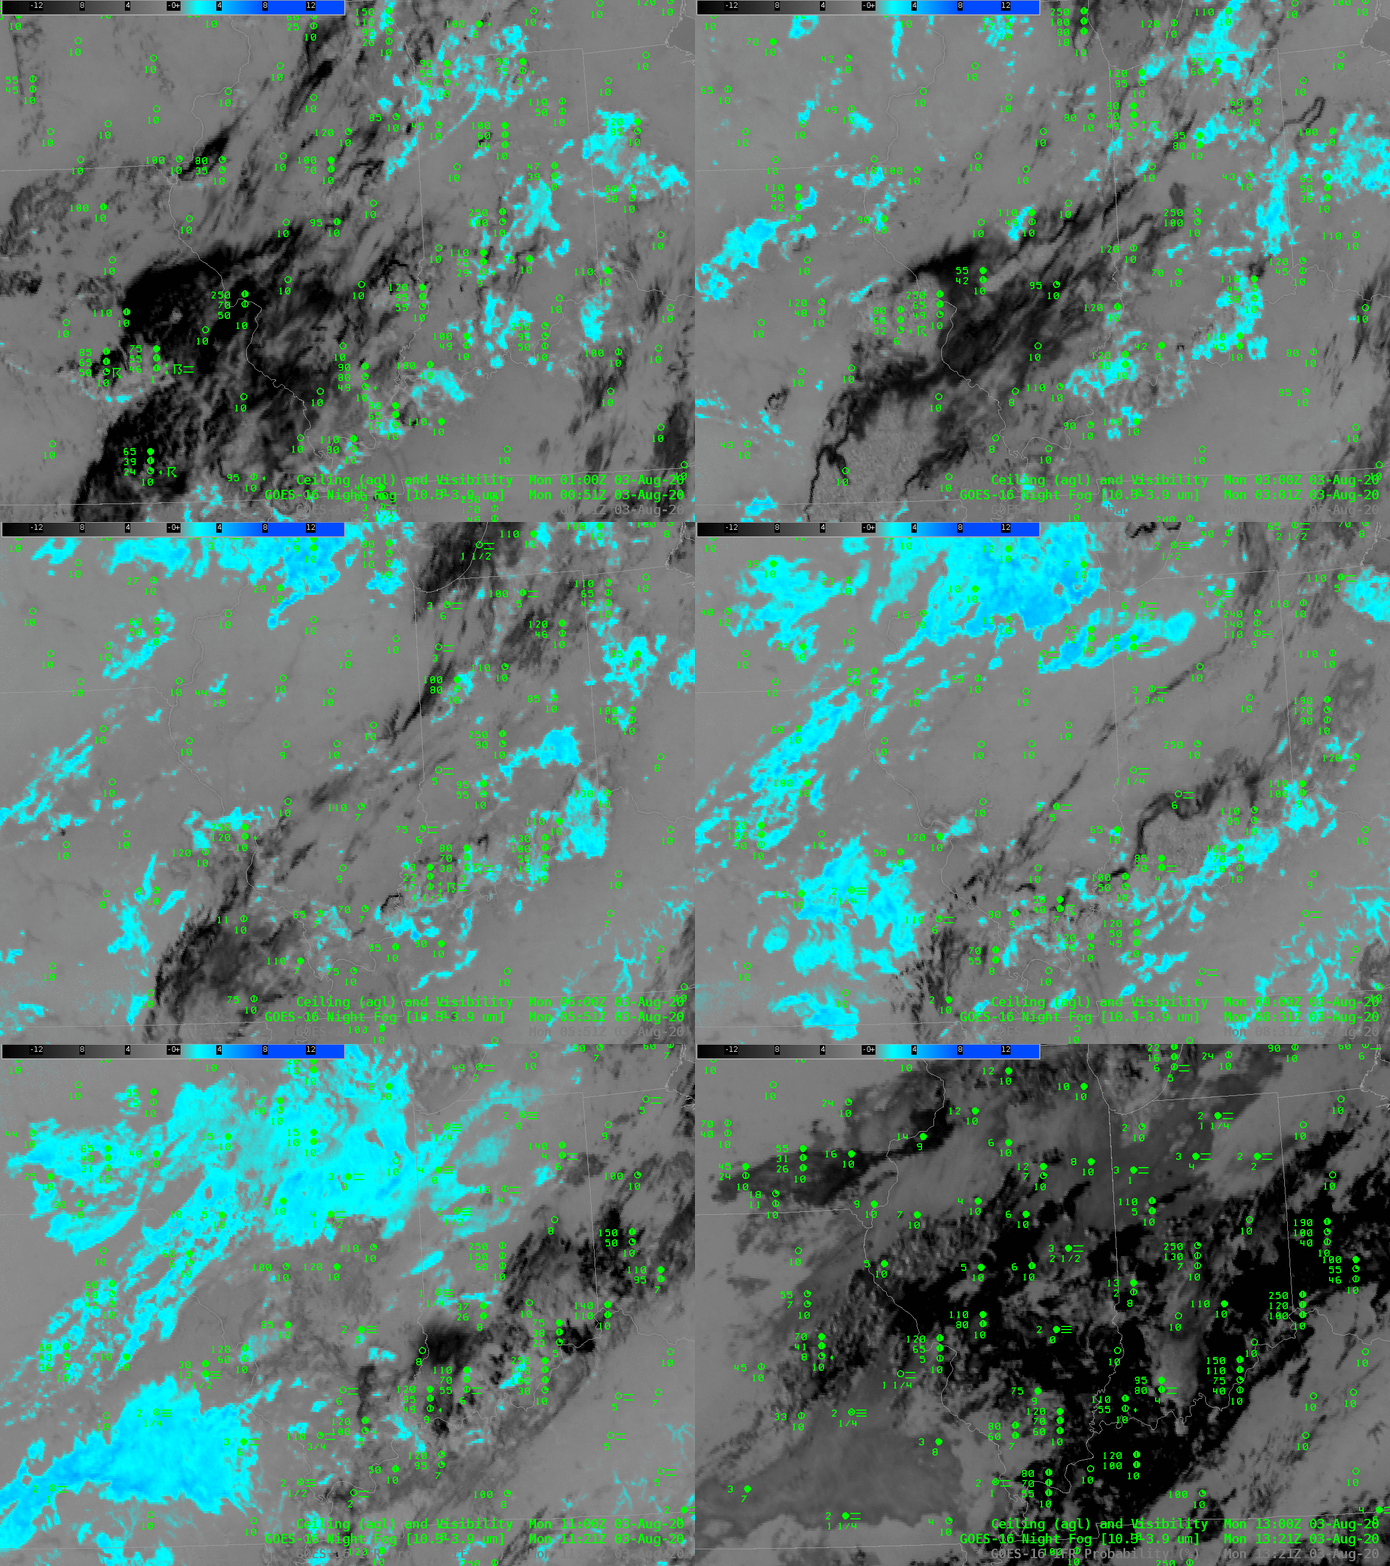
Compare the IFR Probability fields above to the Night Fog Brightness Temperature Difference (10.3 µm – 3.9 µm) field below. The field below historically has been used at night to identify regions of low clouds/fog — regions that are cyan in the enhancement are low clouds, regions that are black are high clouds. As the sun rises, the Night Fog brightness temperature difference field will struggle to identify regions of low clouds (although a different enhacement can be used to highlight the low cloud regions after sunrise). The satellite is not able to view low clouds over northern Indiana until the high clouds move out. Thus, a distinct indication of low clouds over the Indiana Toll road lags the suggestion of low clouds given by IFR Probability fields.
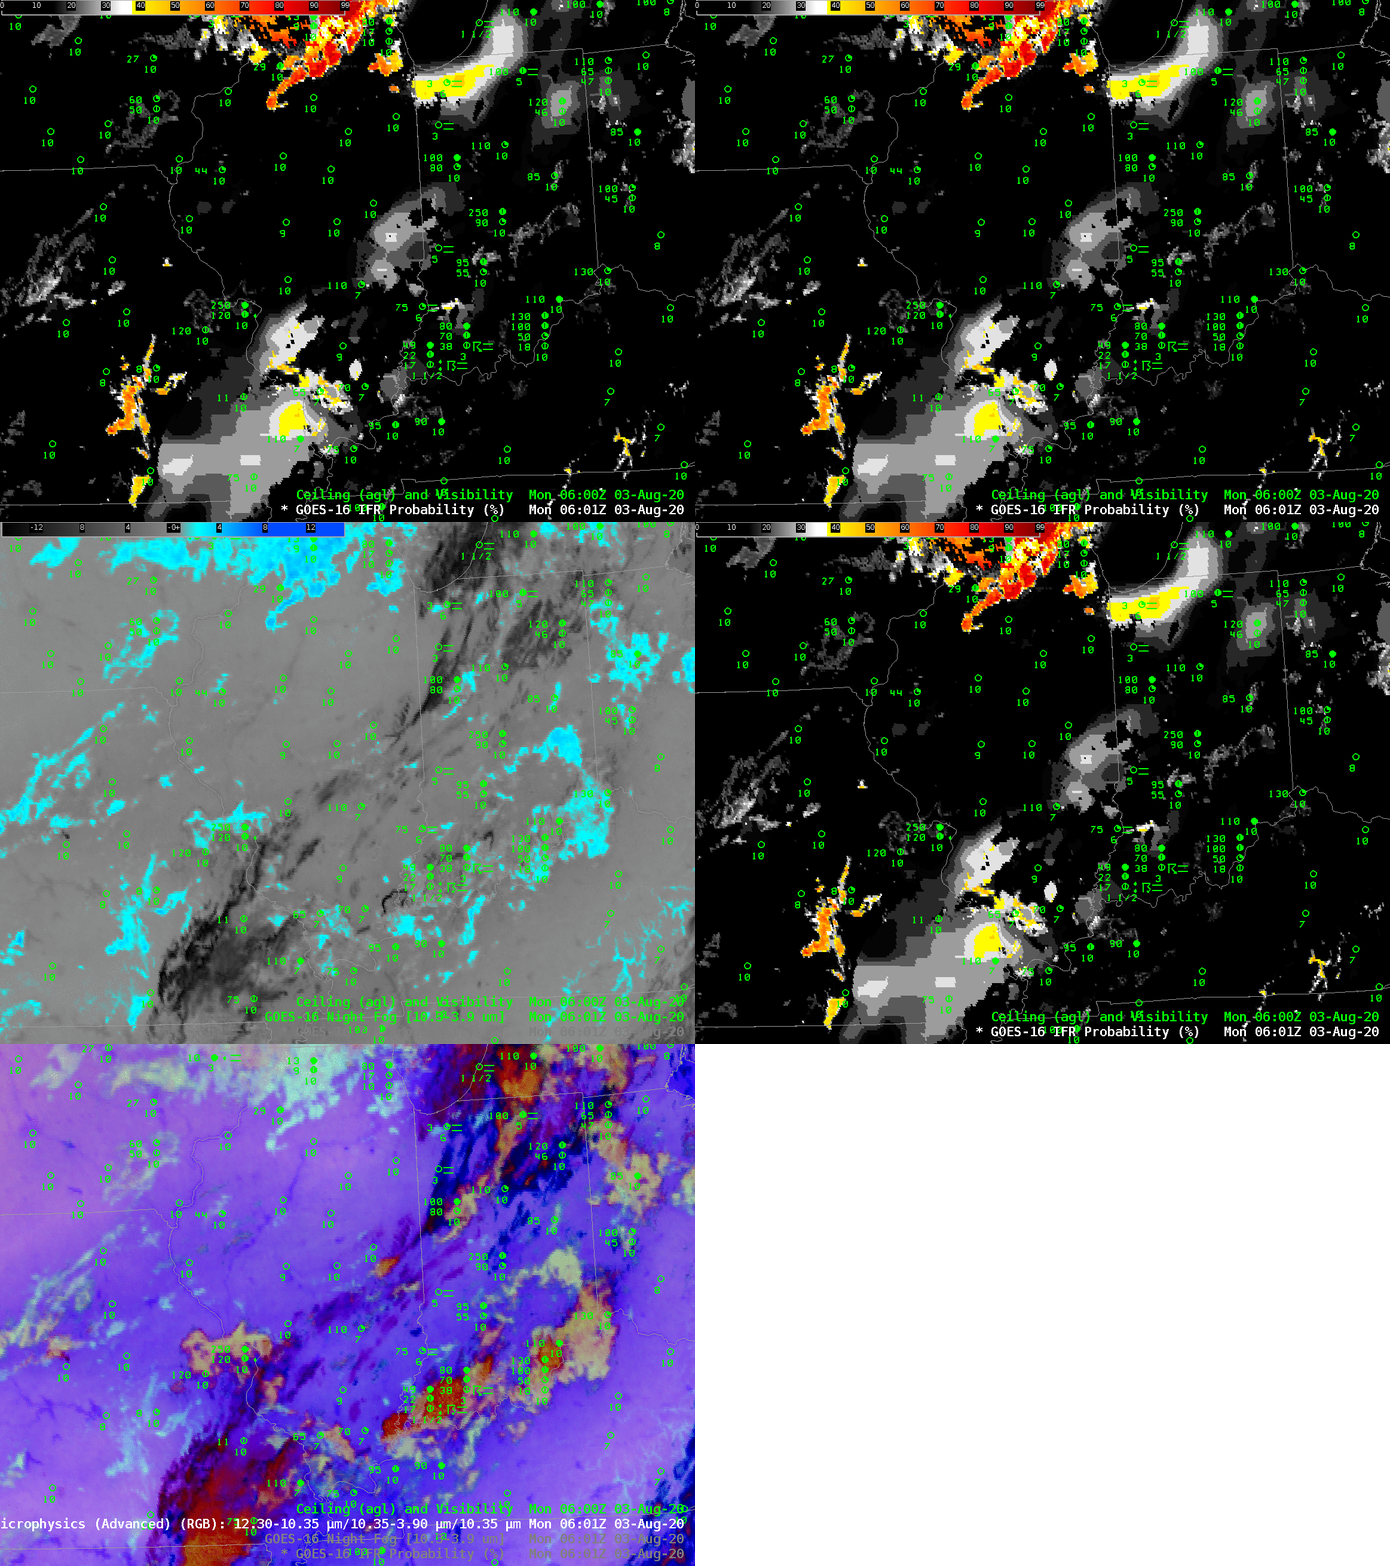
Consider the toggle below of GOES-R IFR Probability, Night Fog Brightness Temperature Difference and the Nighttime Microphysics RGB at 0601 UTC on 3 August.. IFR Probability fields show a developing region of IFR conditions (in yellow) over extreme NW Indiana. The two satellite-only detectors show only a scant suggestiong that fog is present. (A similar scenario is occurring near the bootheel of Missouri)
At 0901 UTC, below, all three indicators of low clouds are in better agreement over northwest Indiana (and over the Missouri Bootheel) as high clouds move from those areas.
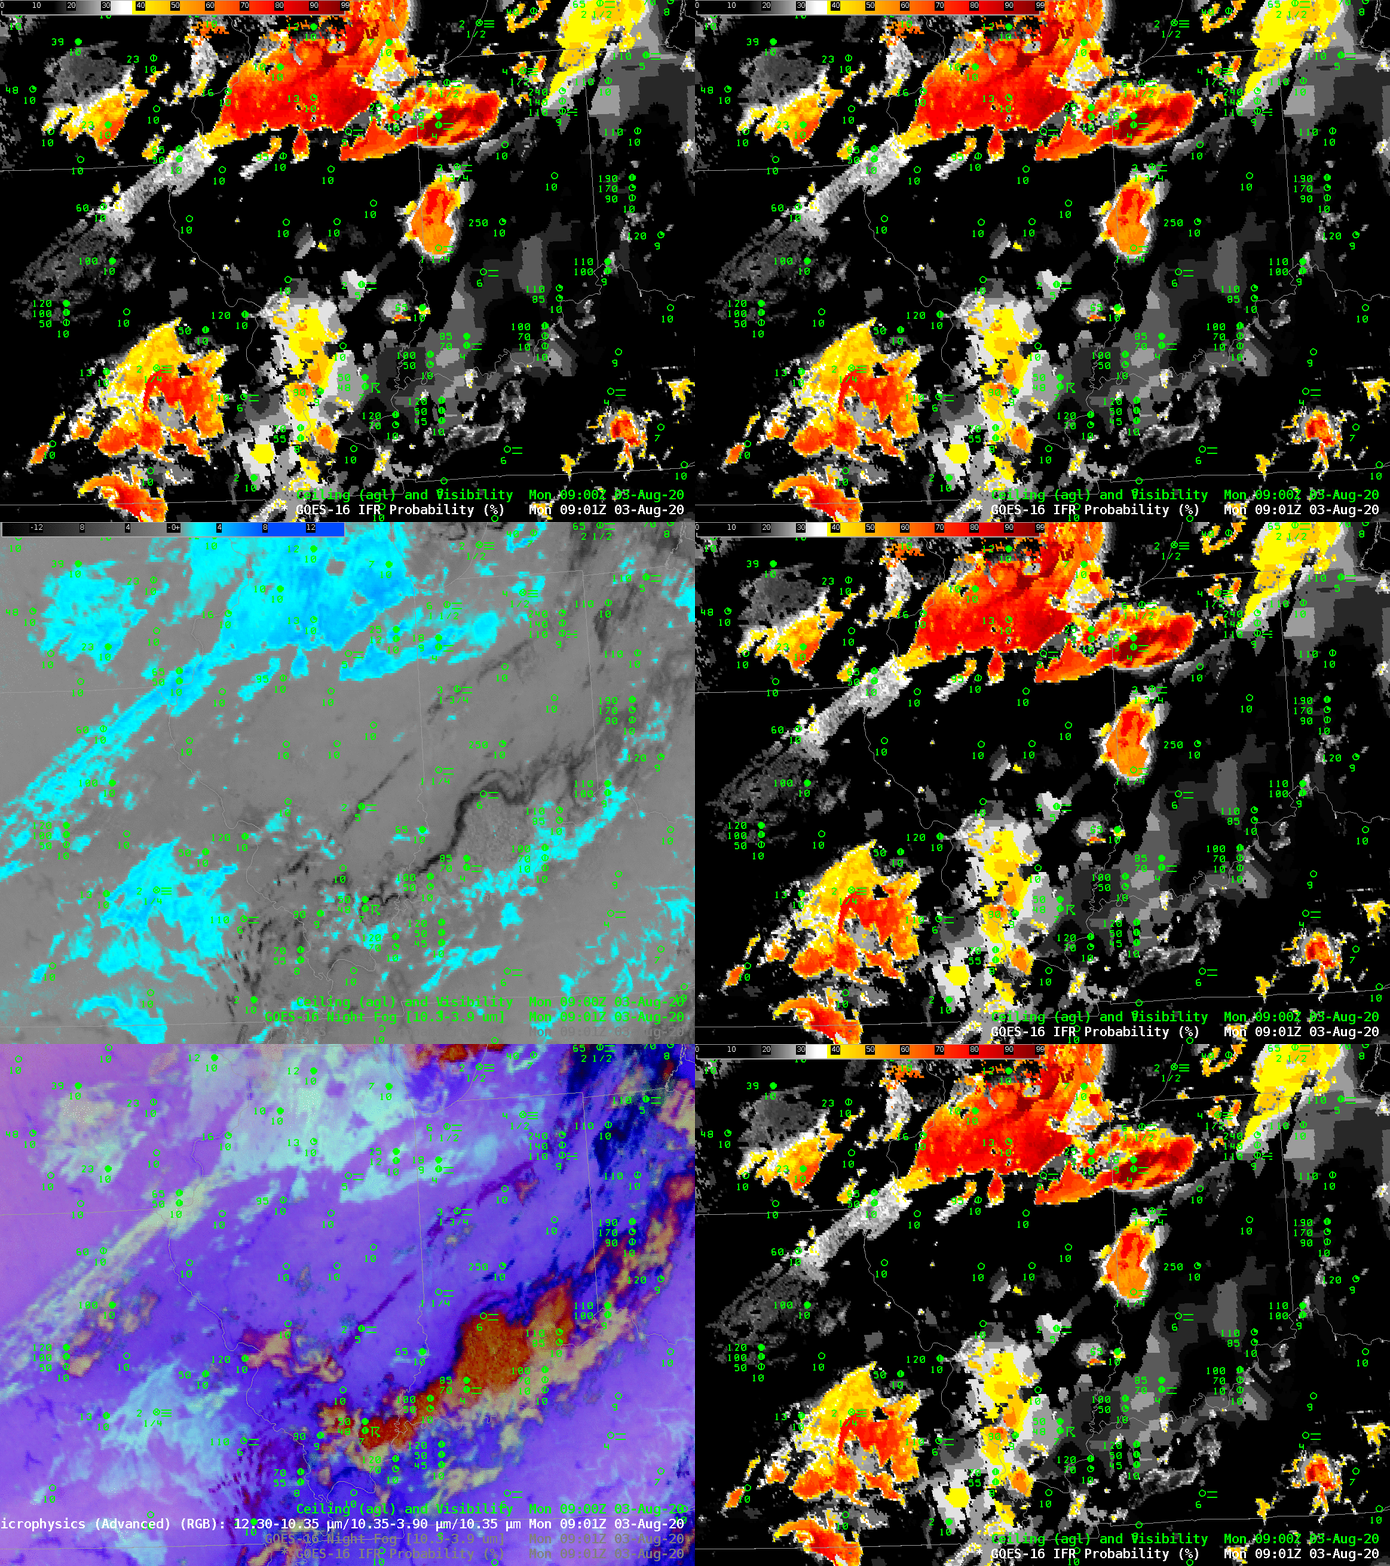
Fields at 0931 and 1001 UTC continue this trend of stronger signals in the regions initially highlighted at 0601 UTC by the IFR Probability fields.
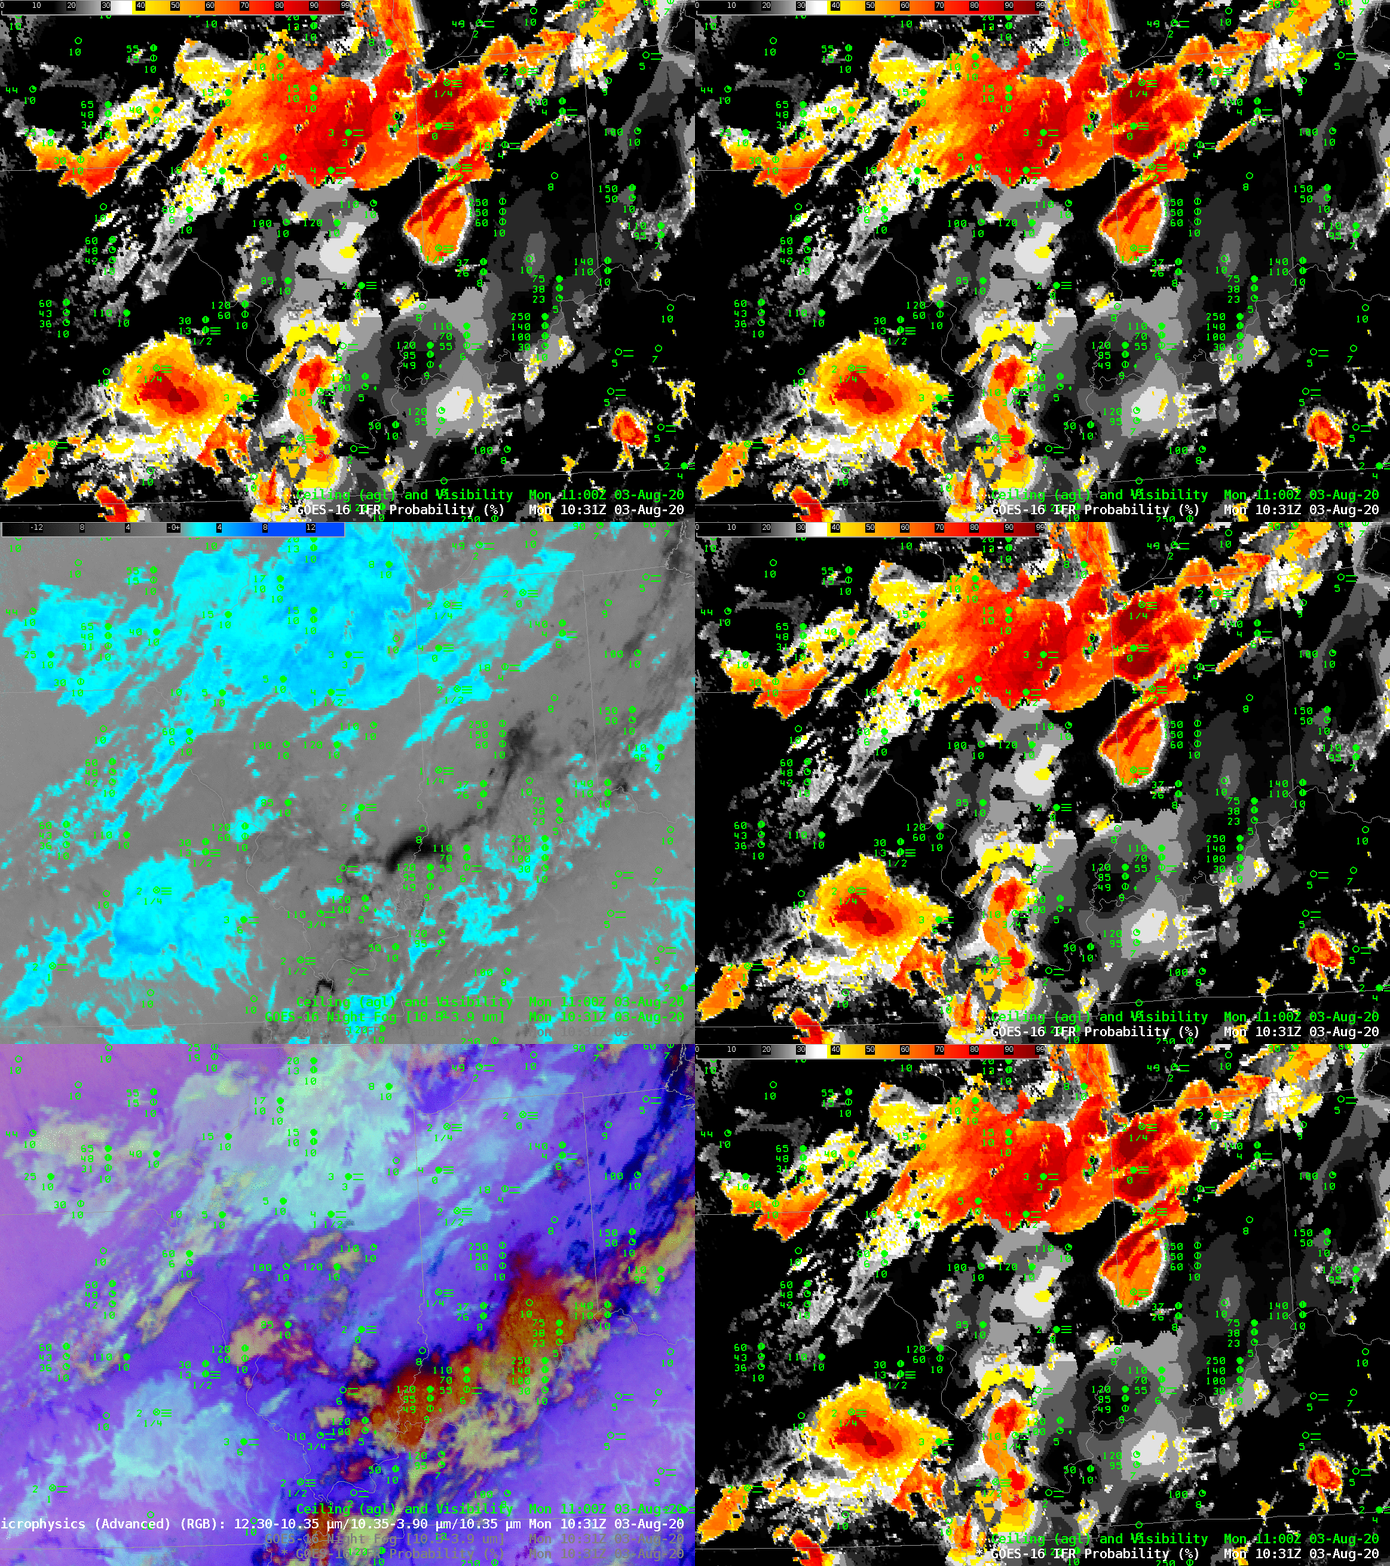
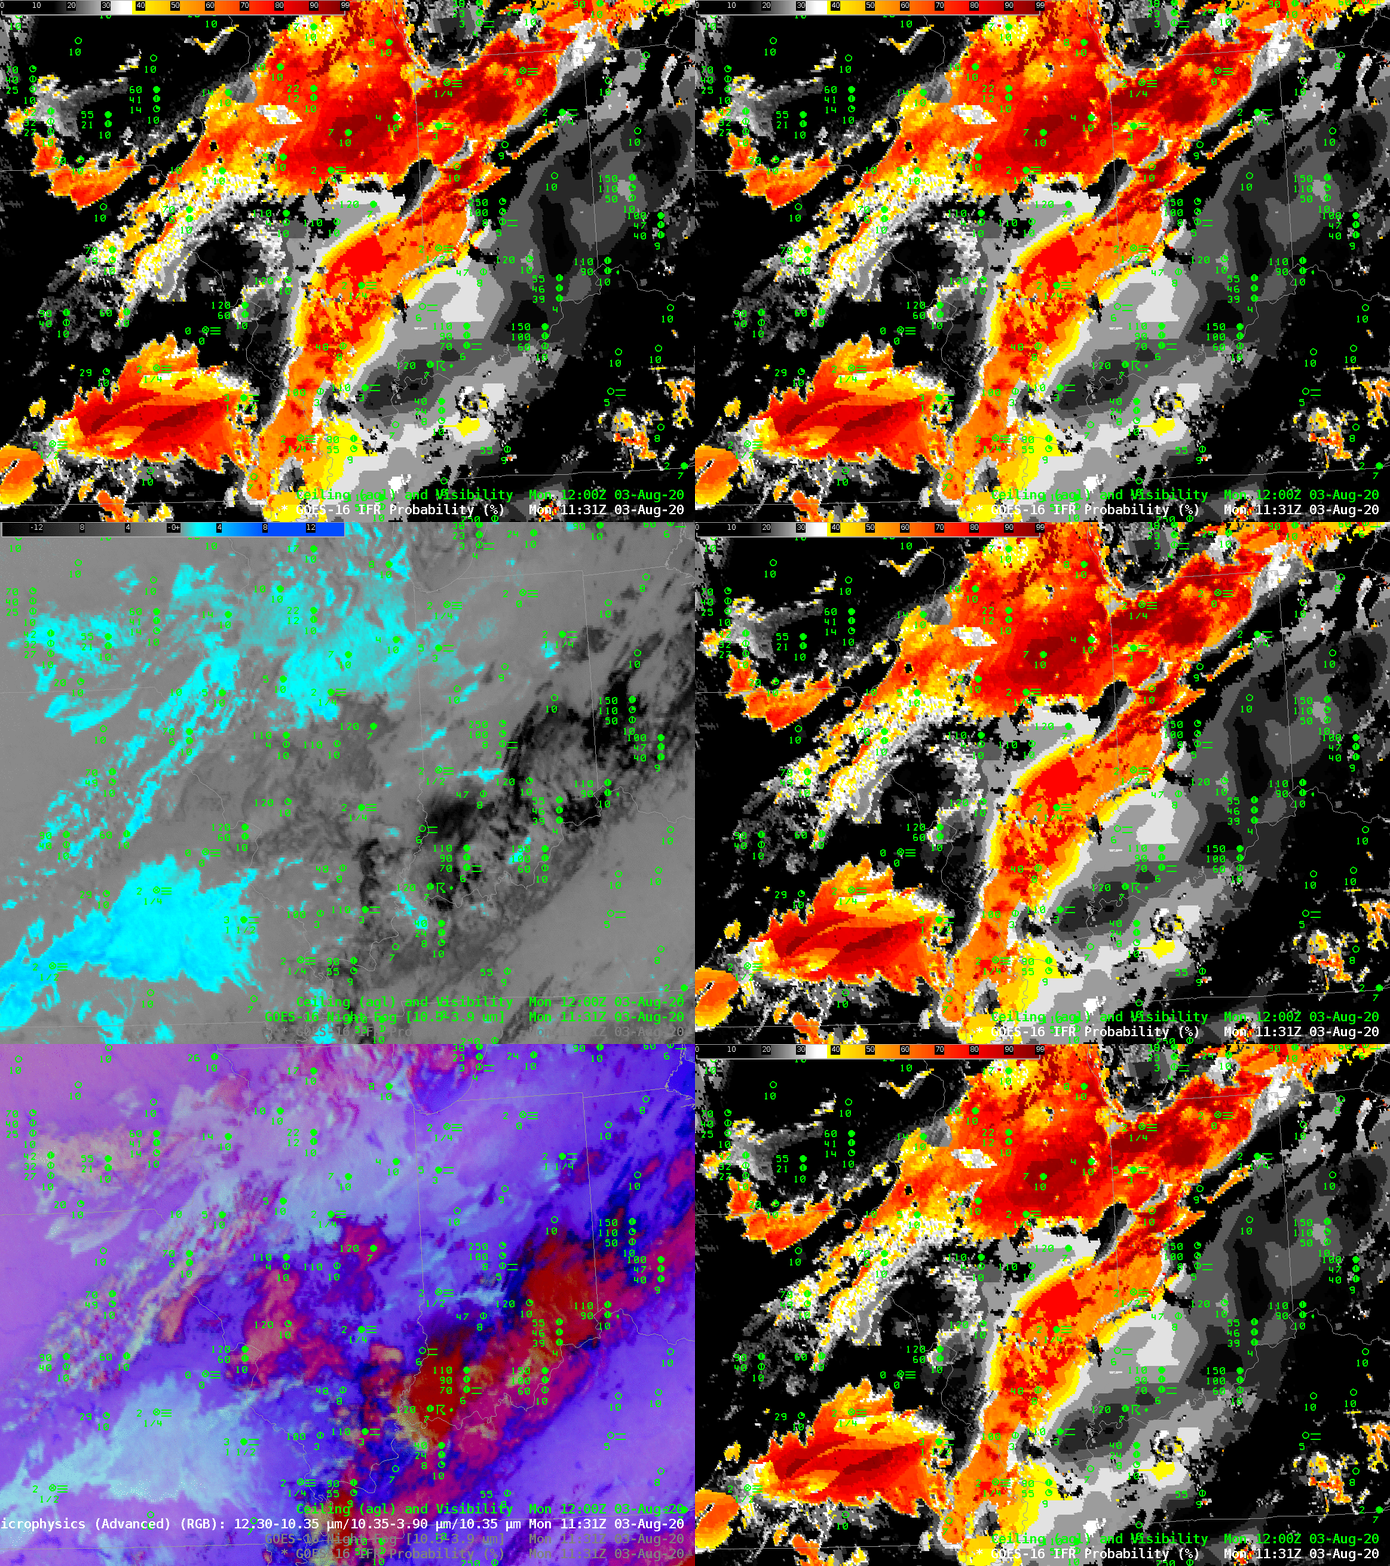
By 1131 UTC, below, increasing solar reflectance over the eastern part of the domain has changed the signal in both the Nighttime fog and Nighttime microphysics RGB over northern Indiana and Ohio. The GOES-R IFR Probability signal however is maintained.
