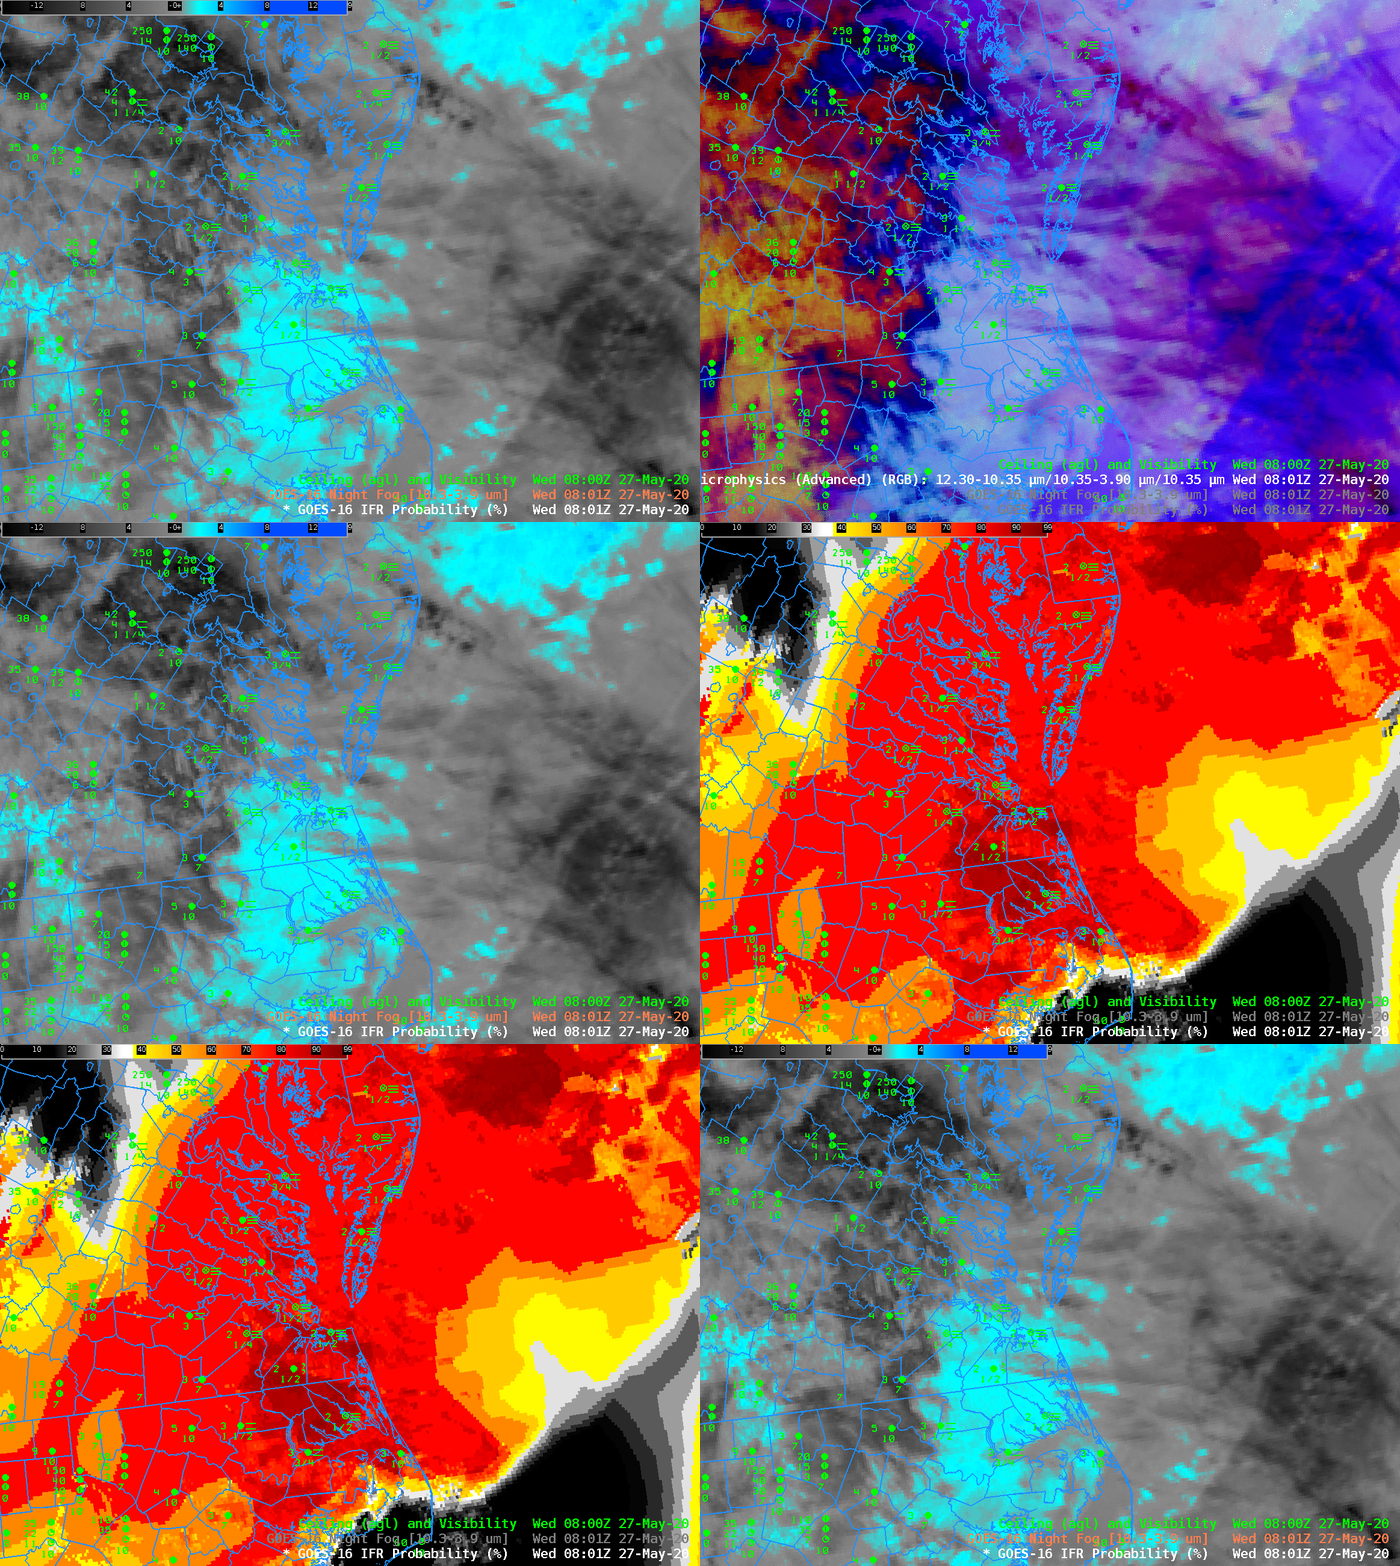
Dense Fog was widespread over southeast Virginia on 27 May 2020. The toggle above compares the Night Fog Brightness Temperature Difference field, Night Time Microphysics RGB, and GOES-R IFR Probabilities computed with GOES-16 data and Rapid Refresh Model output, all at 0801 UTC. A challenge with satellite-only detection of low ceilings/poor visibility is that high clouds get in the way. For example, consider the satellite-only signal at Richmond, with 1/4-mile visibility and 200-foot ceilings. Low clouds are not easily detected in that region by satellite; only the GOES-R IFR Probability field (which blends satellite detection of clouds with model estimates of low-level saturation) correctly suggests the transportation hazard that is present there (and extending some distance to the north and west!)

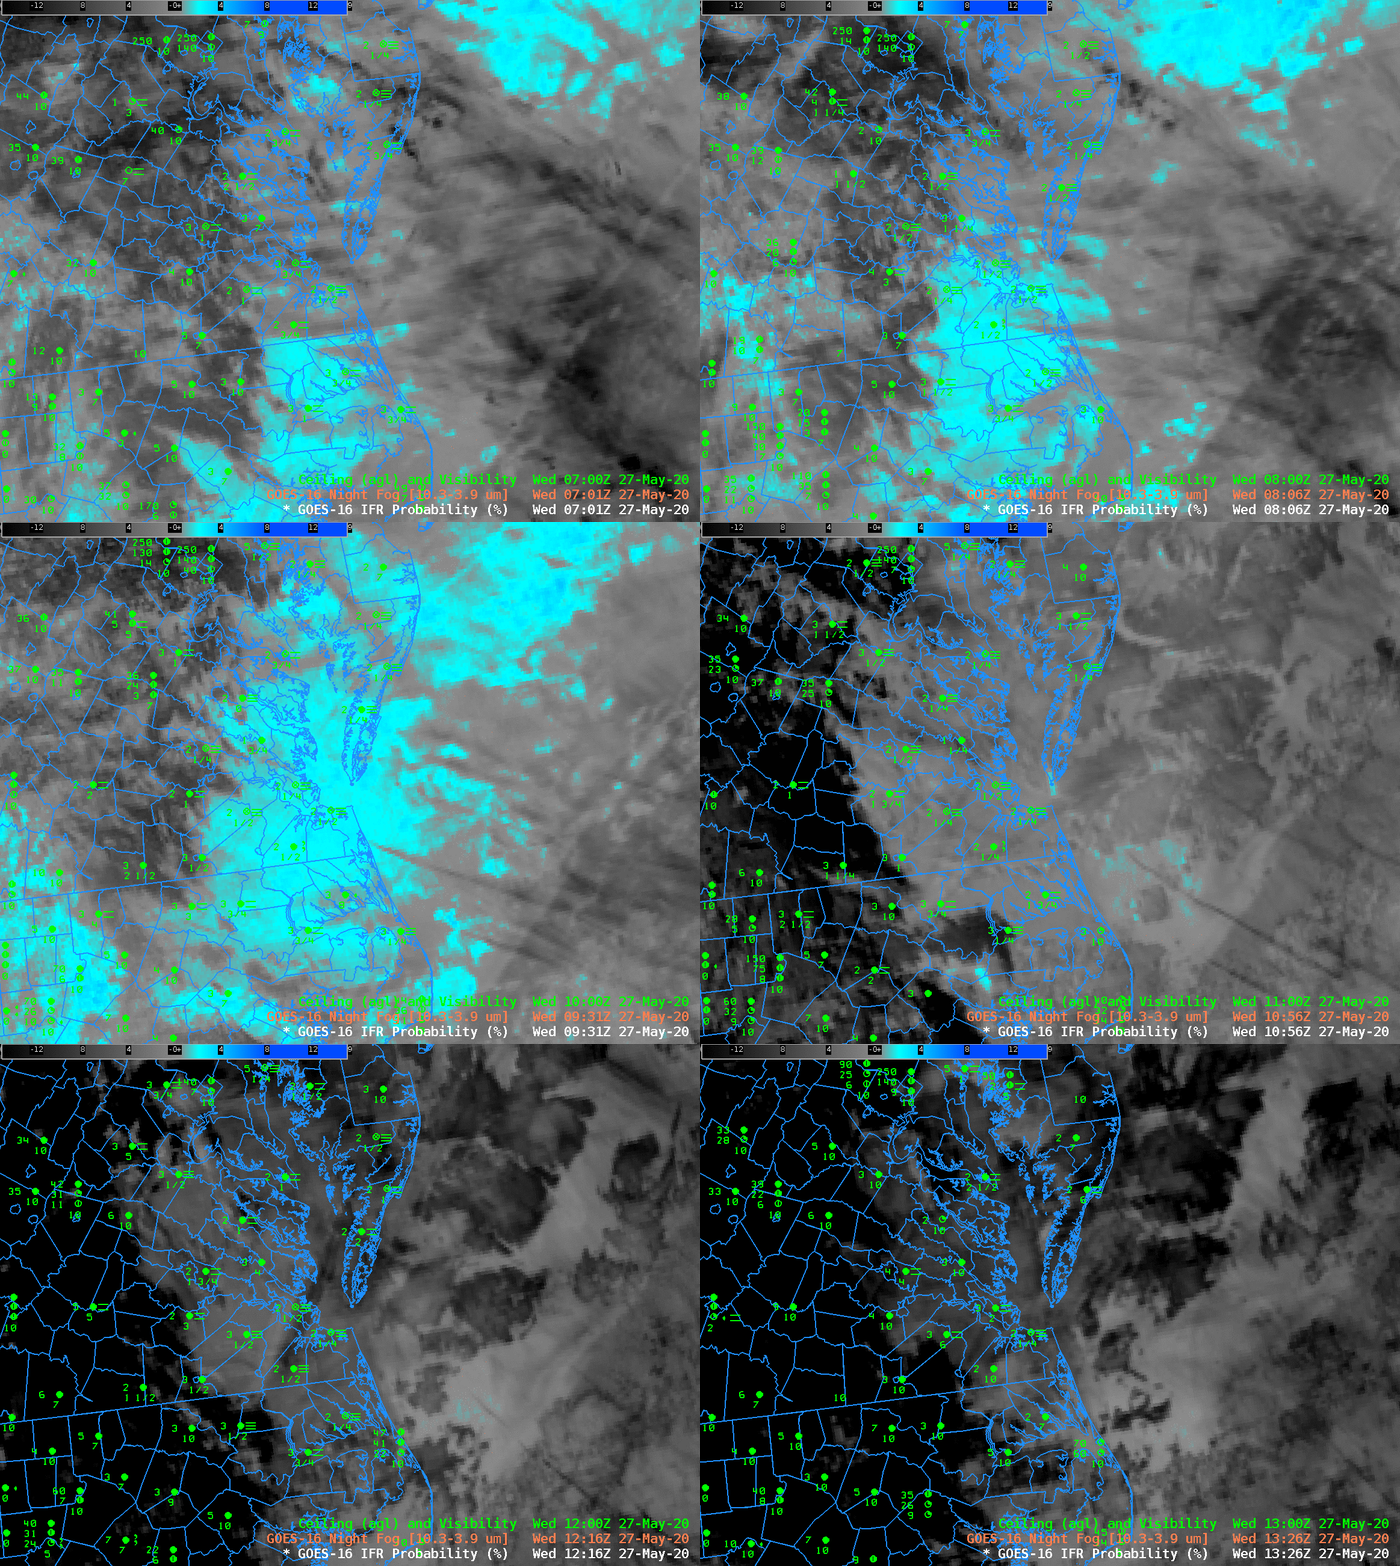
The animation of the night Fog brightness temperature difference field, above, the ‘green’ component of the night time microphysics RGB, shown below, shows a second challenge of using this product for fog detection: the signal is lost (or, at best, changes) as the Sun rises. The RGB product shows the same challenges in fog/low stratus detection that are present in the channel difference field above: high clouds mask the signal, and the signal changes as the sun rises. (Contrails show up very nicely in both however.)

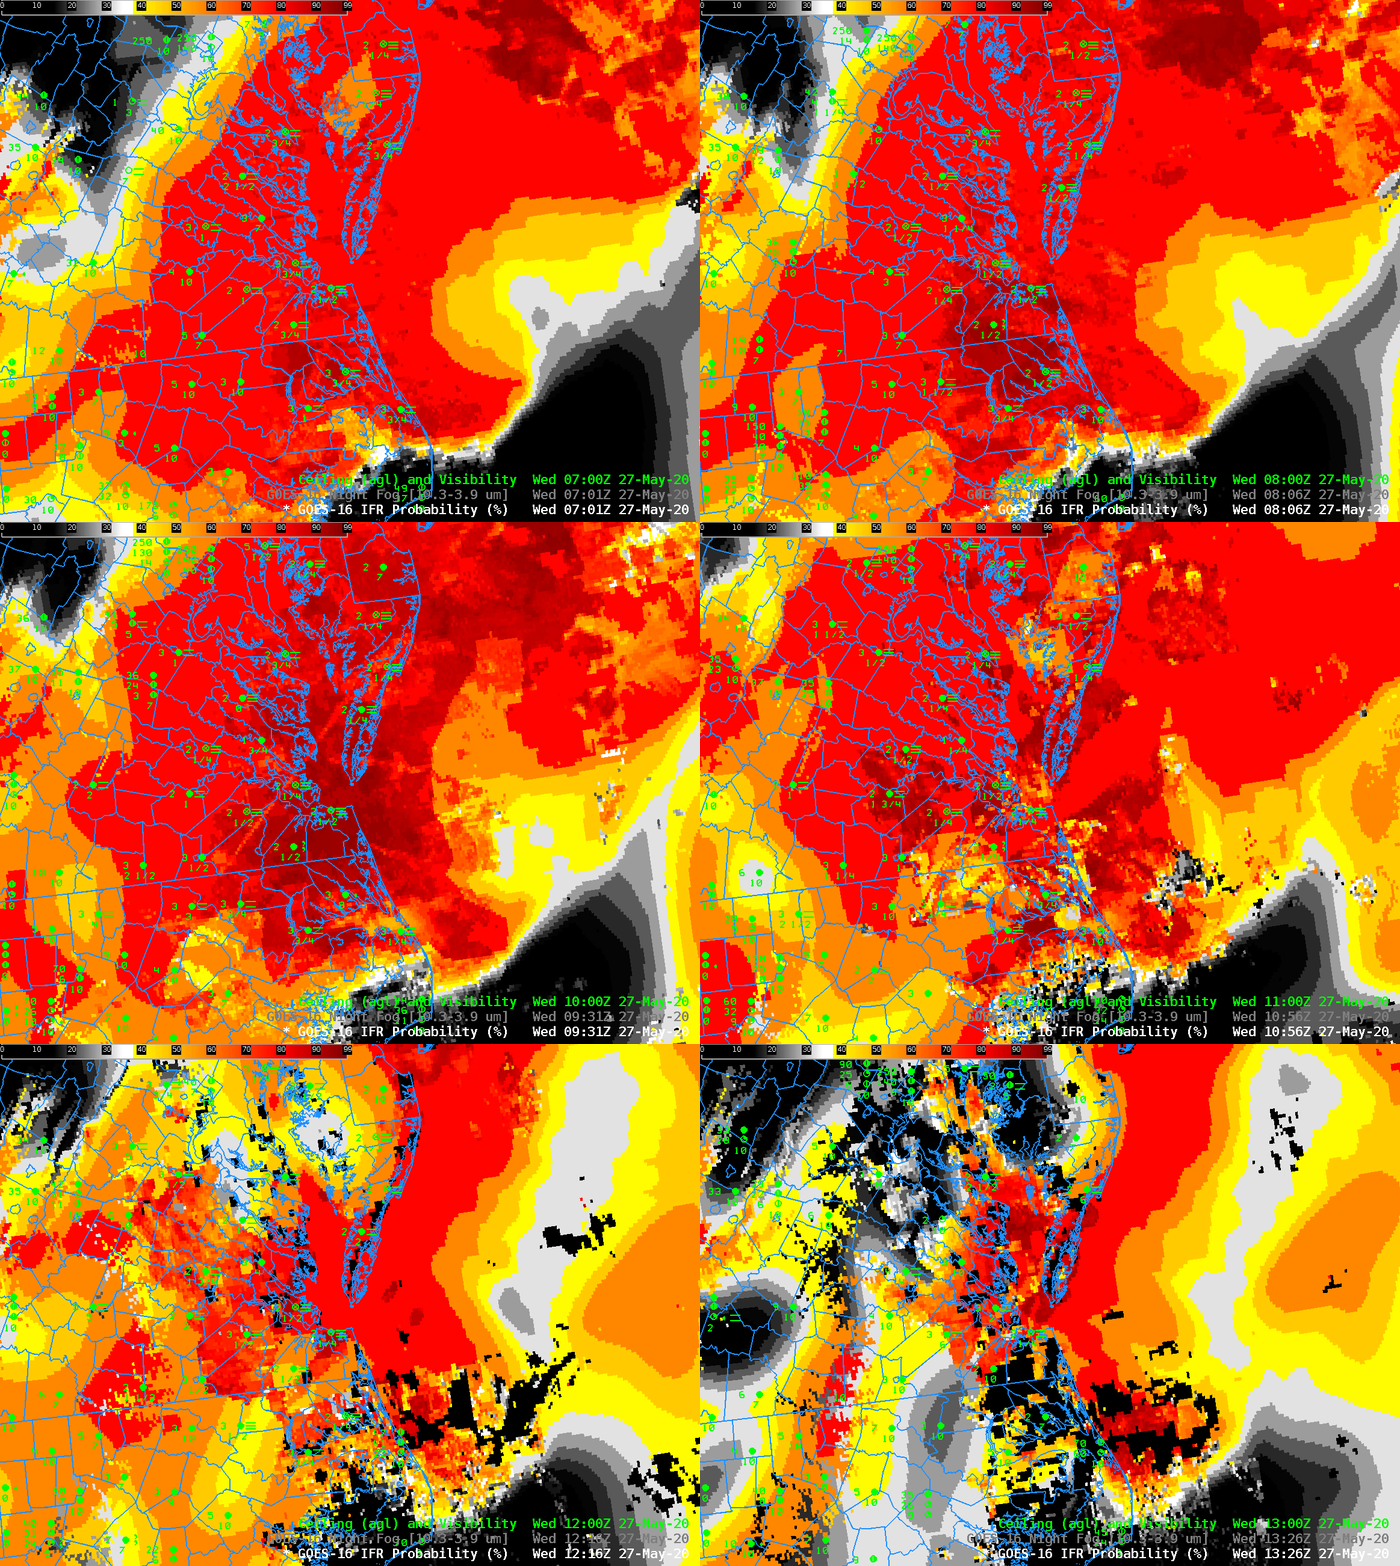
GOES-R IFR Probability fields, below, do a much better job characterizing the horizontal extent of the low clouds early in the animation, and in highlighting the region where visibility reductions persist through sunrise, namely from Hampton Roads northeastward along the coast.

