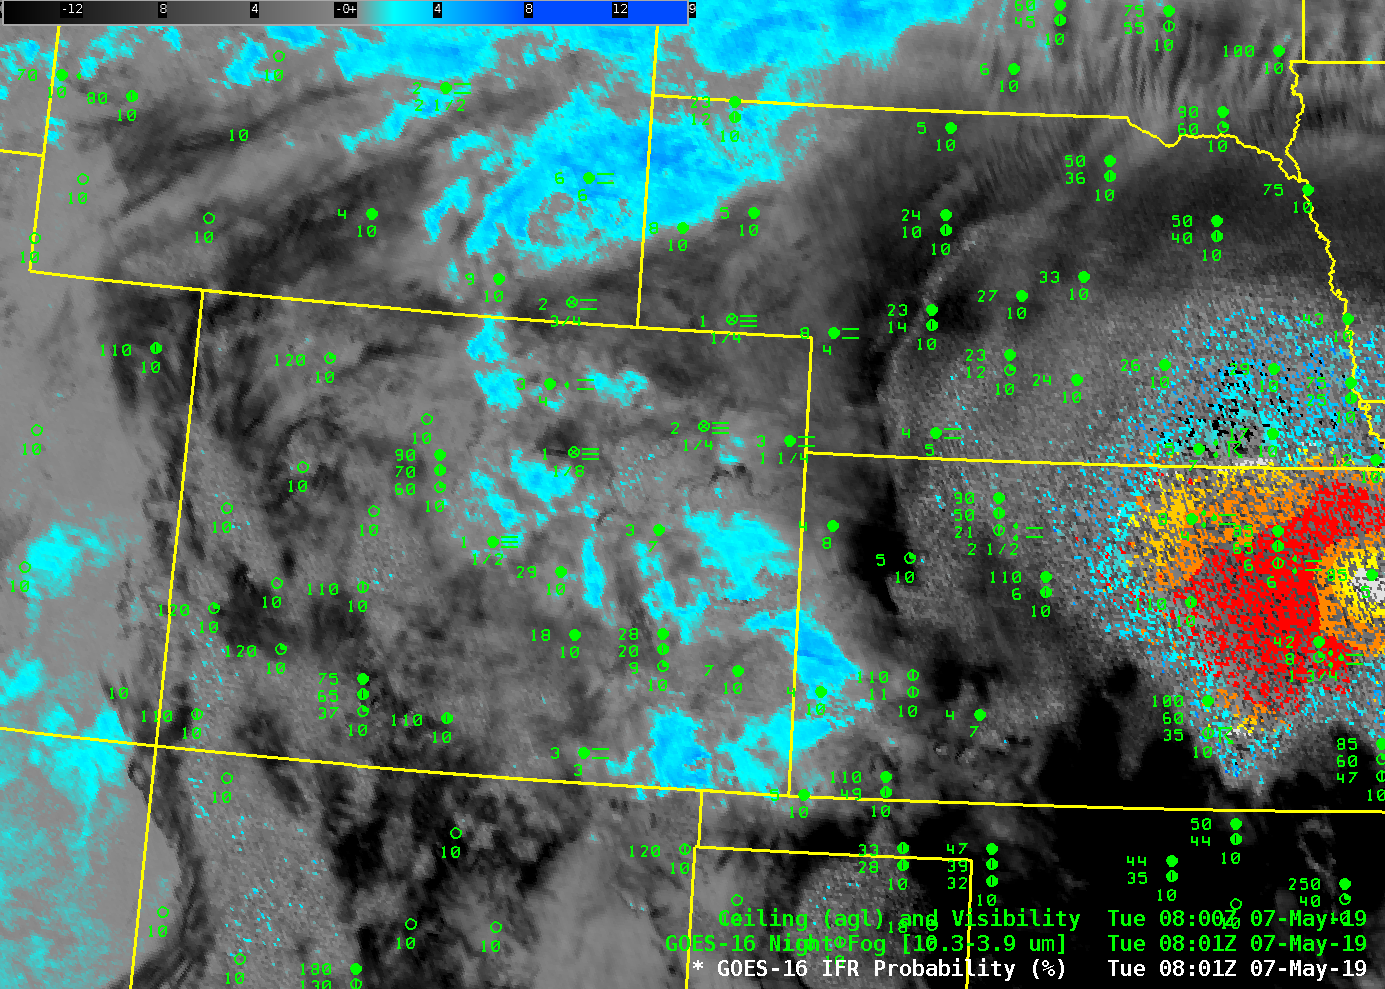
Night Fog Brightness Temperature Difference (10.3 µm – 3.9 µm), 0801-1311 UTC on 7 May 2019 (Click to animate)
Consider the animation above, of the Brightness Temperature Difference product (10.3 µm – 3.9 µm) centered on Colorado on the morning of Tuesday 7 May 2019. The surface observations show widespread IFR conditions, but because of widespread high clouds over the region, the brightness temperature difference shows little signal that is consistent with low clouds (blue or cyan in this enhancement). There isn’t much horizontal spatial correlation between observations of low ceilings/reduced visibility and the Brightness Temperature Difference product. When low clouds are overlain by high clouds, don’t expect a satellite detection of low clouds to work. Note also how the Brightness Temperature Difference field loses its signal as the sun rises and a general increase in the amount of reflected solar shortwave (3.9 µm) infrared radiation increases.
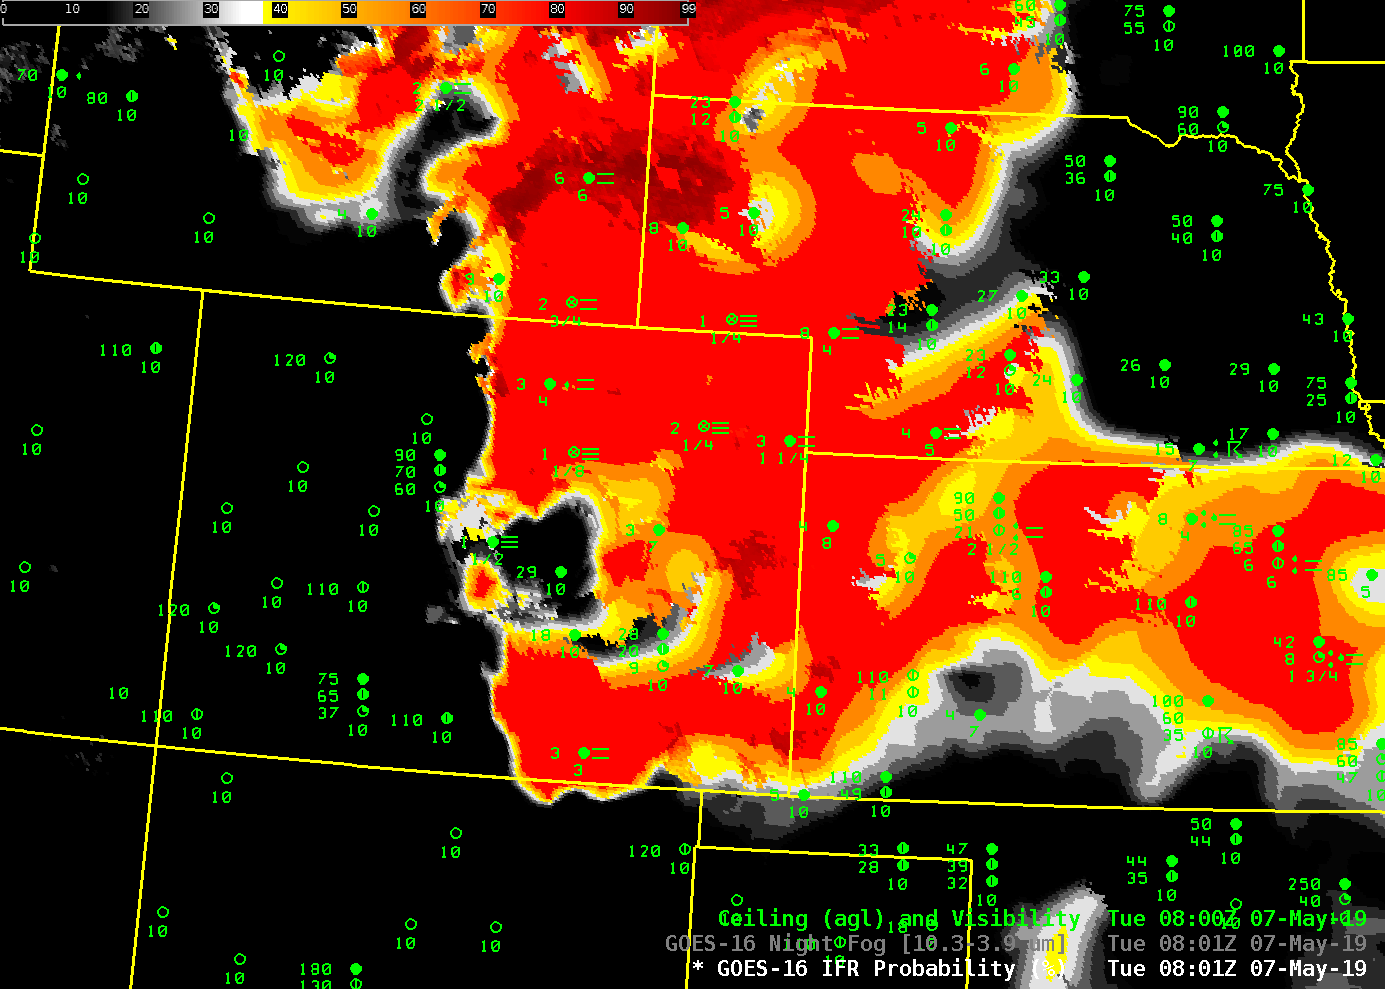
GOES-R IFR Probability includes near-surface information that is useful, especially when mid-level or high clouds obscure the satellite view of low clouds. Rapid Refresh estimates of near-surface saturation are used to gauge the probability of IFR conditions. In the case on 7 May 2019, that information allowed GOES-R IFR Probability to approximate exactly where the lowest ceilings and more reduced visibilities were. There is therefore a much better spatial correlation between the location of surface observations showing IFR conditions, and the IFR Probability field. This has a tacit implication on how well the Rapid Refresh Model is simulating the evolution of the atmosphere. Note also that in contrast to the Brightness Temperature Difference field, a consistent signal is maintained through sunrise.

GOES-R IFR Probability, and surface observations of ceilings/visibility, 0801-1311 UTC on 7 May 2019 (Click to animate)
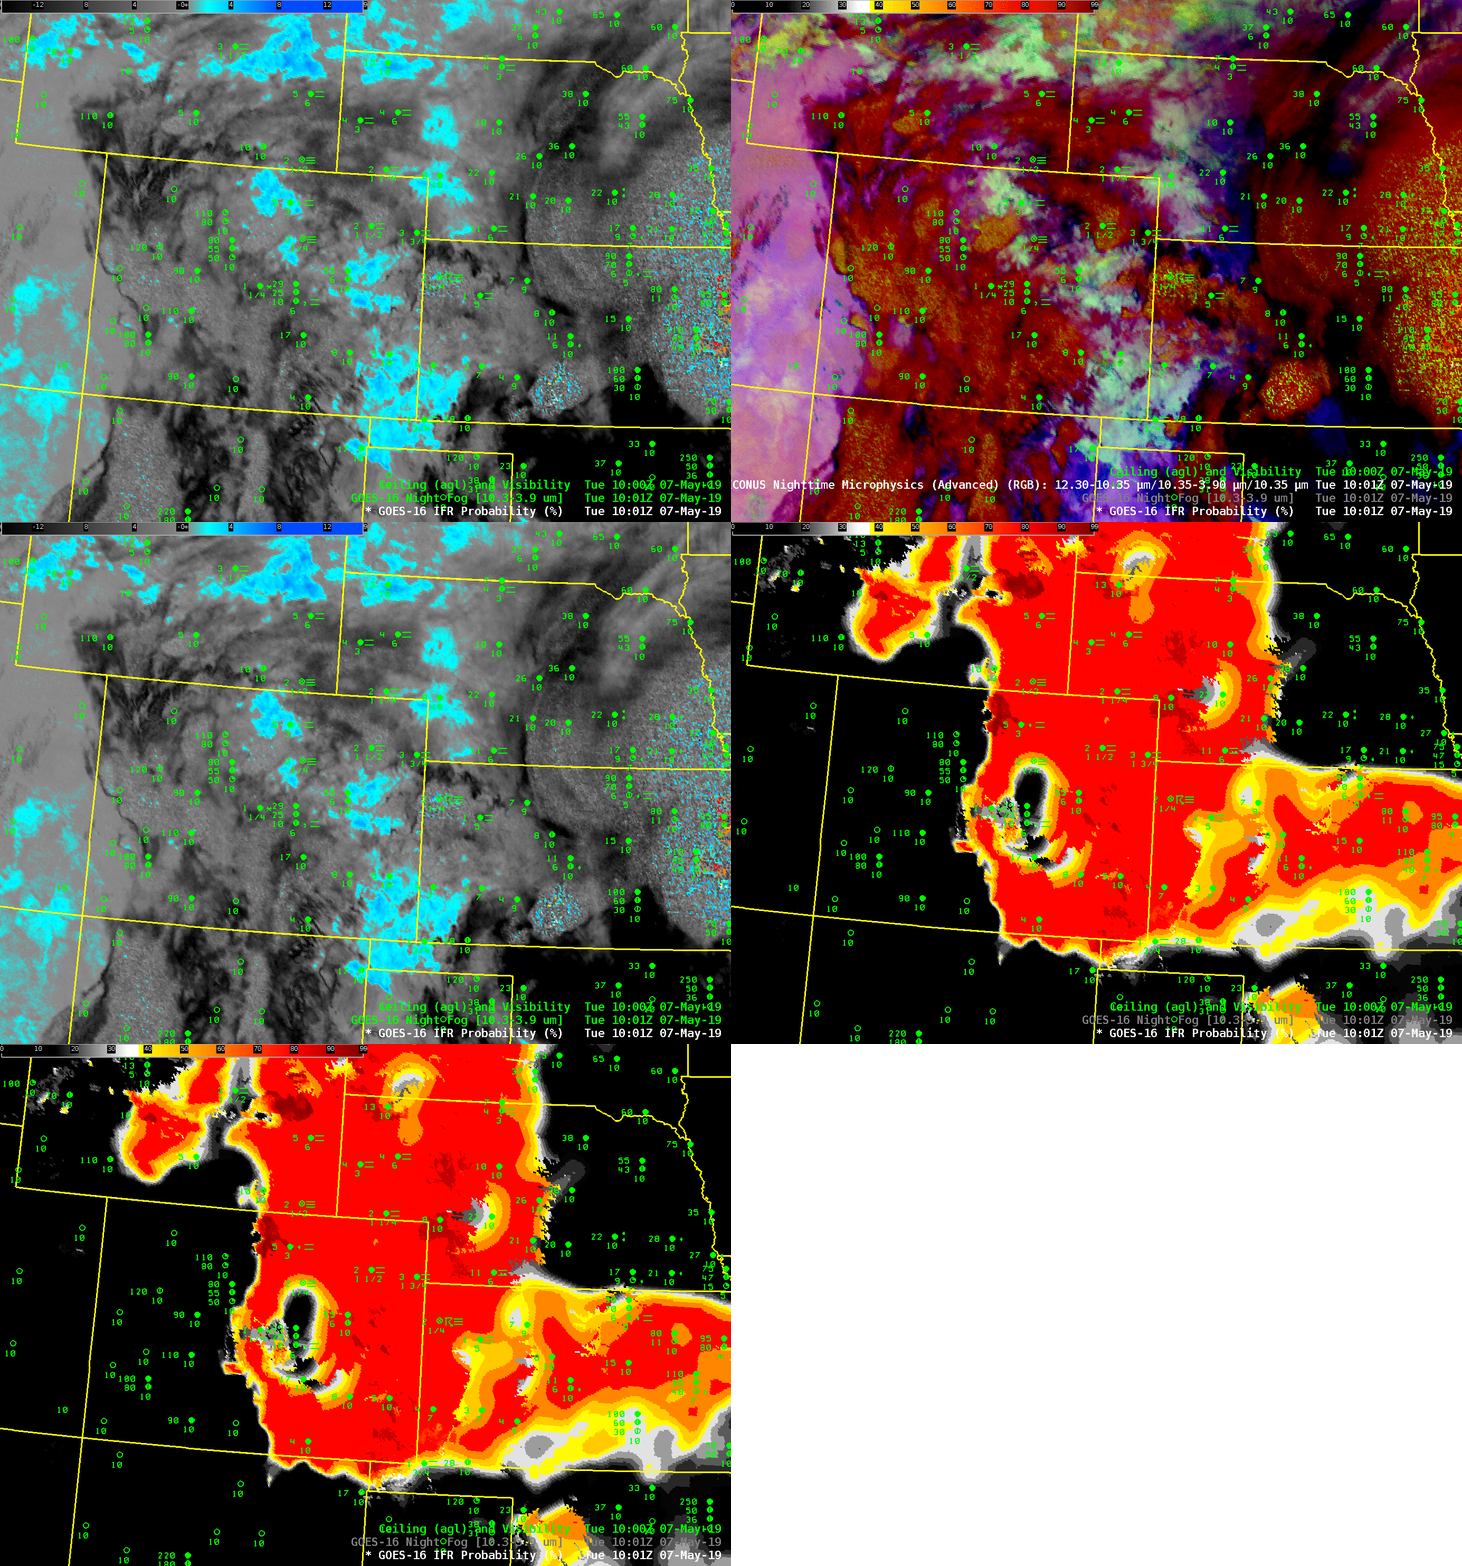
Because the NightTime Microphysics RGB relies on the Night Fog Brightness Temperature difference field, it rises or falls on fog detection on the shoulders of the Brightness Temperature Difference field. On this day, it fell. Click here for the Nighttime Microphysics RGB animation; the animation below toggles between the three fields — Night Fog Brightness Temperature Difference, Nighttime Microphysics RGB, and IFR Probability — at 1002 UTC on 7 May 2019.

