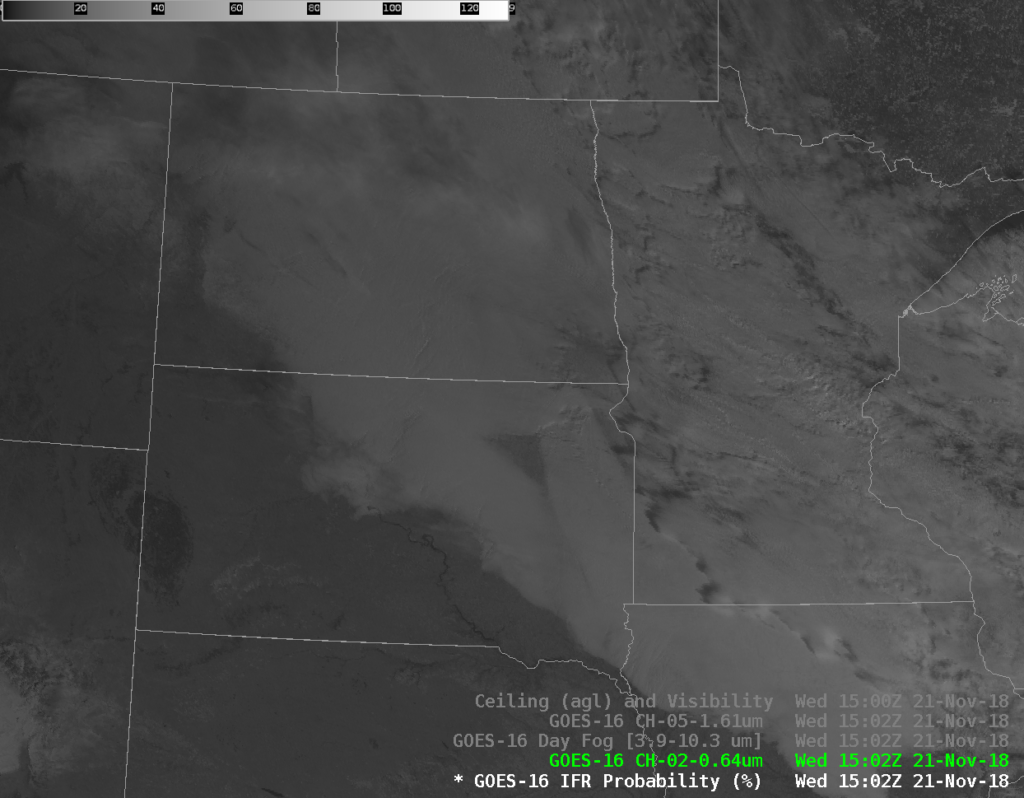
Consider the GOES-16 Visible (Band 2, 0.64 µm) Image above. Where is the fog in this image? Certainly you can tell where clouds exist, and if animated, you could identify snow on the ground (because it wouldn’t move like clouds do). Alternatively, you could toggle between the visible and the Snow/Ice band (Band 5, 1.61 µm), below; regions of snow/ice — such as in western North Dakota, or northeastern South Dakota, or Ontario appear bright in the 0.64 µm but dark in the 1.61 µm.
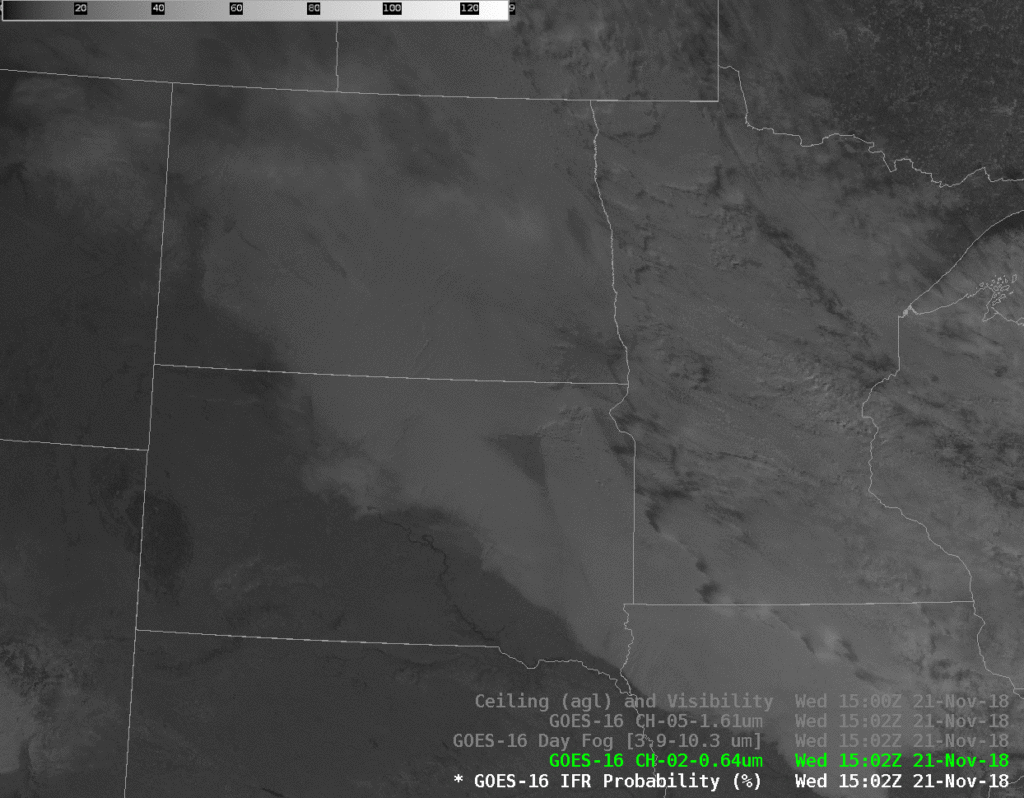
GOES-16 “Red Visible” Band 2 0.64 µm imagery and “Snow/Ice” Band 5 1.61 µm imagery at 1502 UTC on 21 November 2018 (Click to enlarge)
The Day Fog Brightness Temperature Difference product (3.9 µm – 10.3 µm) highlights low clouds. Stratus clouds with water droplets are scatterers of incoming solar radiation. The clouds over Minnesota and Iowa appear to be composed of much smaller water droplets, however, because they are so much warmer — the brightness temperature difference is much larger. Smaller droplets are better scatterers of incoming solar radiation. The image below shows the field, also at 1502 UTC on 21 November. Are there any differences in this field that suggests fog might be present in one location, but not in the other?
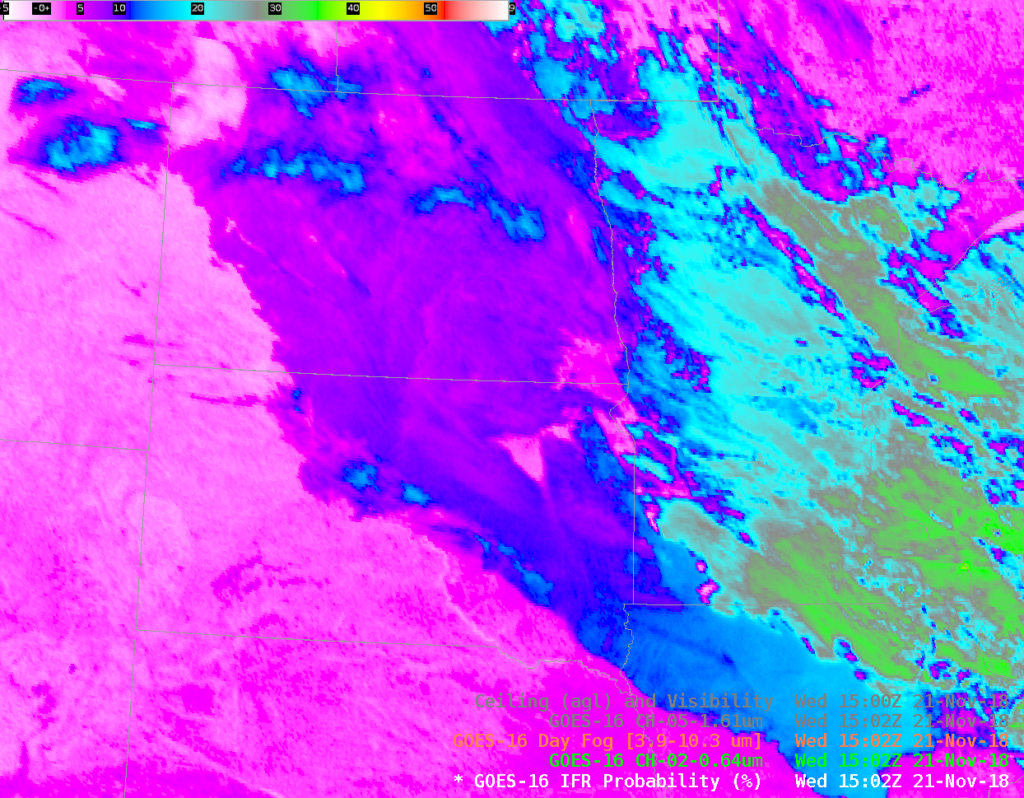
GOES-16 Day Fog Brightness Temperature Difference (3.9 µm – 10.3 µm) imagery at 1502 UTC on 21 November 2018 (Click to enlarge)
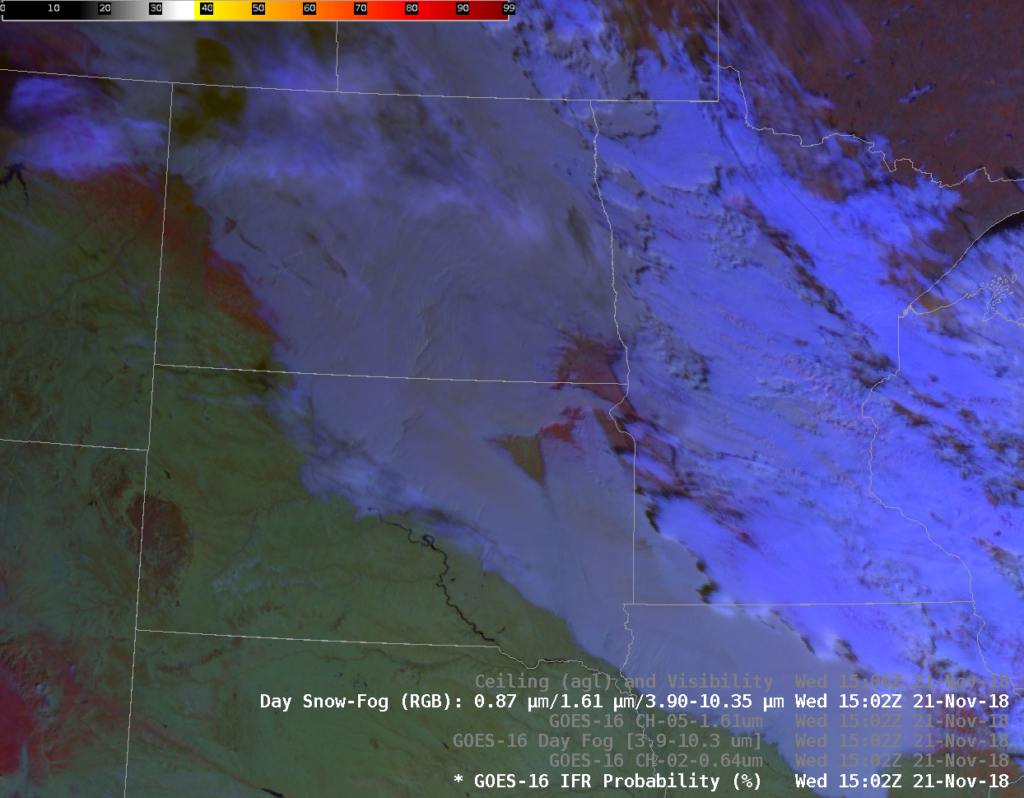
The Day Snow Fog RGB composite, below, highlights regions of low clouds, snow/ice, and higher clouds. Snow (and clouds made of ice) are shaded red, low clouds are shades of grey/blue. Where is the fog?
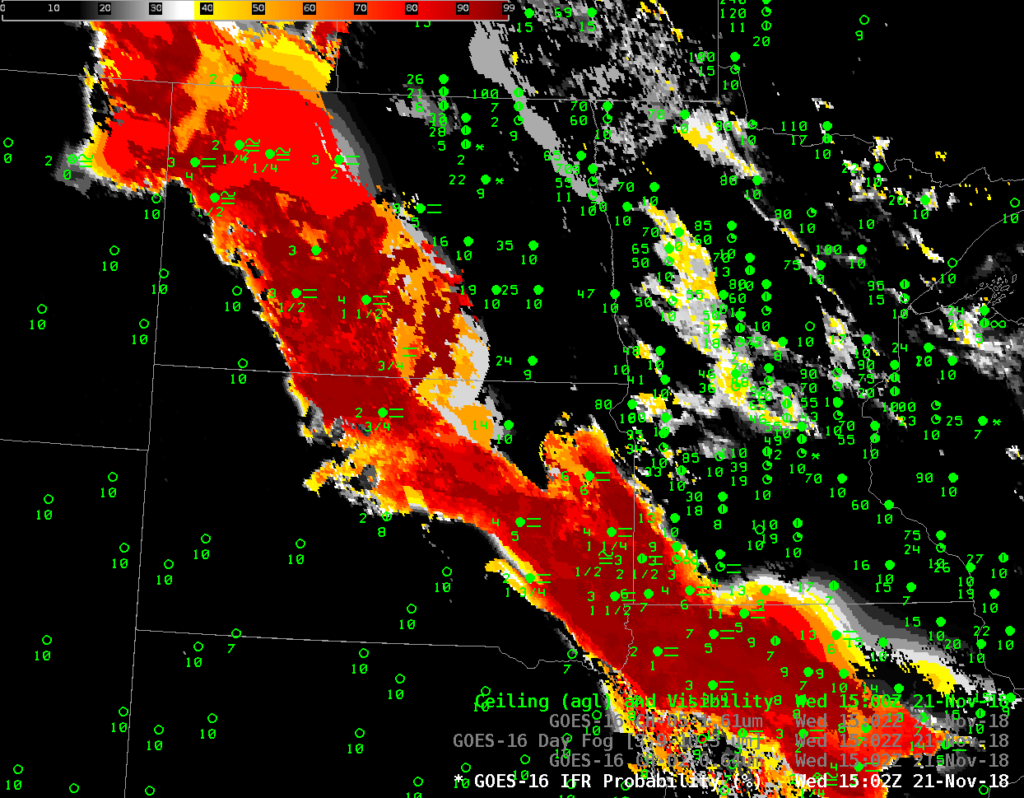
GOES-R IFR Probability Fields are a better predictor of where IFR conditions (that is, reduced visibility and lowered ceilings as might occur with fog) are occurring. It combines satellite information and low-level informatio0n about saturation (from the Rapid Refresh model). This fusing of data accentuates a satellite strength (detection of low clouds made up of water droplets — that is, stratus) and the model strength (namely, where are the low-level saturated?) In the image below, fog and high probabilities of IFR conditions neatly overlap. This toggle is between the visible, Day Snow-Fog RGB and IFR Probability field.

