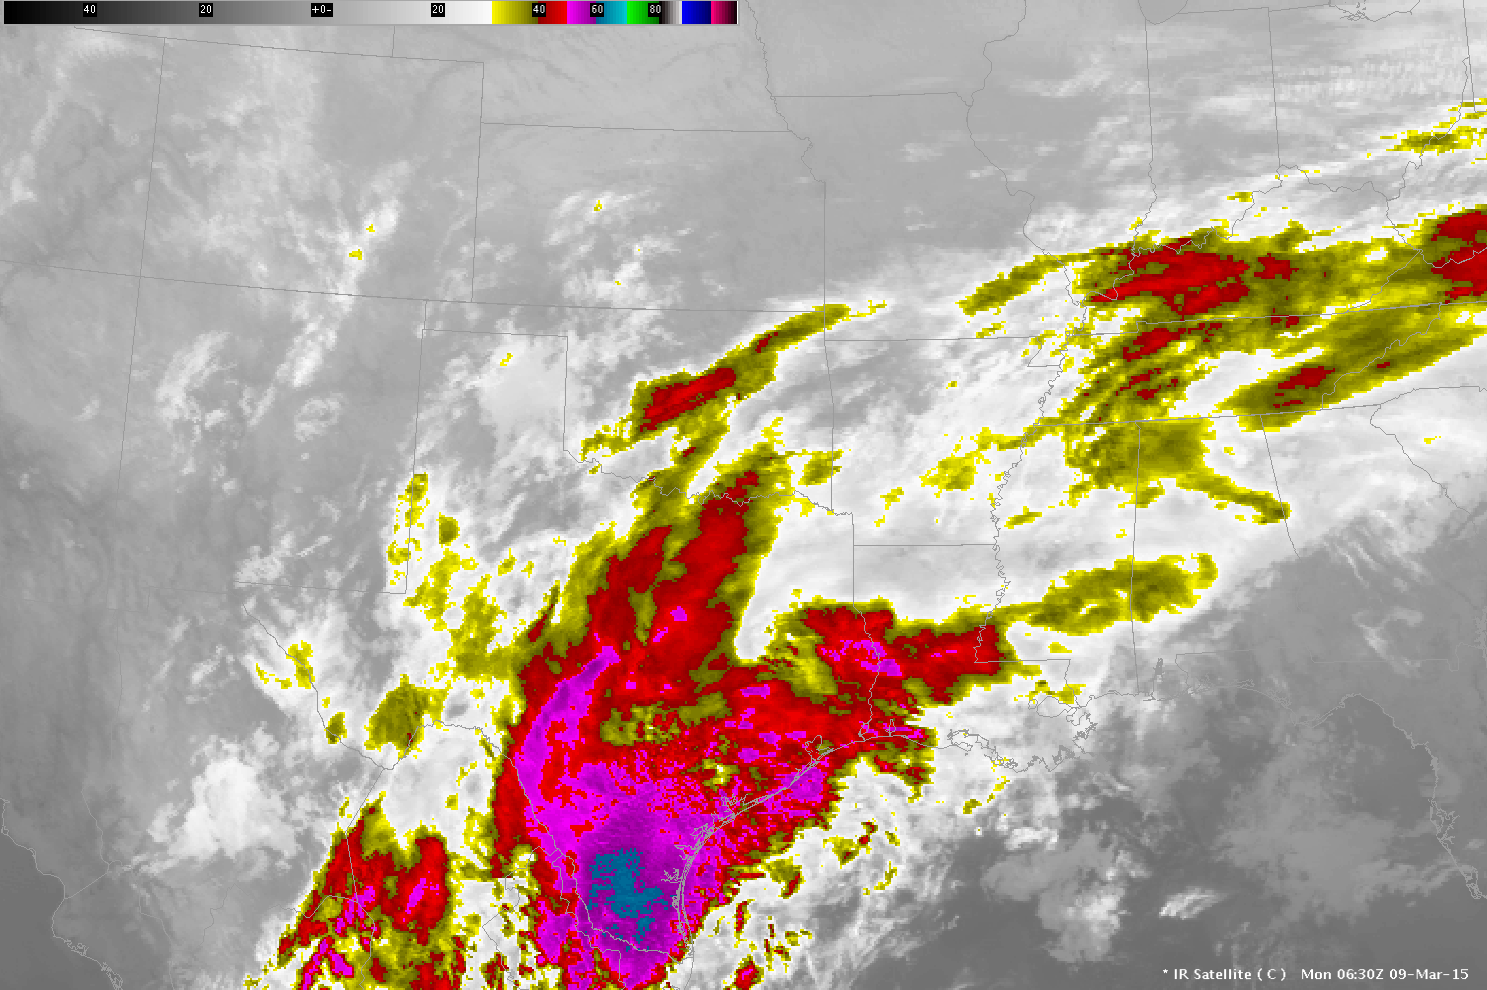
The 10.7 µm imagery from GOES-East (Band 4) shows a cloud signature that is typical of a developing low-pressure system that one might find to the east of an open wave at 300 mb. Using satellite data alone to deduce (or perceive) the presence of IFR conditions in this case will be difficult. GOES Sounder Estimates of Total Precipitable Water in the region (from here) give little information.
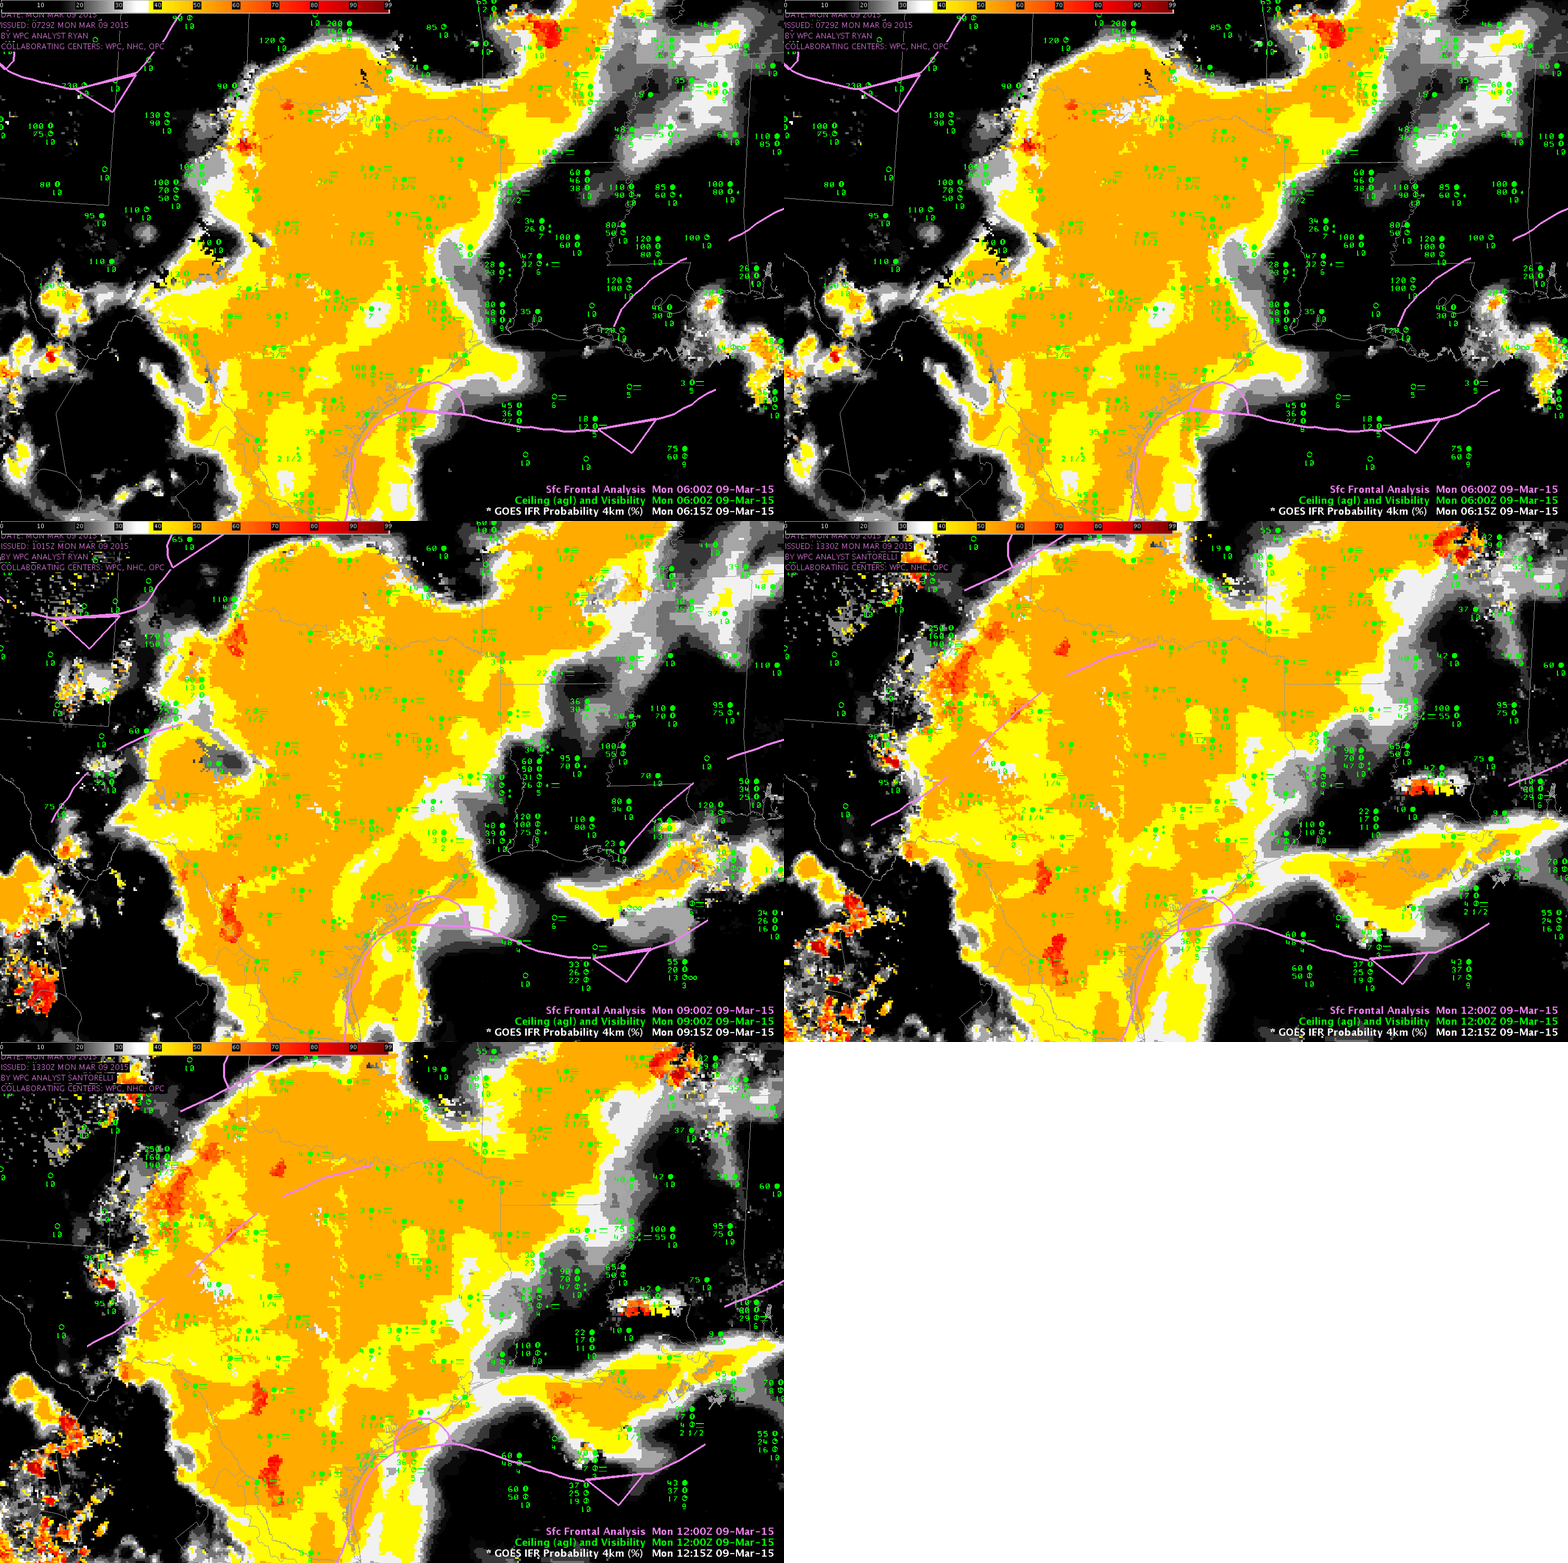
GOES-R IFR Probability fields blend together satellite information with moisture information from the Rapid Refresh (also included: slowly varying fields such as Sea Surface Temperature and surface emissivity). The animation below, showing the field at 0615, 0915 and 1215 UTC, demonstrates the product’s ability to distinguish between regions with cloud (Louisiana) and regions with fog/low stratus (Much of east Texas, stretching up into central Arkansas; observations show IFR or near-IFR conditions widespread in this area). Because satellite data are unavailable for the product (only water-based cloud information is used, typically, and multiple cloud layers associated with deep clouds include mixed phase and ice clouds) the fields are fairly uniform. Where holes in the clouds appear — over the Rio Grande at 0915 UTC and over parts of south Texas at 1215 UTC — IFR Probabilities look more pixelated and Probabilities are higher. The larger IFR Probabilities occur because satellite predictors are incorporated into the algorithm where low clouds are detected.


