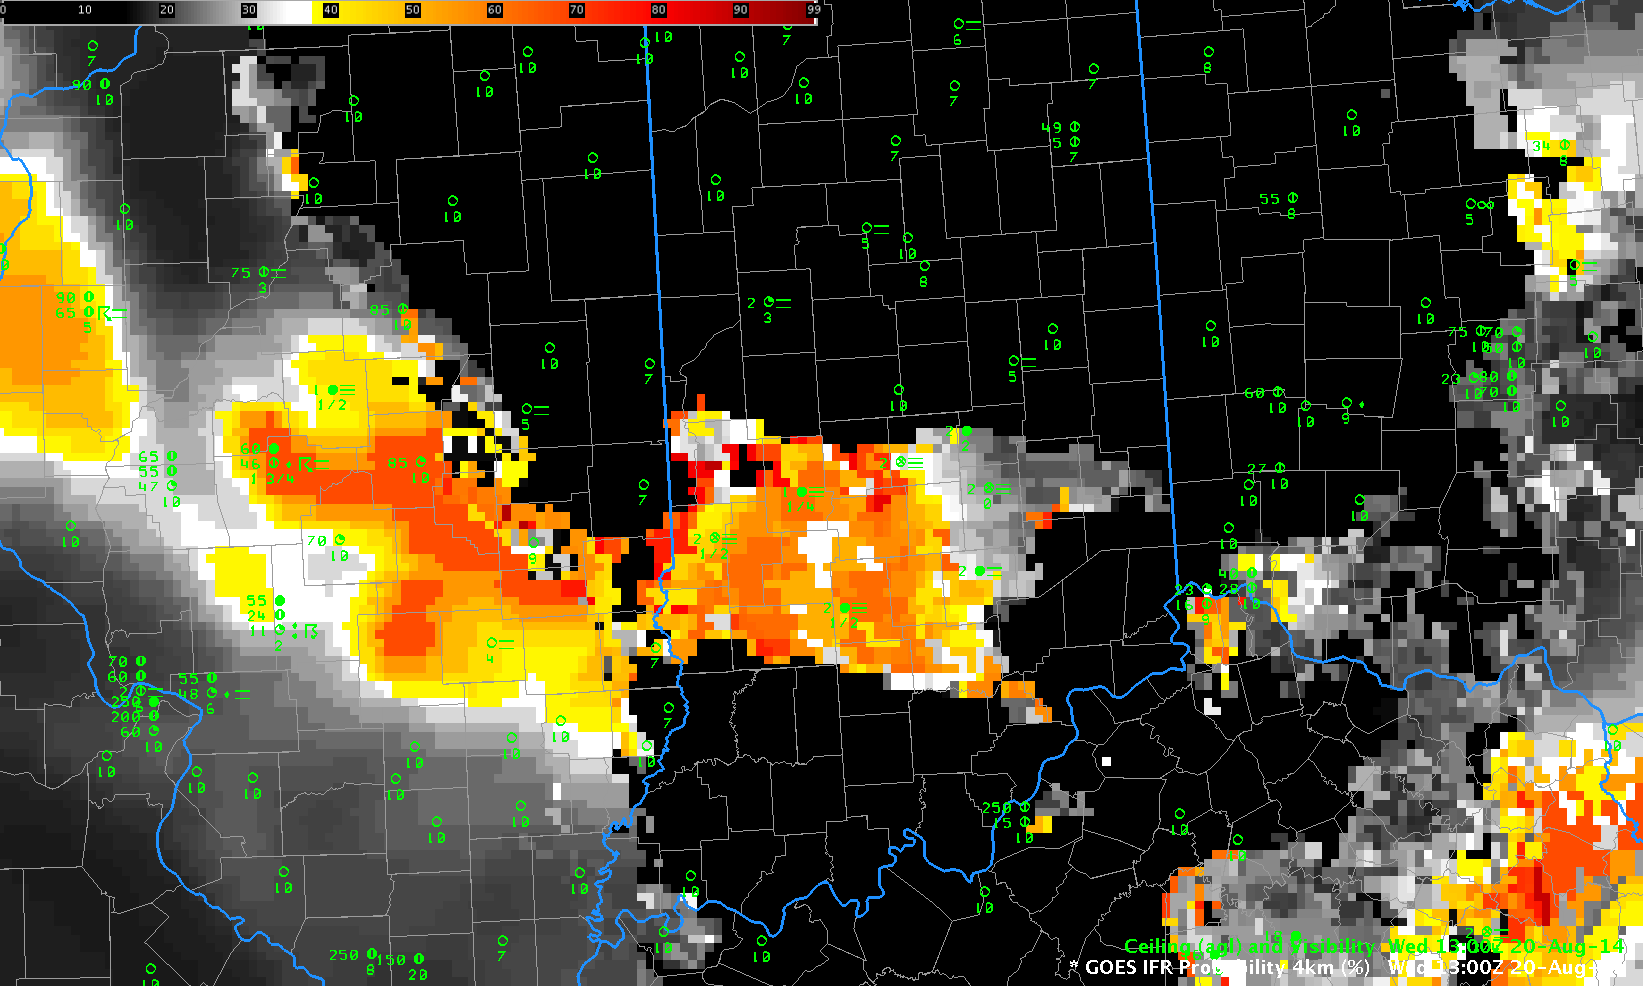
GOES-R IFR Probabilities computed from GOES-13 data, 1300 UTC 20 August 2014
A small area of IFR conditions developed over southern Indiana during the overnight/early morning hours of 20 August, and the imagery in this post serves as a good tutorial for how to interpret GOES-R IFR Probabilities. The 1300 UTC imagery, above, is from after sunrise; therefore, the cloud-clearing algorithm (that includes visible imagery) will do a good job of screening out regions where widespread fog is not present (Compare this image to the 1000 UTC image that cannot use visible imagery below). The highest IFR Probabilities are confined to the region over southern Indiana where ceilings and visibilities are near or below IFR conditions. The effect of a large convective complex with multiple cloud layers on the IFR probabilities is apparent over Illinois. There, IFR Probabilities have a very smooth appearance because satellite predicitors (which predictors can be pixelated in appearance) are not used: only model data are driving the IFR Probability over most of Illinois. The Brightness Temperature Difference field, below, (10.7 µm – 3.9 µm), the heritage method of identifying regions of low clouds, displays the difficulty inherent in the field after sunrise: solar radiation with a wavelength of 3.9 µm changes the character of the difference field, making interpretation difficult.
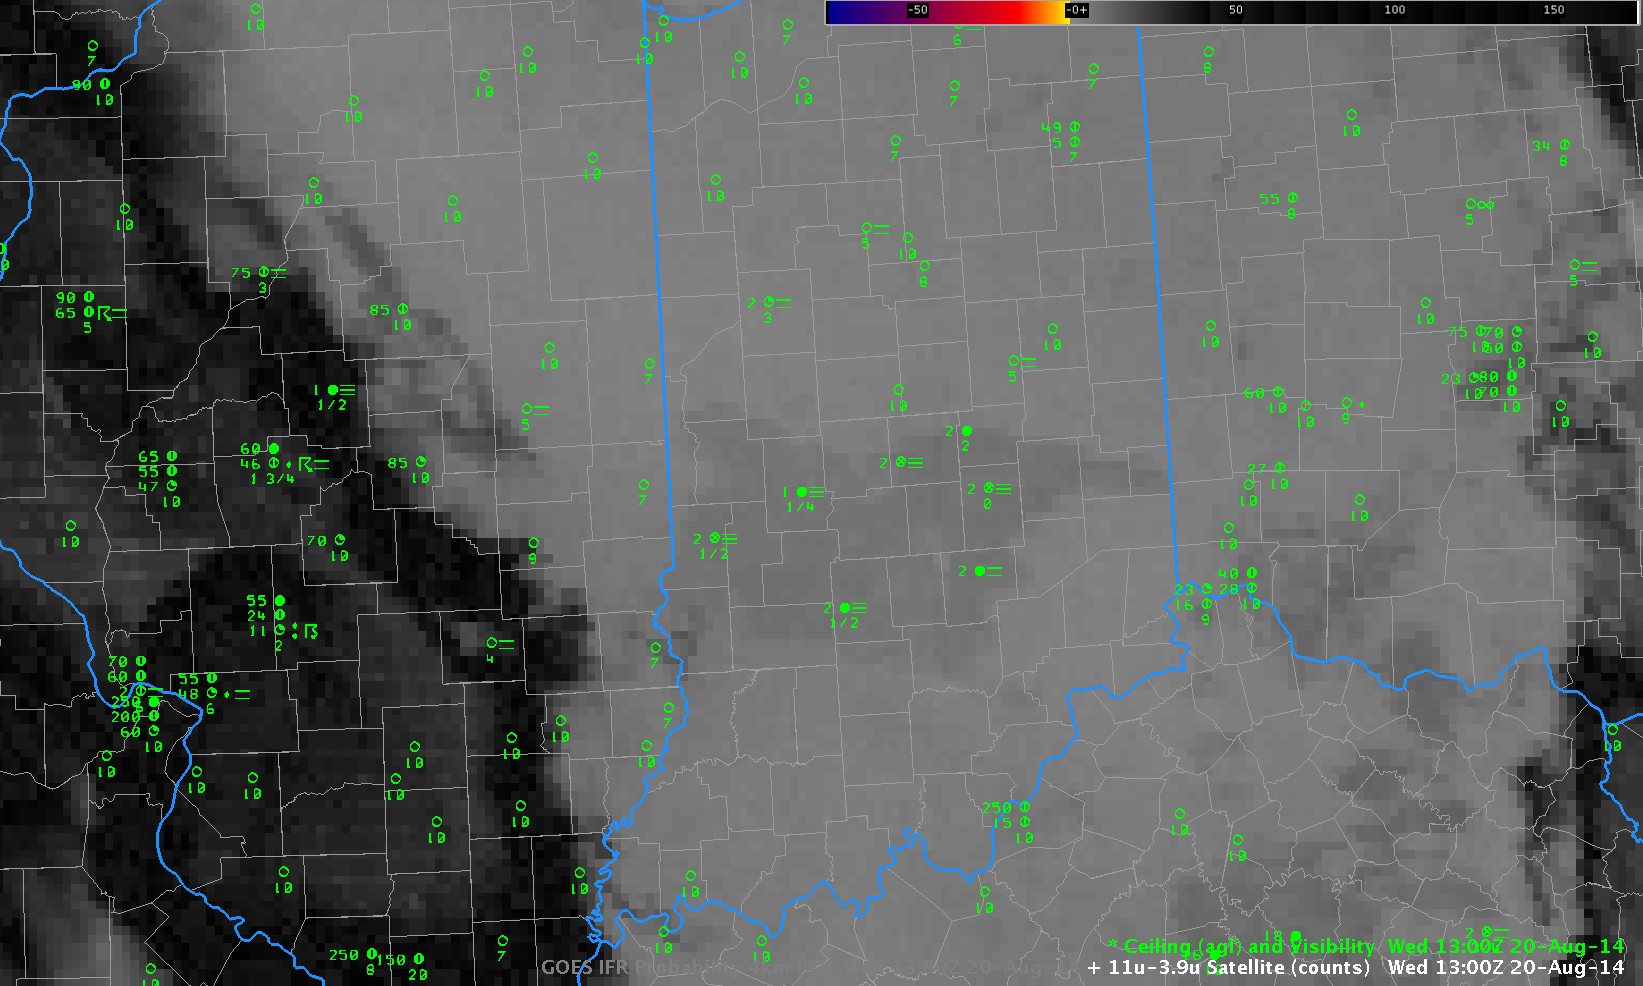
GOES-13 Brightness Temperature Difference Field (10.7 µm – 3.9 µm) 1300 UTC 20 August 2014
The GOES-13 Brightness Temperature Difference field at 1000 UTC, below, has a more characteristic look for a scene with fog and low stratus present. However, the signal overpredicts where reduced ceilings/visibilities are actually occurring. Mid-level stratus and fog can look very similar when viewed from a satellite. The IFR Probability field at the same time (1000 UTC), at bottom, has highest probabilities over the region of IFR conditions — over southern Indiana. Some regions with a strong Brightness Temperature Difference signal — for example, in western Illinois near Moline/Davenport — have a comparatively weak IFR Probability signal. In those regions, the Rapid Refresh model is correctly suggesting that low-level saturation is unlikely.
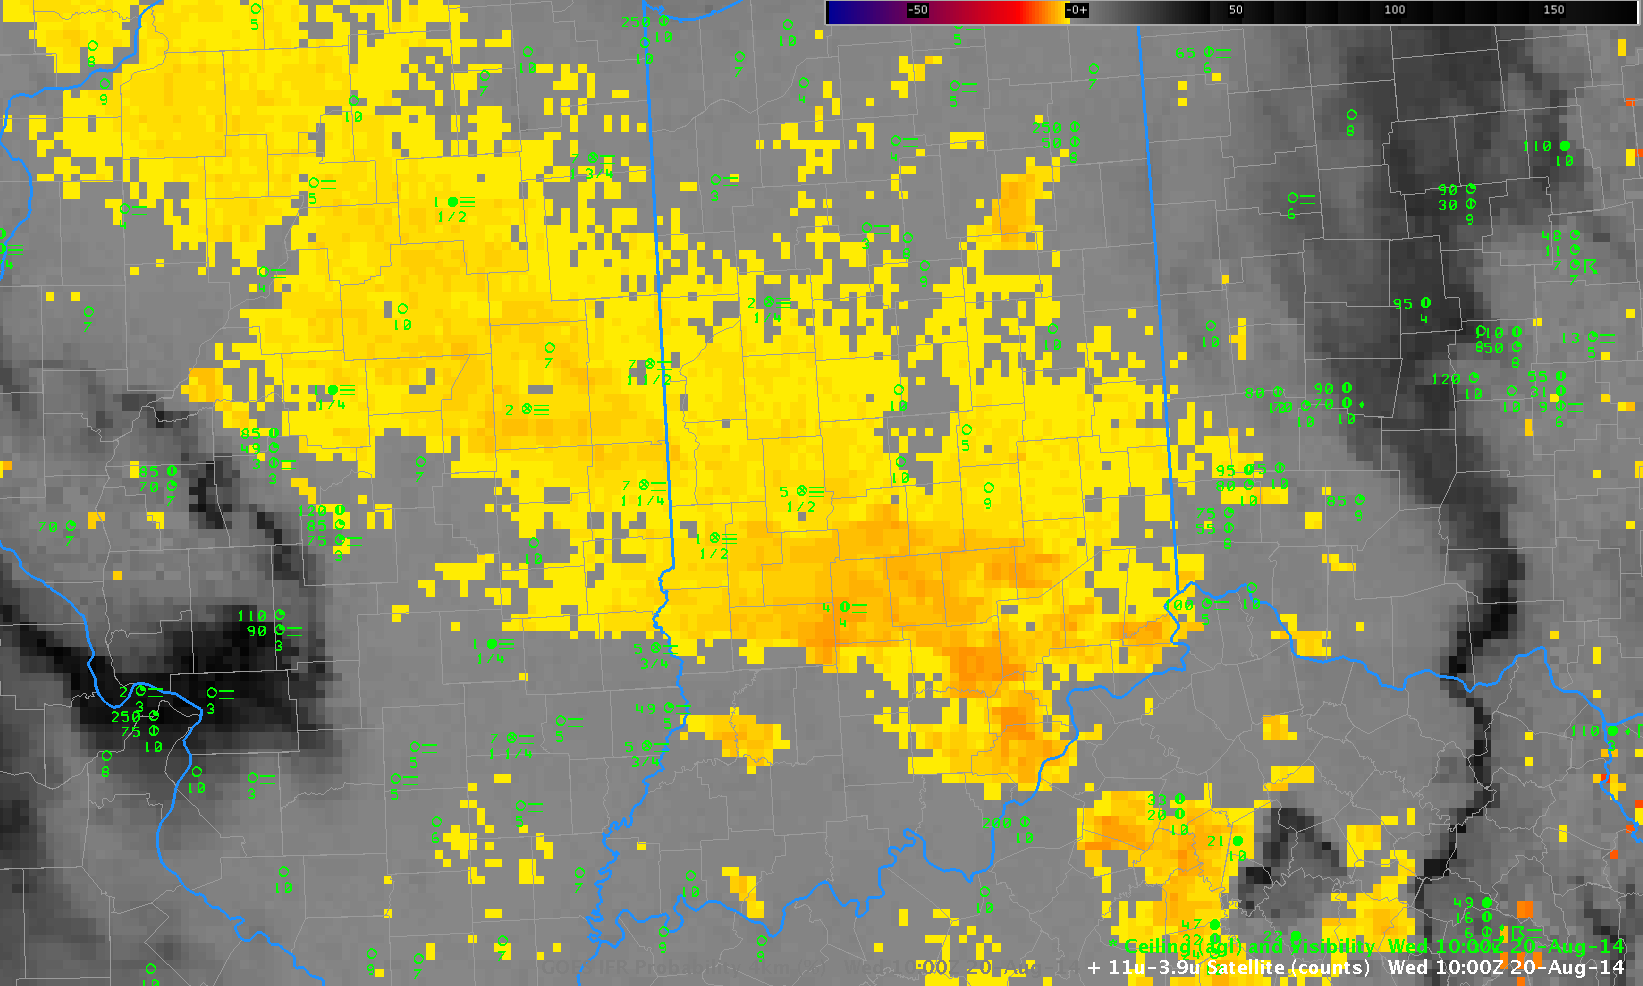
GOES-13 Brightness Temperature Difference Field (10.7 µm – 3.9 µm) 1000 UTC 20 August 2014
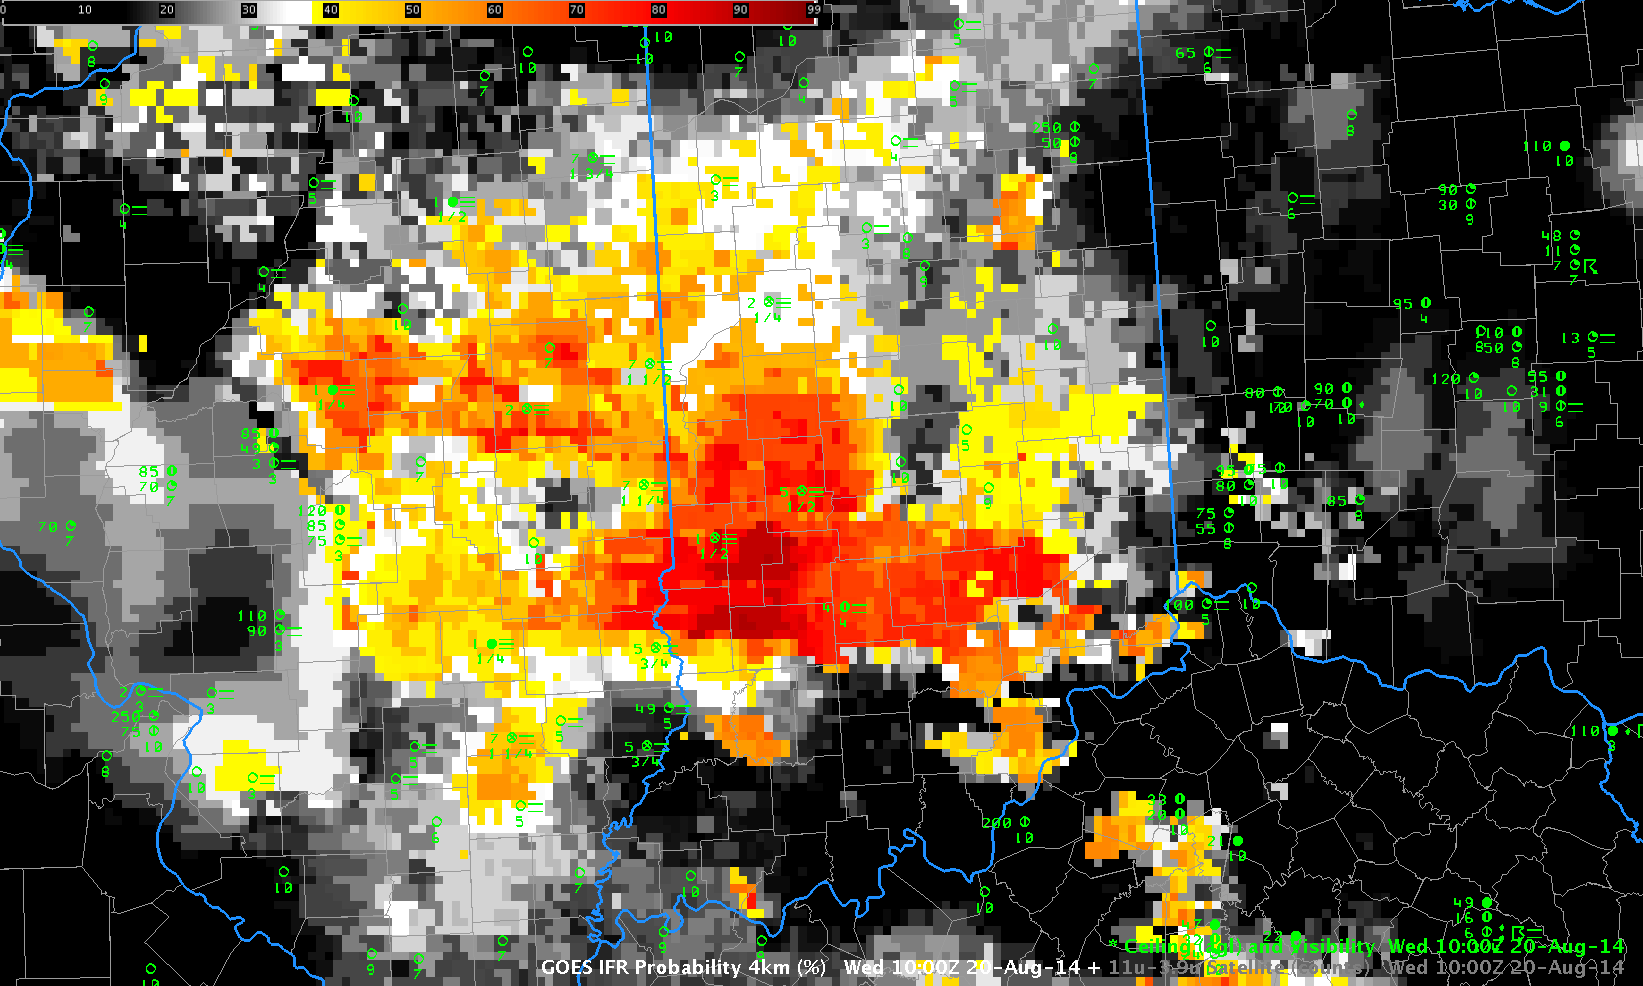
GOES-R IFR Probabilities computed from GOES-13 data, 1000 UTC 20 August 2014