Monthly Archives: August 2020

Fog over western Kansas

GOES-16 Low-IFR Probability, 0846 to 1341 UTC on 14 August 2020 (Click to enlarge)

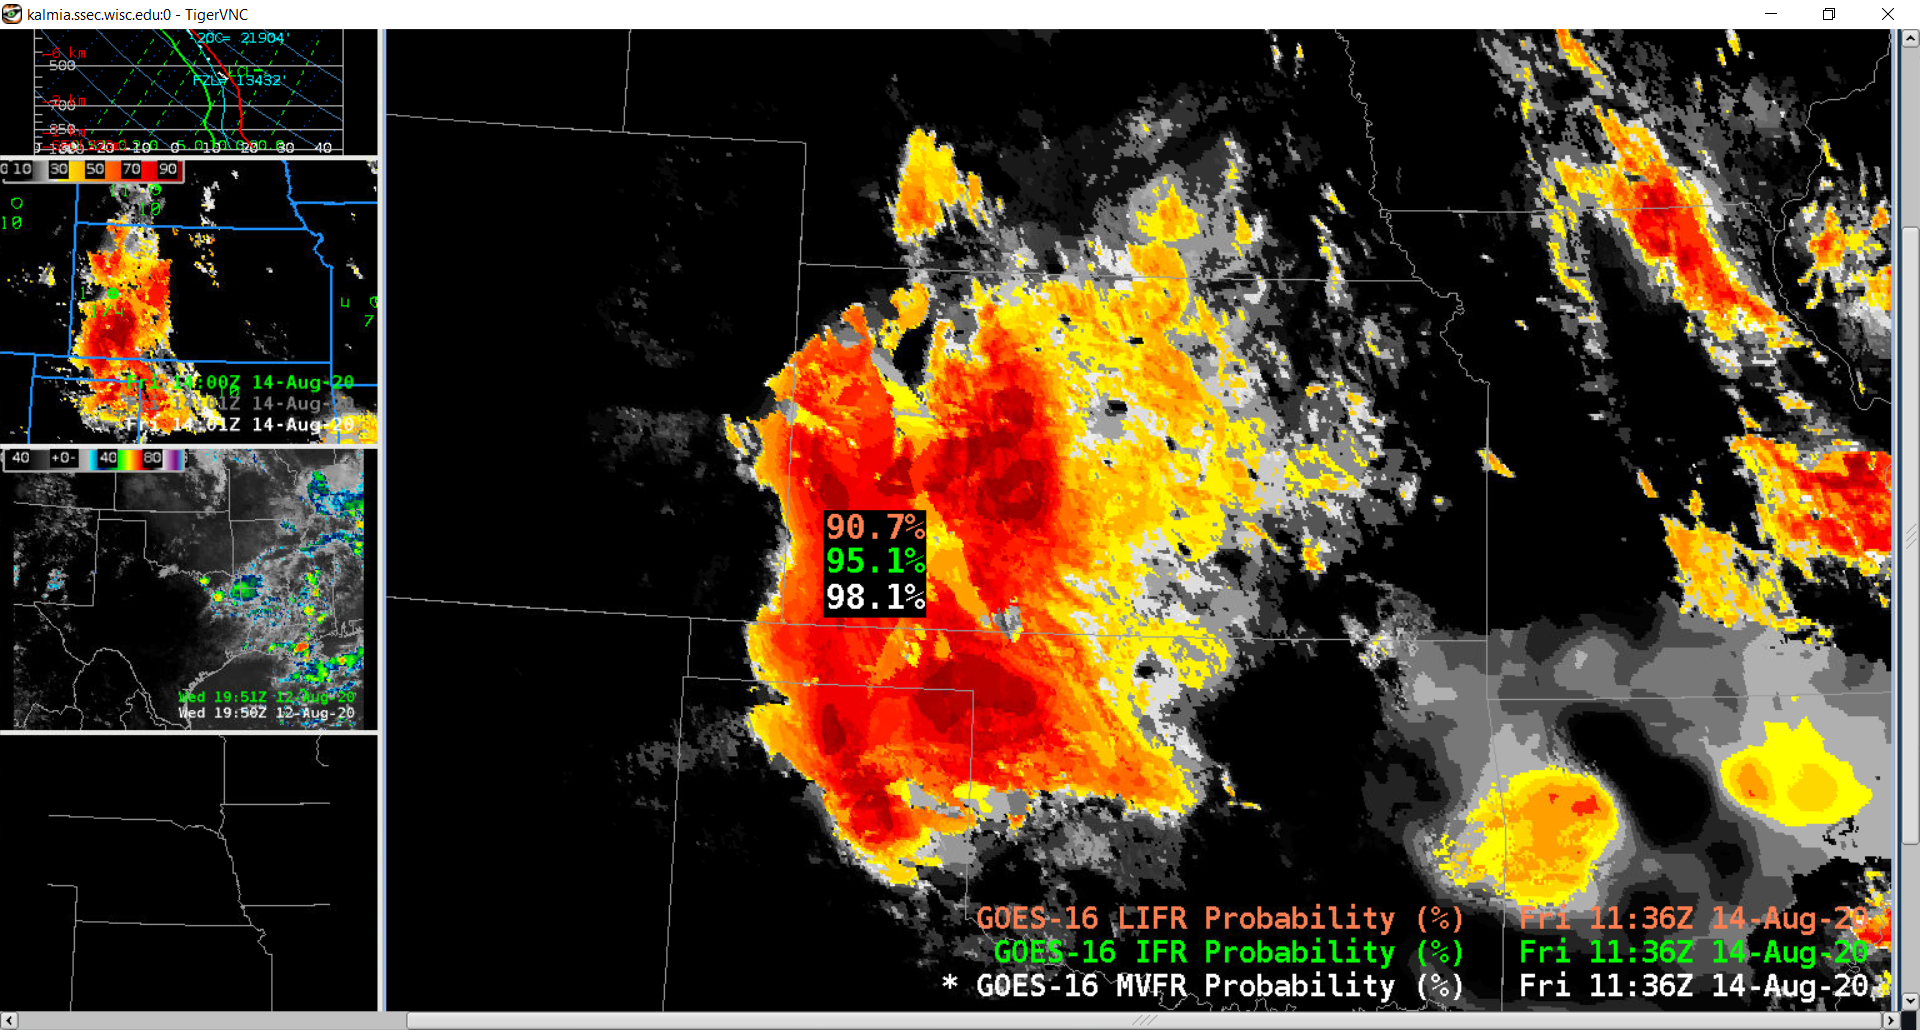
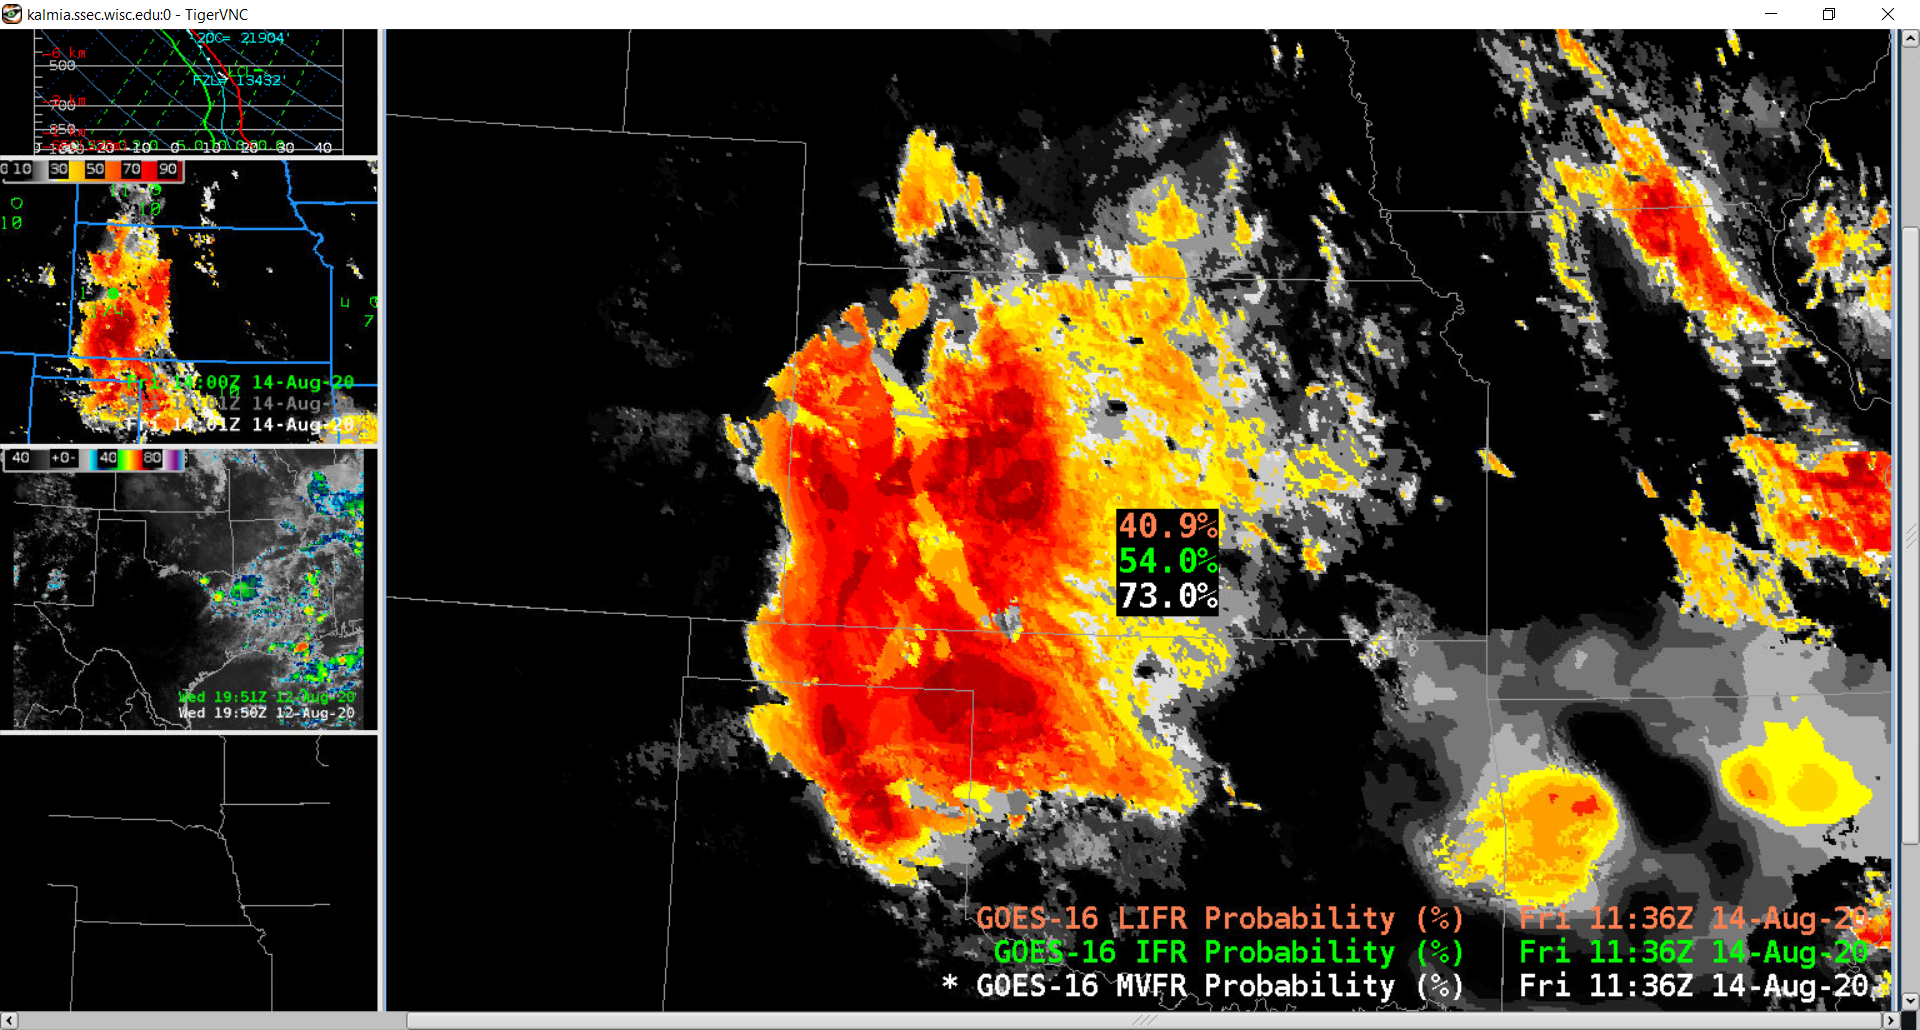
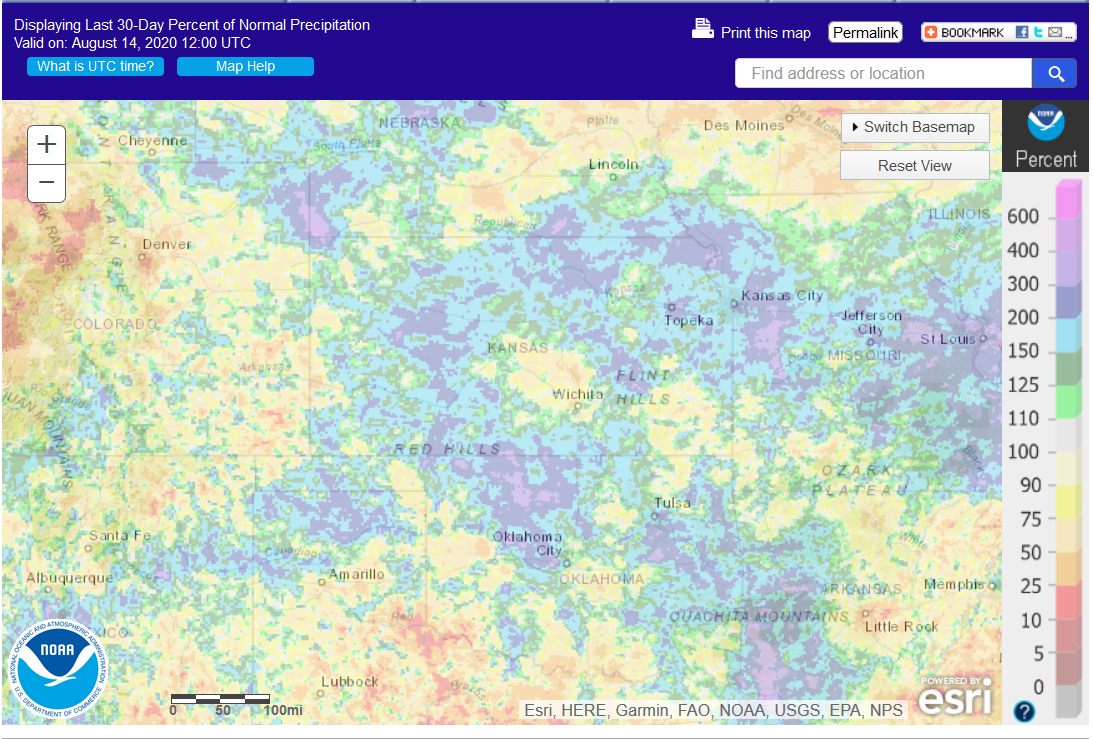
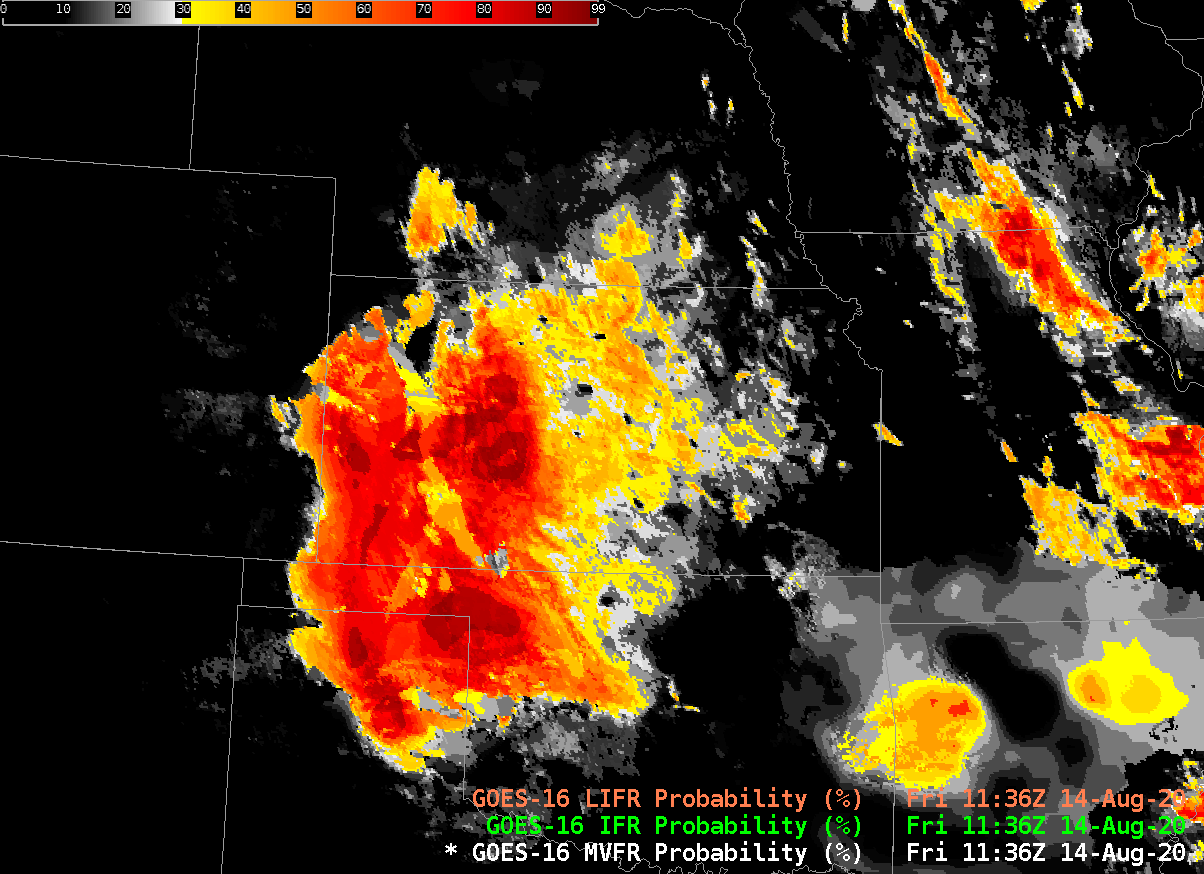
Fog developed over western Kansas during the early morning of 14 August 2020 (helped along by above-normal precipitation in the past 30 days — shown here in an image created at this website).  Low IFR Probability fields, above, show greatest probabilities of low ceilings and visibility restrictions in regions where they were observed:  over western Kansas, with a sharp cut-off at the Colorado/Kansas border, and over western Oklahoma and the north Texas panhandle.

Compare the evolution of the Low IFR Probability field, above, to the evolution of the Night Fog brightness temperature difference (10.3 µm – 3.9 µm) field below.

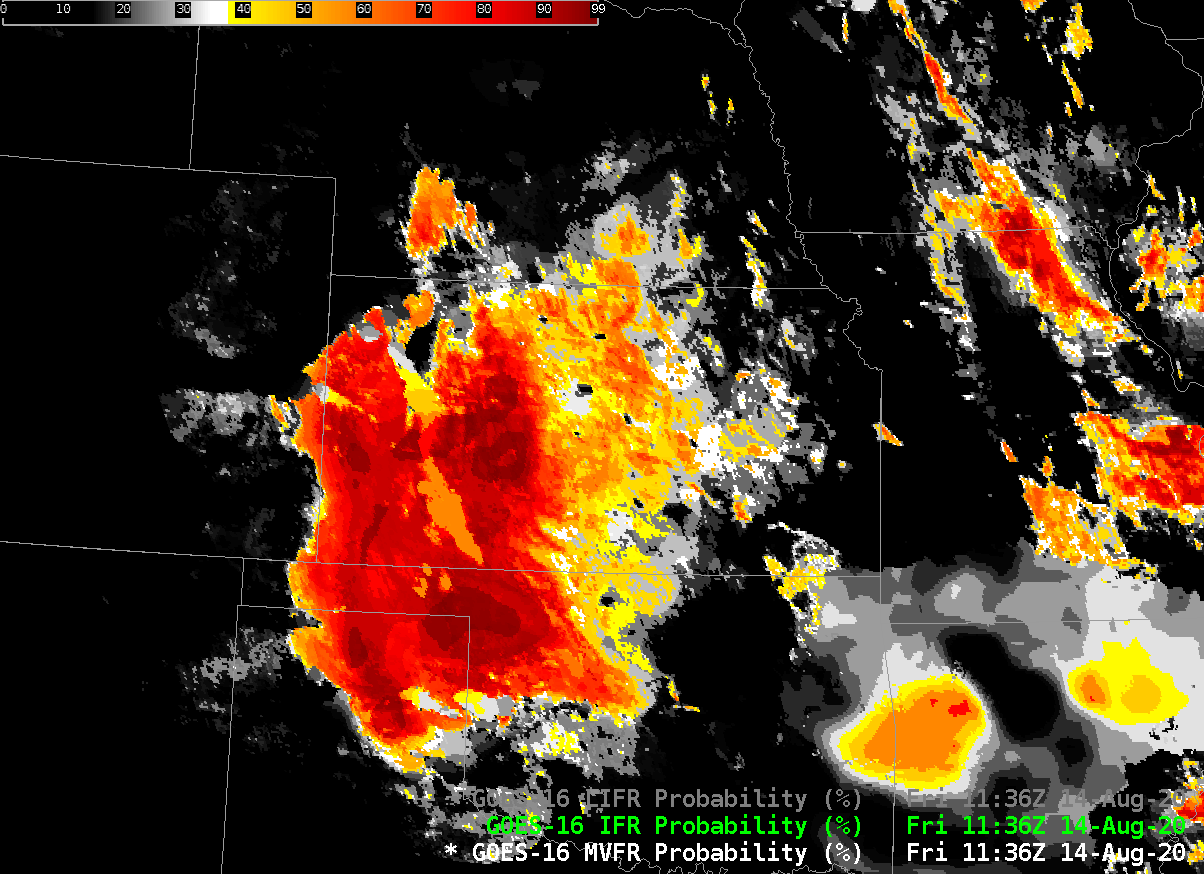
  1. The Night Fog field, below, has a region of strong return over western Kansas, but also two regions of weaker signals over central Kansas (where low clouds/fog are observed;  note the regions in the brightness temperature difference field where the signal is very small, small grey pockets within the cyan, corresponding to the locations of towns in central Kansas) and over eastern Colorado (where low clouds/fog are not observed).  Low IFR Probability fields are able to distinguish between the central Kansas and eastern Colorado because model predictions of low-level saturation are used to modulate the satellite-based signal:  Low IFR Probability values are very small over Colorado (where the Rapid Refresh model is not predicting low-level saturation); values are larger over Kansas where ceiling and visibility reductions are occurring and where the Rapid Refresh model is suggesting low-level saturation is present).  The brightness temperature difference field in Colorado might be driven by dry soils rather than low clouds.  A brightness temperature difference signal can emerge at night because of soil emissivity differences (as noted earlier in this blog here).
  2. Low IFR Probability fields are augmented underneath the convection that is apparent in the brightness temperature difference field over northwestern Arkansas.  Satellite detection through the deep convection of low stratus in this region is impossible; the signal is driven by low-level saturation predicted by the Rapid Refresh model output.
  3. As the sun rises, the brightness temperature difference field loses obvious cloud-detection signal because increasing amounts of reflected solar radiation (at 3.9 µm) overwhelm the emissivity-driven difference over low clouds at 3.9 µm and 10.3 µm.  At some point after sunrise, the brightness temperature difference flips sign (and appears dark in the enhancement) because there is far more reflected solar radiation at 3.9 µm than at 10.3 µm.
  4. The Low IFR Probability field by design includes temporal continuity around sunrise and sunset.  This is most noticeable over central Kansas.  The terminator sweep is noticeable in the field, but the values change only slowly in the hour surrounding the terminator.  This temporal continuity is necessary because of the quick changes in detected 3.9 µm radiation that are occurring as solar reflectance changes occur.
GOES-16 Night Fog Brightness Temperature Difference (10.3 µm – 3.9 µm). 0846 to 1341 UTC on 14 August 2020 (Click to enlarge)

The relationship between MVFR Probability, IFR Probability and Low IFR Probability

GOES-16 MVFR Probability, IFR Probability and Low IFR Probability, 1136 UTC on 14 August 2020 (Click to enlarge)

Most of the posts on this blog discuss IFR Probability: The probability that IFR conditions are occurring. IFR, or Instrument Flight Rules conditions are defined as ceilings between 1000 and 3000 feet and/or visibilities between 1 and 3 miles. Two other Probability fields are created: MVFR Probabilities (MVFR, or Marginal Visual Flight Rules, are defined as ceilings between 3000 and 5000 feet and/or visibilities between 3 and 5 statute miles) and Low IFR Probabilities (LIFR, ceilings below 1000 feet and/or visibilities less than 1 mile). The animation above steps through the three fields from one time: MVFR Probability, IFR Probability and Low IFR Probability. As might be expected, MVFR Probability > IFR Probability > LIFR Probability.

Cursor readouts in AWIPS imagery are shown below; LIFR Probability fields are shown with the other two Probability fields are loaded underneath. The cursor readout (for the point just north and west of the upper left corner of the readout values) shows the relationship between the three fields. Low IFR Probability is shown in coral, IFR Probability in green, MVFR Probability in white. MVFR Probability values > IFR Probabilty values > LIFR Probability values.

GOES-16 Low IFR Probability with cursor readout of Low IFR Probability, IFR Probability and MVFR Probability, 1136 UTC 14 April 2020 (Click to enlarge)

IFR Probability as a Heads Up in Indiana

Because IFR Probability includes both model information on low-level saturation and satellite information on low-level clouds, it can give an advanced warning on the development of fog when high clouds — at might occur behind departing convection, for example — prevent the satellite from viewing the low cloud beneath high clouds.  Consider the animation below, that shows IFR Probability fields along with surface observations of ceilings and visibilities plotted so that regions with IFR conditions can be identified.  IFR probability fields develop over northwest Indiana over the course of the night, especially over extreme northern Indiana where the east-west Indiana Toll road sits.

GOES-R IFR Probability fields, along with observations of ceilings and visibility, 0051 – 1321 UTC (every 10 minutes) on 3 August 2020 (Click to enlarge)

Compare the IFR Probability fields above to the Night Fog Brightness Temperature Difference (10.3 µm – 3.9 µm) field below. The field below historically has been used at night to identify regions of low clouds/fog — regions that are cyan in the enhancement are low clouds, regions that are black are high clouds. As the sun rises, the Night Fog brightness temperature difference field will struggle to identify regions of low clouds (although a different enhacement can be used to highlight the low cloud regions after sunrise). The satellite is not able to view low clouds over northern Indiana until the high clouds move out. Thus, a distinct indication of low clouds over the Indiana Toll road lags the suggestion of low clouds given by IFR Probability fields.

GOES-16 ‘Night Fog’ Brightness Temperature Difference (10.3 µm – 3.9 µm), every ten minutes from 0051 to 1321 UTC, 3 August 2020 (click to enlarge)

Consider the toggle below of GOES-R IFR Probability, Night Fog Brightness Temperature Difference and the Nighttime Microphysics RGB at 0601 UTC on 3 August.. IFR Probability fields show a developing region of IFR conditions (in yellow) over extreme NW Indiana. The two satellite-only detectors show only a scant suggestiong that fog is present. (A similar scenario is occurring near the bootheel of Missouri)

GOES-R IFR Probability, Night Fog Brightness Temperature Difference (10.3 µm – 3.9 µm), and Nighttime Microphysics RGB, 0601 UTC on 3 August 2020 (Click to enlarge)

At 0901 UTC, below, all three indicators of low clouds are in better agreement over northwest Indiana (and over the Missouri Bootheel) as high clouds move from those areas.

GOES-R IFR Probability, Night Fog Brightness Temperature Difference (10.3 µm – 3.9 µm), and Nighttime Microphysics RGB, 0901 UTC on 3 August 2020 (Click to enlarge)

Fields at 0931 and 1001 UTC continue this trend of stronger signals in the regions initially highlighted at 0601 UTC by the IFR Probability fields.

GOES-R IFR Probability, Night Fog Brightness Temperature Difference (10.3 µm – 3.9 µm), and Nighttime Microphysics RGB, 1031 UTC on 3 August 2020 (Click to enlarge)

By 1131 UTC, below, increasing solar reflectance over the eastern part of the domain has changed the signal in both the Nighttime fog and Nighttime microphysics RGB over northern Indiana and Ohio. The GOES-R IFR Probability signal however is maintained.

GOES-R IFR Probability, Night Fog Brightness Temperature Difference (10.3 µm – 3.9 µm), and Nighttime Microphysics RGB, 1131 UTC on 3 August 2020 (Click to enlarge)