Monthly Archives: June 2020

Assessing IFR probabilties in regions with multiple cloud layers: San Francisco on 24 June 2020

GOES-17 ‘Night Fog’ Brightness Temperature Difference (10.3 µm – 3.9 µm) 0941 UTC – 1436 UTC, 24 June 2020 (Click to enlarge)

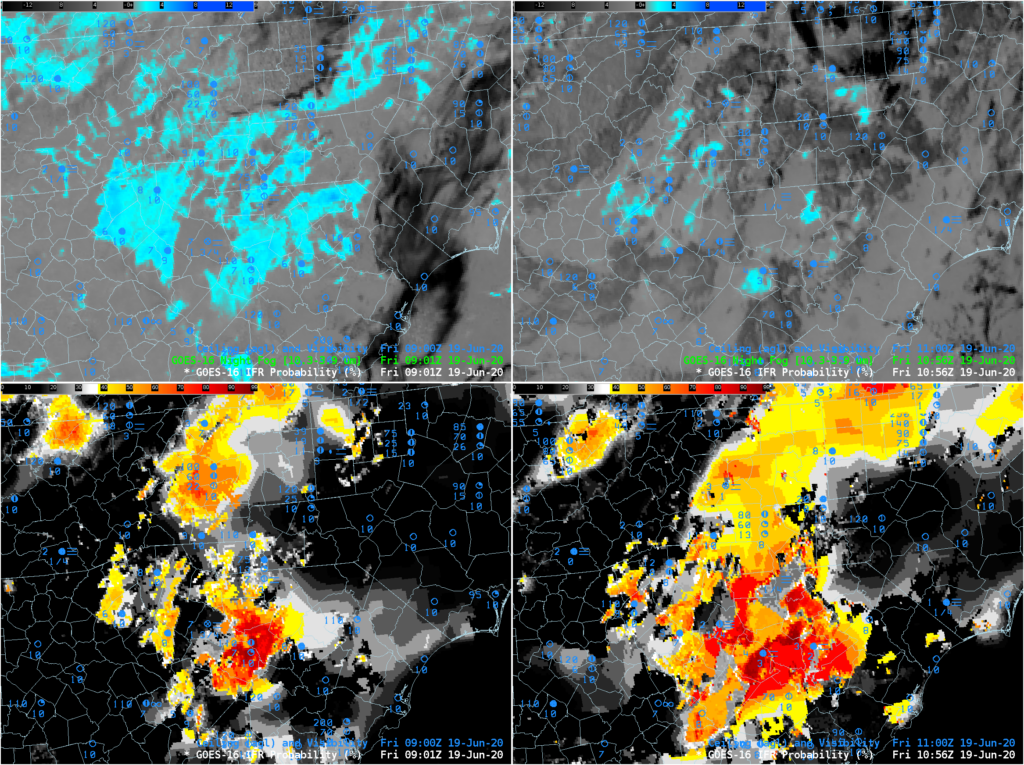
GOES-17 ‘Night Fog’ Brightness Temperature Difference imagery, above, shows a stratus deck (cyan and blue in this default AWIPS enhancement) off the central California coast. Higher clouds (grey and black in the enhancement) are drifting over San Francisco bay, obscuring the GOES-17 satellite’s view of low clouds. These high clouds can present a challenge to aviation forecasters for San Francisco’s airport, and important airline hub because the nature of low clouds cannot be determined. (Note the striping in the image is an artifact of GOES-17’s malfunctioning Loop Heat Pipe). This animation also shows the effect of increasing amounts of reflected solar radiation on the Night Fog Brightness Temperature Difference signal.

GOES-17 IFR Probability fields, below, augment information at low levels by using model (Rapid Refresh) estimates of low-level saturation (as might be found in low stratus) in the computation of IFR Probability. The animation below shows that SFO was in a region of high — but not very high — IFR Probabililty. Note also how the signal is constant through the sunrise at the end of the animation.

The airport (KSFO) did not report IFR conditions on this morning.

GOES-17 IFR Probability fields, 0941 – 1436 UTC, 24 June 2020 (Click to enlarge)

Morning IFR Conditions over South Carolina

Fog developed over North and South Carolina (some of this region has been cloudy and wet for much of the past week; here is a weekly precipitation total from this site) on the morning of 19 June 2020; the screenshot above, from this site, shows a sigmet related to the IFR conditions present:

How did GOES-R IFR Probability capture this event? The animation below, from 0900 to 1306 UTC, shows generally high IFR Probabilities over most of the region. There are stations where IFR conditions are occurring and IFR Probabilities are low: the Columbus County Municipal Airport (KCPC, in southeast North Carolina), for example, shows obstructed ceilings and reduced visibility. This might be a localized sub-pixel scale fog related to the small streams near the airport there. A similarly small-scale fog event may be happening at Macon County airport (K1A5) in western North Carolina. The 0901 UTC Brightness Temperature Difference field shows a signal consistent with valley fog along the Little Tennessee River (see image at bottom)

Note how the signal shows little discernible impact from the rising of the Sun. A strength of this product is that uniformity — in contrast to the Night Fog Brightness Temperature difference field.

GOES-16 IFR Probabilities, 0901 UTC – 1306 UTC on 19 June 2020. Surface observations of ceilings and visibilities shown in blue (Click to enlarge)

The 4-panel image below shows the ‘Night Fog’ Brightness Temperature Difference (10.3 µm – 3.9 µm, top) at 0901 and 1056 UTC and the IFR Probability fields, also at 0901 and 1056 UTC. IFR probability shows an expansion in the region of low ceilings reduced visibilities, as might be expected to occur around sunrise. The Night Fog Difference field shows a decrease in signal related to the increasing amount of reflected 3.9 µm solar insolation.

Night Fog Brightness Temperature Difference (10.3 µm – 3.9 µm), top and GOES-R IFR Probability, bottom, both at 0901 UTC (let) and 1056 UTC (right) on 19 June 2020.