Monthly Archives: December 2018

Fog over the Northeast: Where is it?

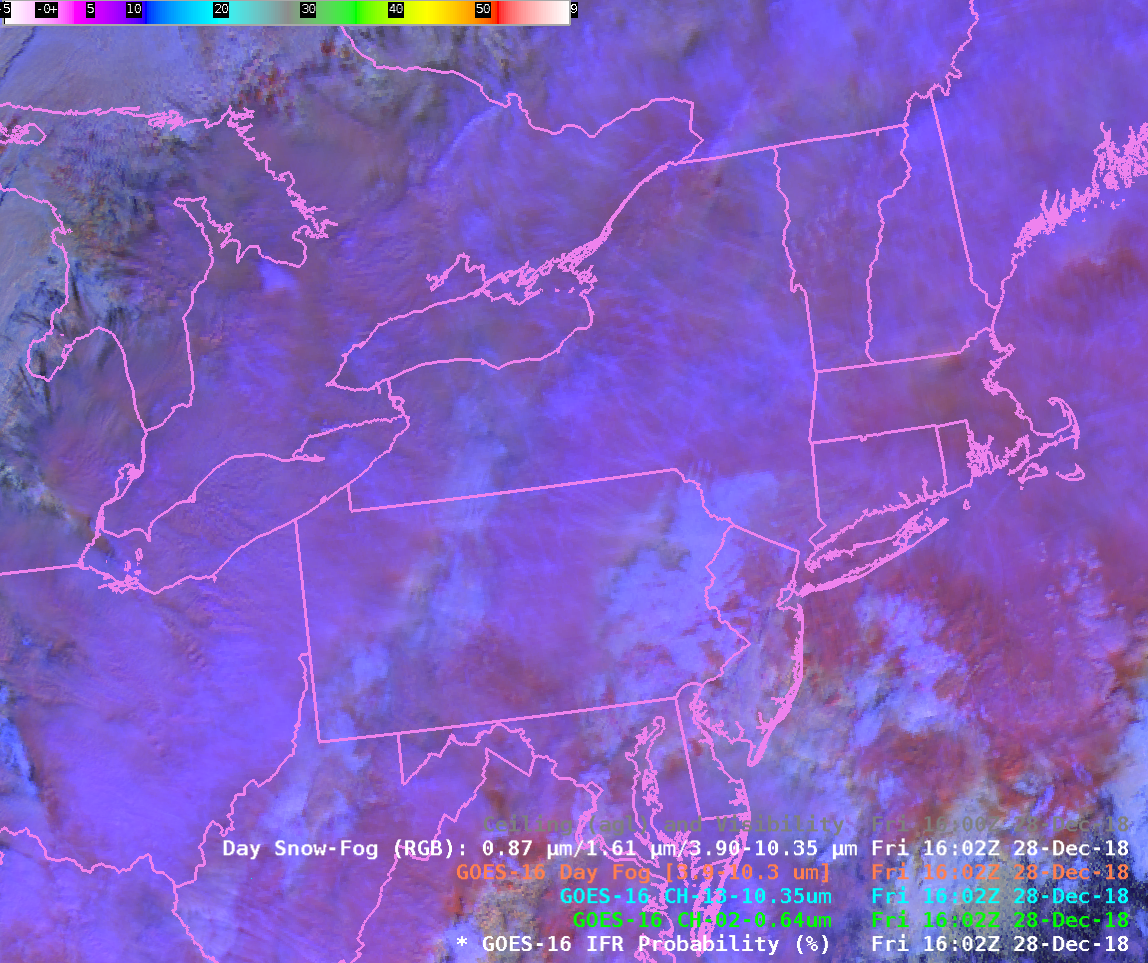
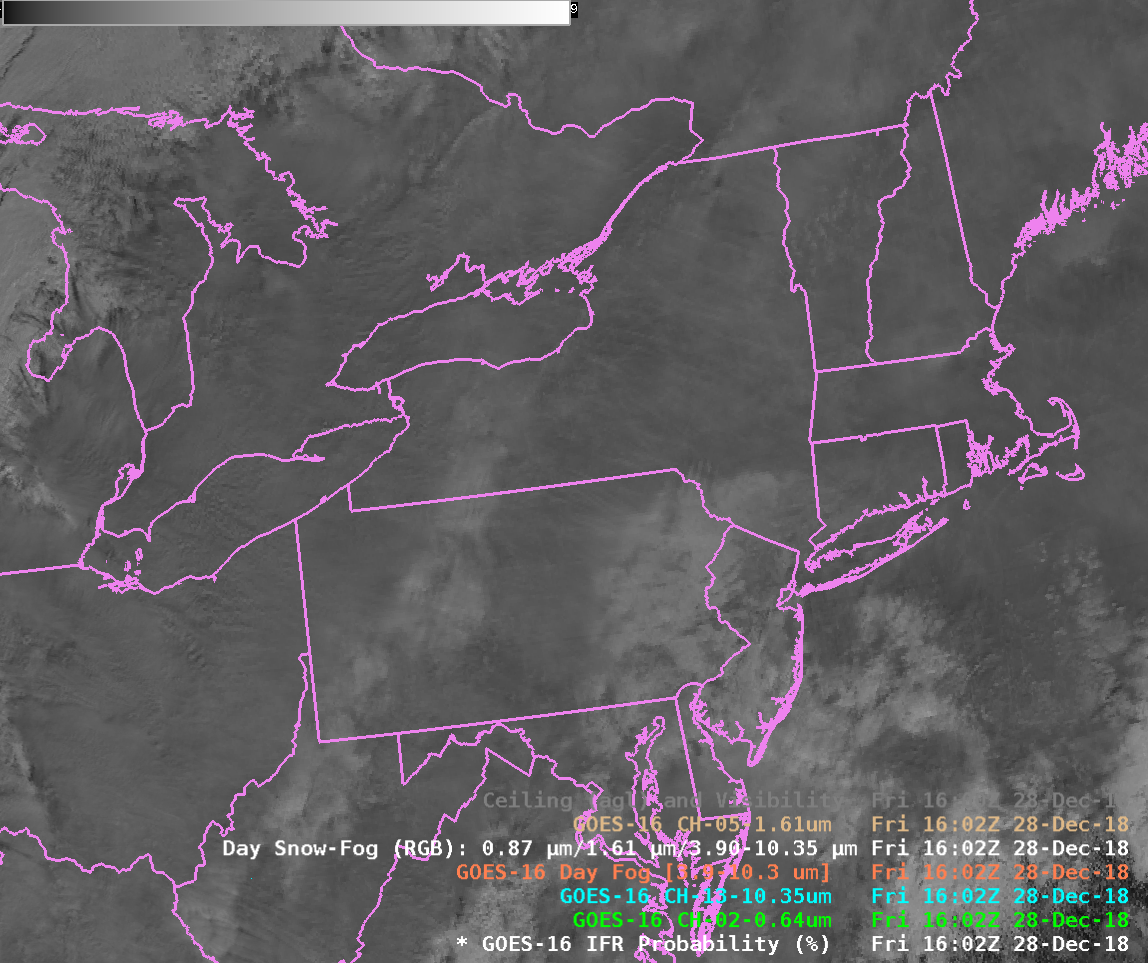
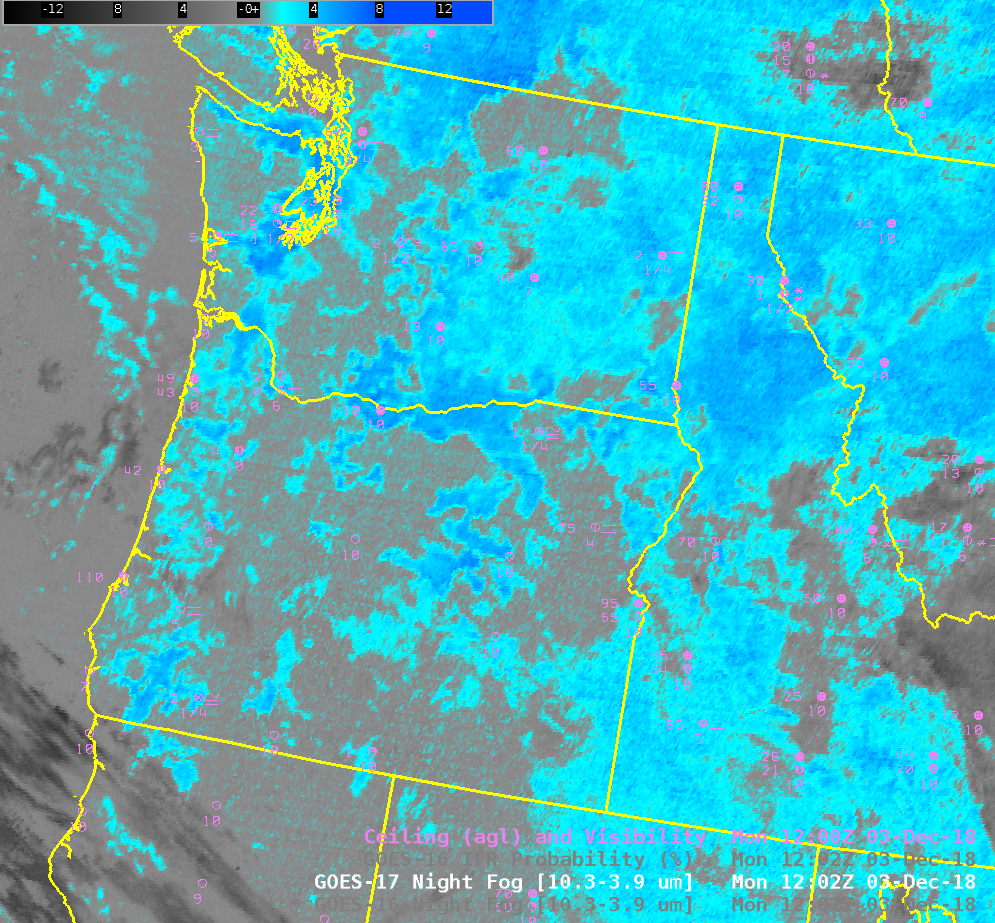
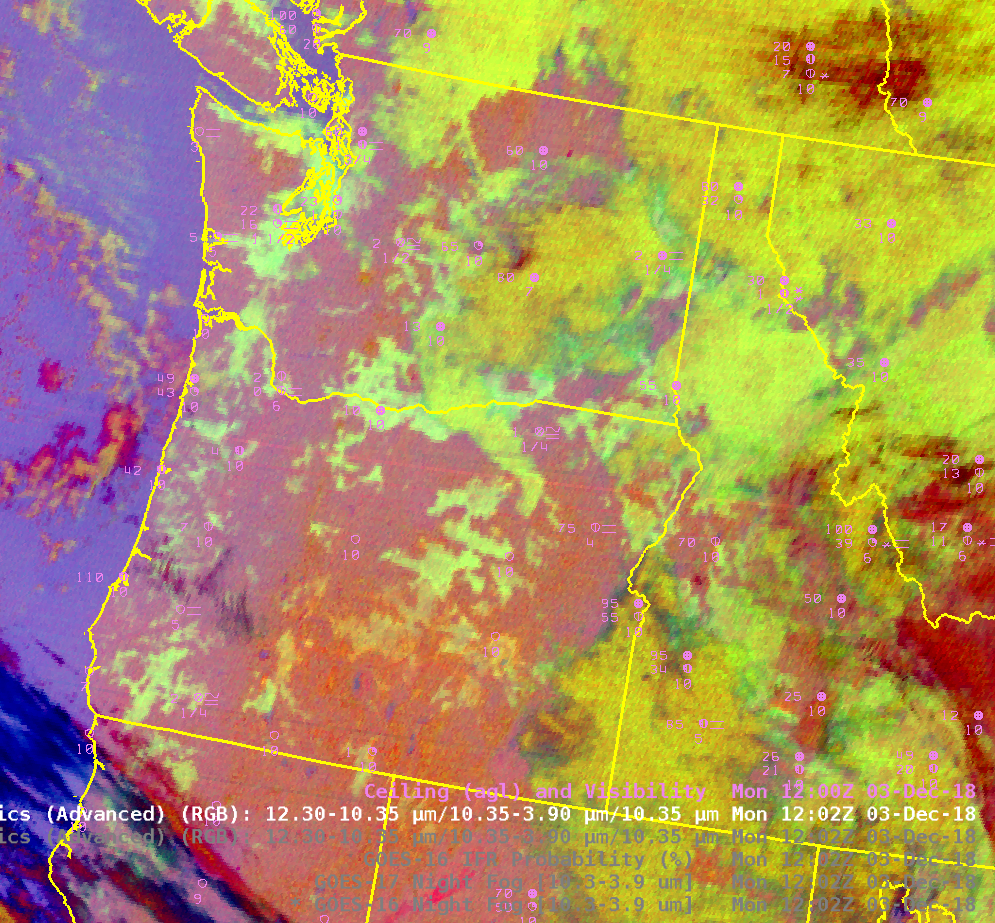
GOES-16 ABI Band 02 (0.64 µm), Band 13 (10.3 µm), Day Fog Brightness Temperature (3.9 µm – 10.3 µm), Day Snow Fog RGB and Band 5 (1.61 µm) at 1602 UTC on 28 December 2018 (Click to enlarge)

The animation above cycles through the GOES-16 Visible Imagery (Band 2, 0.64 µm), Band 13 (Clean Window Infrared, 10.3 µm), the Day Fog Brightness Temperature Difference (3.9 µm – 10.3 µm), the Day Snow Fog Red Green Blue (RGB) Composite and the Snow/Ice near-Infrared channel (Band 5, 1.61 µm) that is the green component of the Day Snow Fog RGB. (That’s very apparent in this toggle between the Day Snow Fog RGB and the 1.61 µm) Do any of these products give you a good idea of where IFR conditions (Low ceilings and reduced visibilities) are occurring?

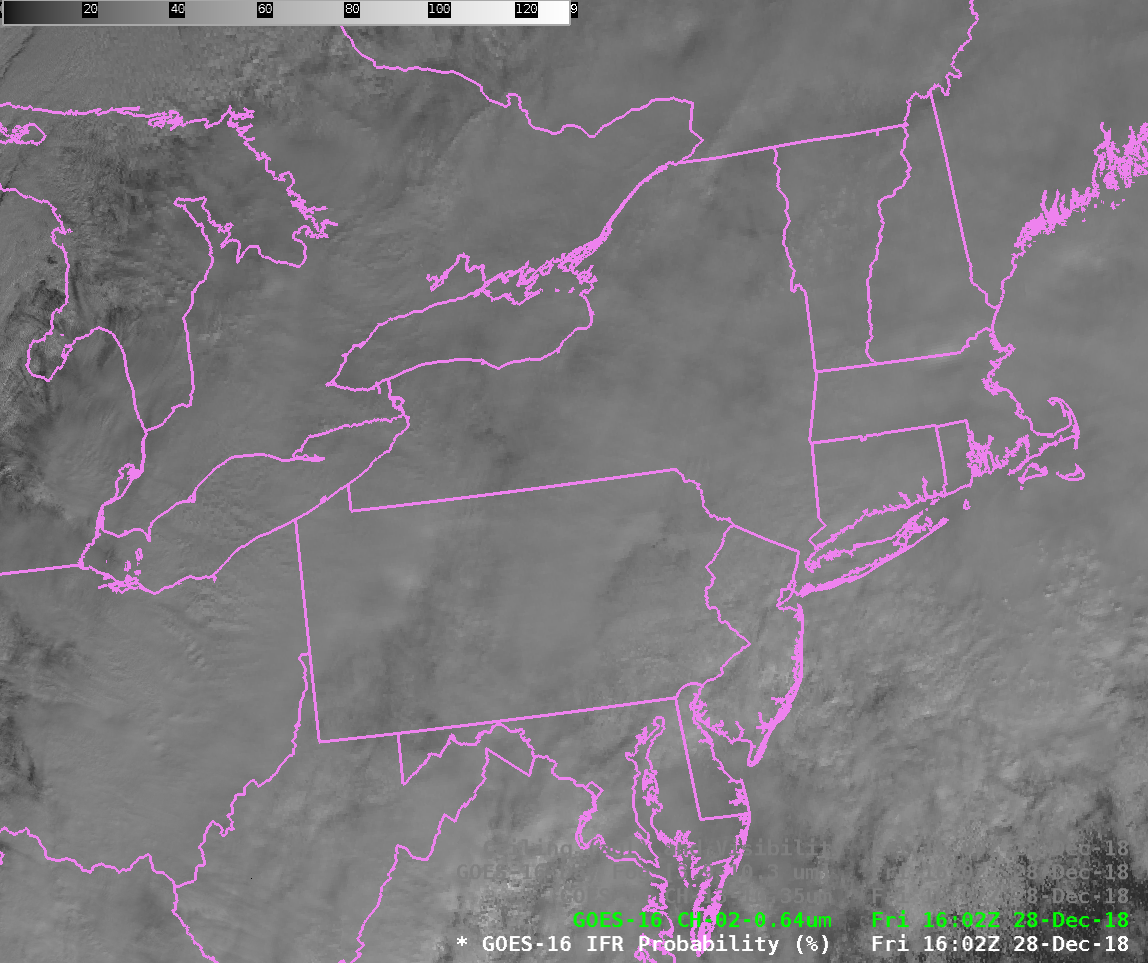
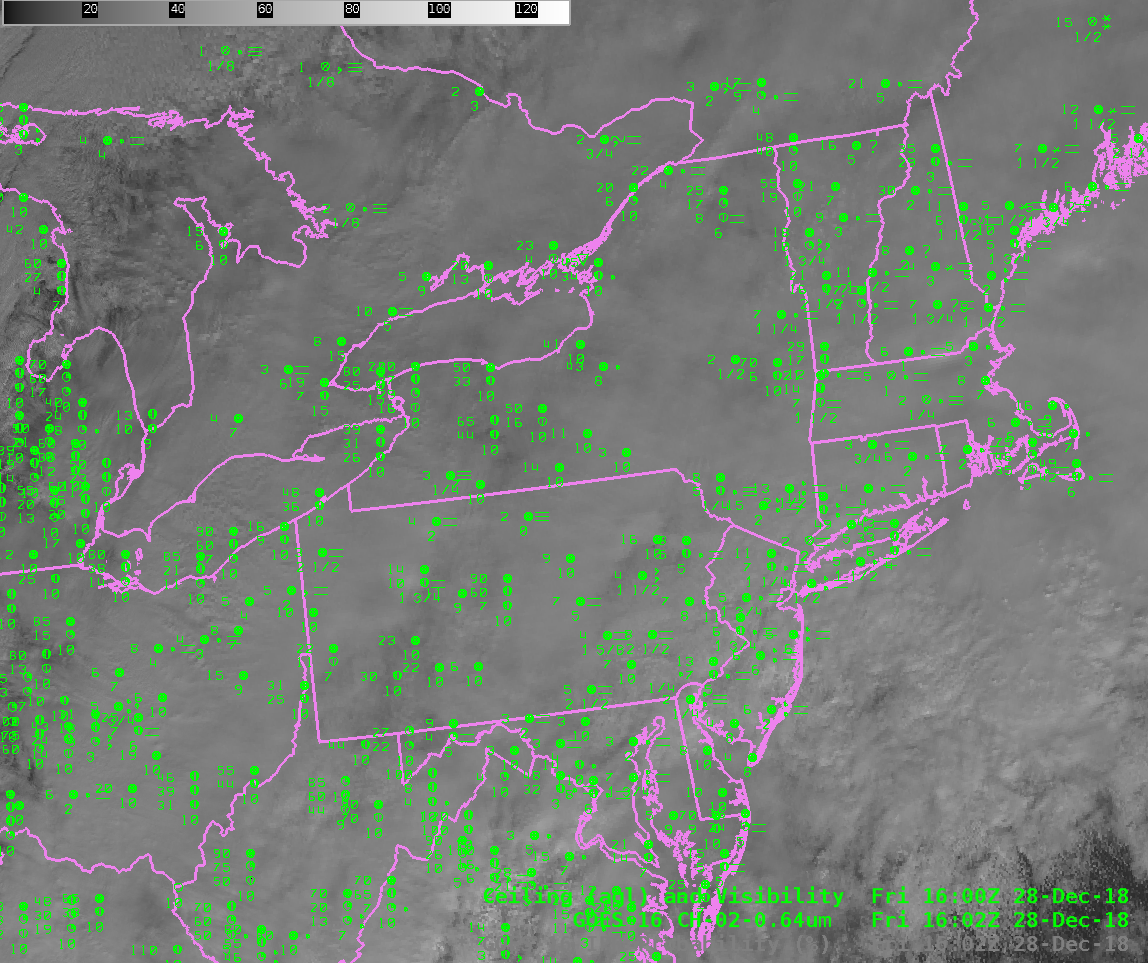
Consider the toggle of visible imagery below, with and without surface observations of ceilings and visibility. It is a difficult prospect to relate the top-of-cloud reflectance (which is what the visible imagery gives you!) to the ceilings beneath the cloud.

GOES-16 ABI Band 02 (0.64 µm) with an without surface observations of ceilings and visibility at 1602 UTC on 28 December 2018 (Click to enlarge)

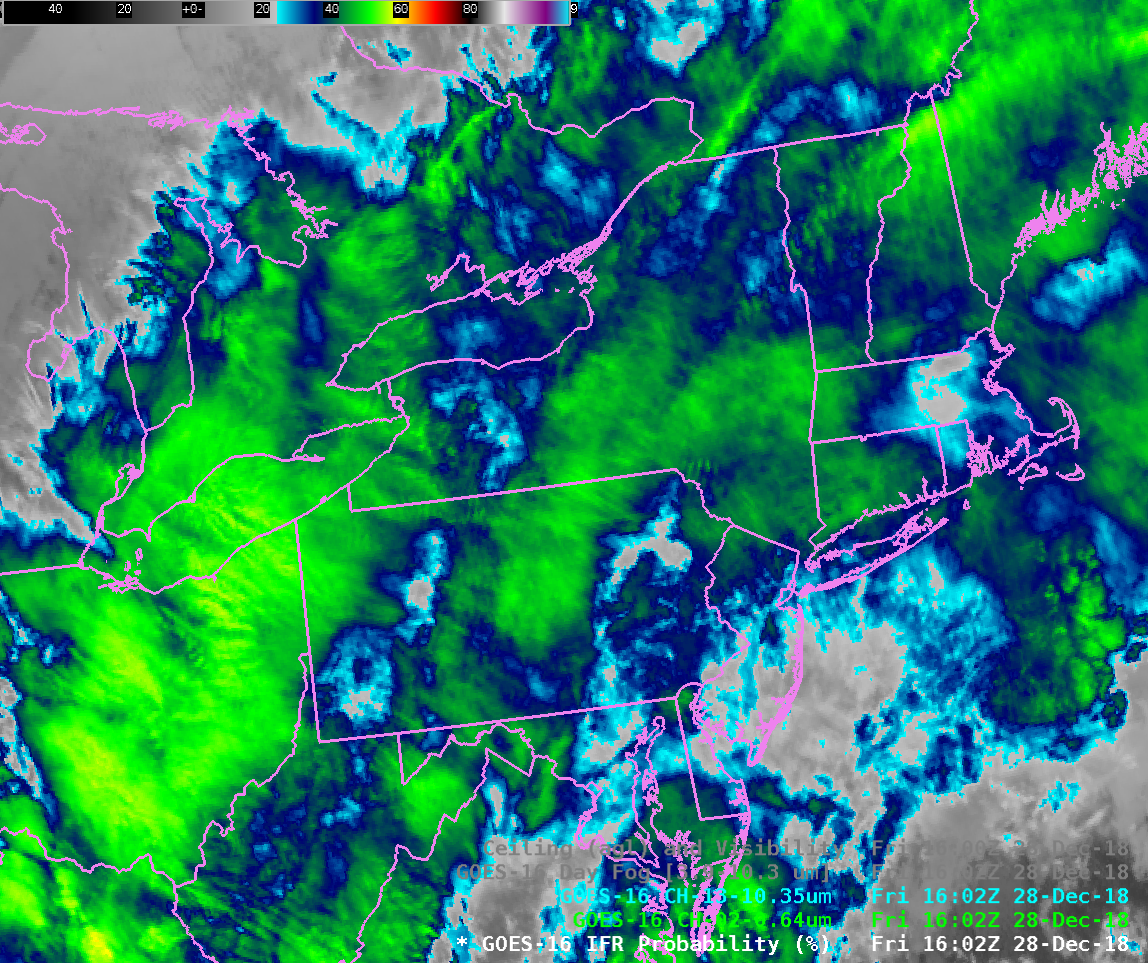
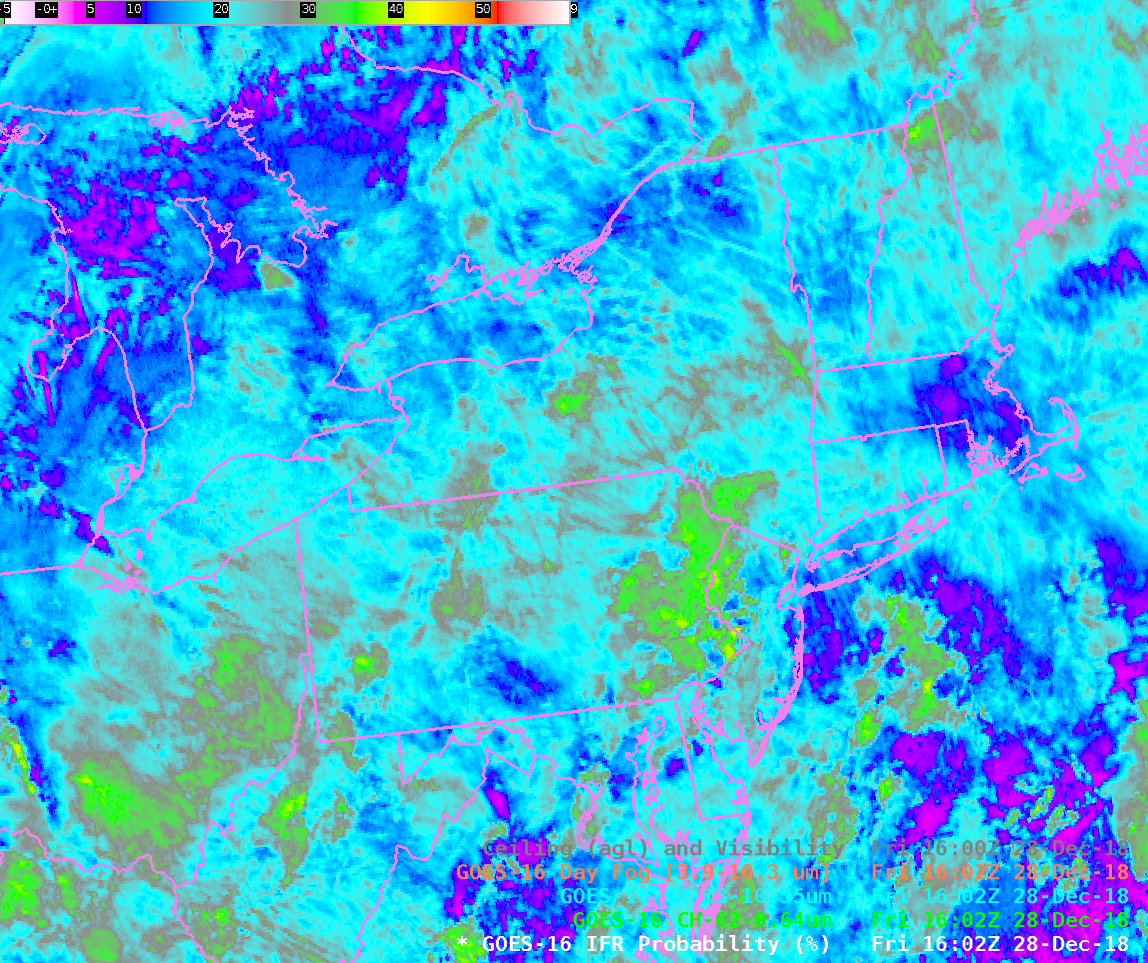
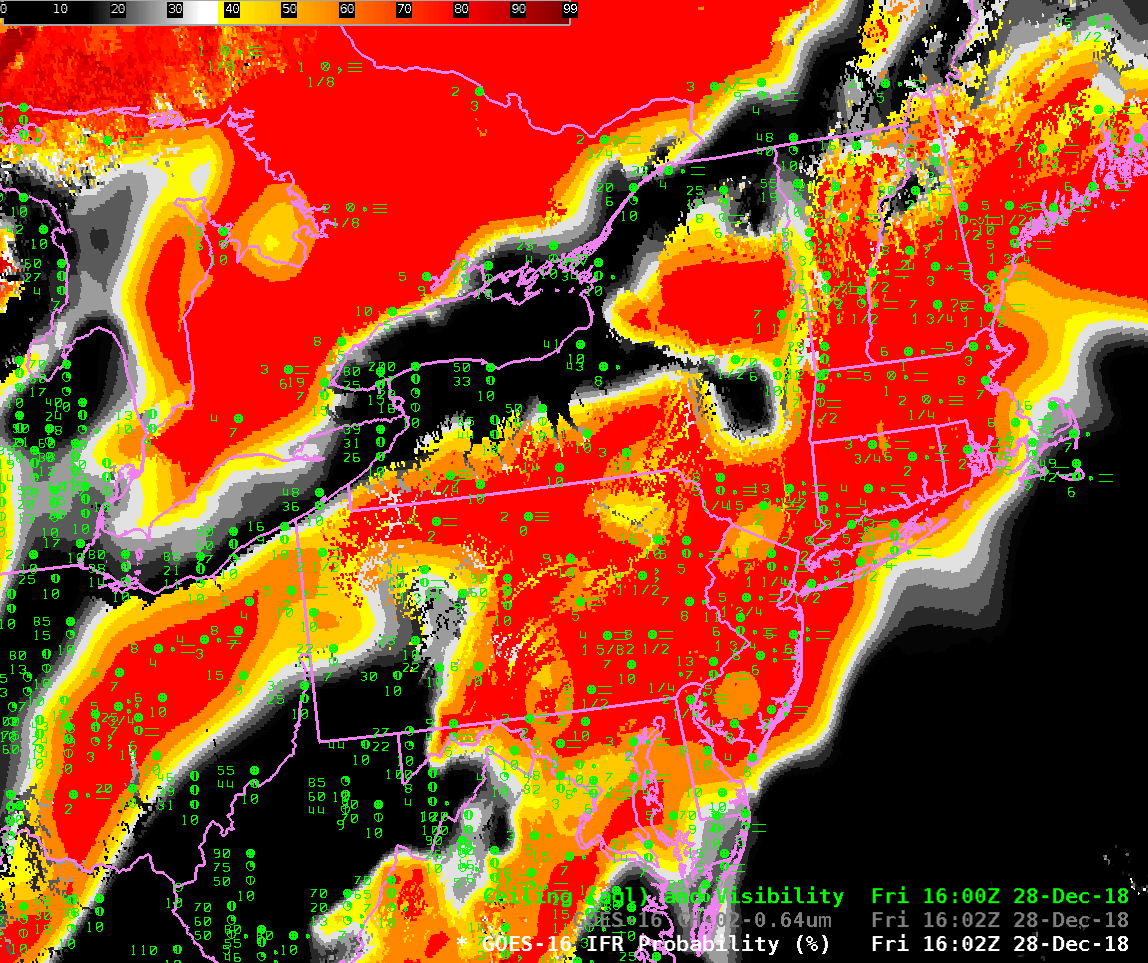
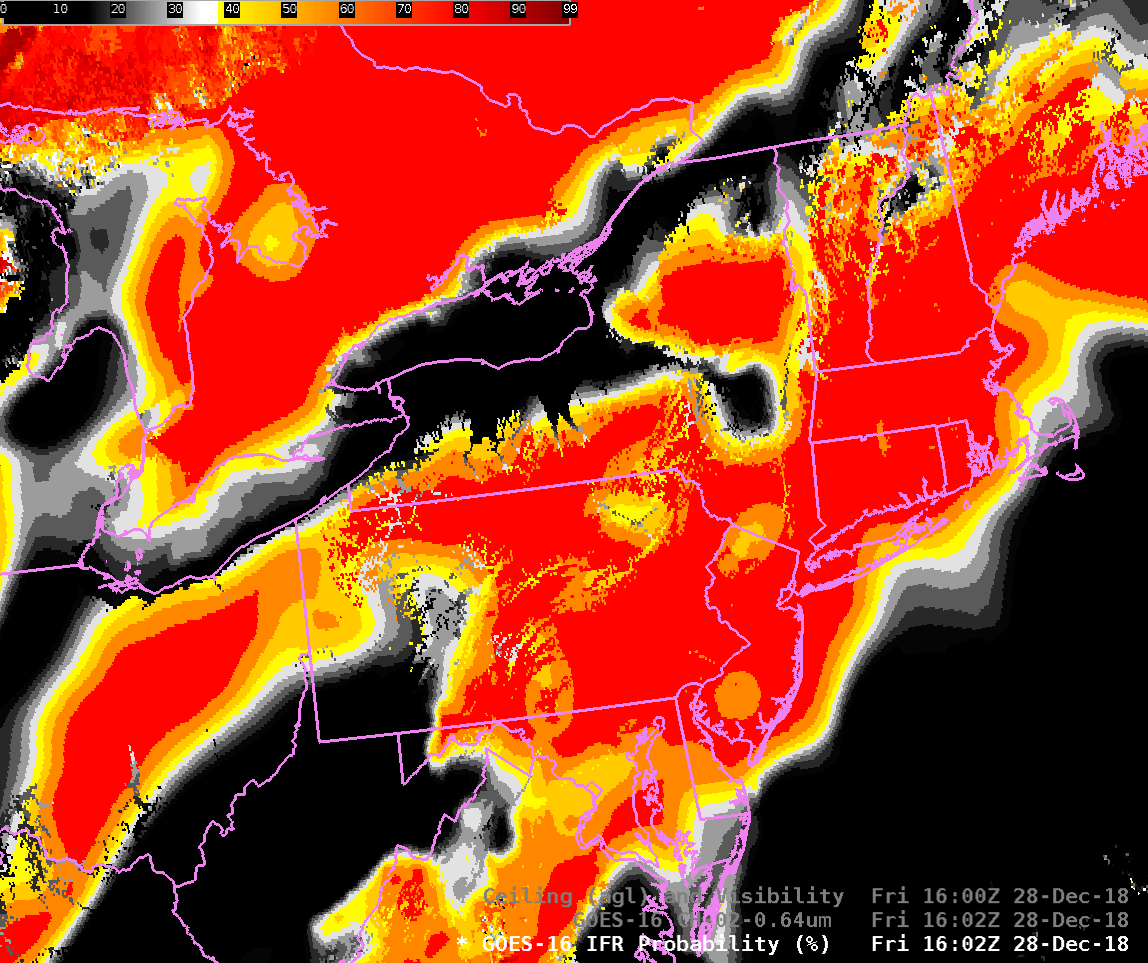
GOES-16 IFR Probability fields blend satellite observations of cloud with Rapid Refresh model data that predicts saturation near the surface. That model data, incorporated into a statistical prediction of IFR conditions, allows the field to outline the regions where low ceilings and reduced visibilities occur, as shown in the toggle below with and without observations. (Click here to see the Visible and IFR Probability fields toggled). The inclusion of near-surface saturation values extracted from the Rapid Refresh model allows the IFR Probability field to discriminate between low ceilings/fog — as over central Pennsylvania, Massachusetts and central Ohio (among other places) — and mid-level stratus — as over southwestern Pennsyvlania and surrounding Lakes Erie and Ontario (among other places).

GOES-16 IFR Probability with surface observations of ceilings/visibilities at 1602 UTC on 28 December 2018 (Click to enlarge)

Fog over the Pacific Northwest: Where is it?

GOES-17 imagery in this blog post is made from GOES-17 Data that are preliminary and non-operational!

Night Time Fog Brightness Temperature Difference (10.3 µm – 3.9 µm) from GOES-16 and (preliminary, non-operational) GOES-17, 1202 UTC on 3 December 2018 (Click to enlarge)

The toggle above shows GOES-16 and GOES-17 Night Fog Brightness Temperature difference fields over the Pacific Northwest shortly after 1200 UTC on 3 December 2018.  The Pacific NW is a lot farther from the sub-satellite point (nadir) of GOES-16 (75.2 West Longitude) than from the sub-satellite point (nadir) of GOES-17 (at 137.2 W Longitude).  Thus, the GOES-16 view is has inferior spatial resolution.  There are also different parallax shifts for clouds between the two views.  The scene includes plenty of stratus, based on the observations, and isolated pockets of IFR conditions:  Spokane WA, Stampede Pass, WA, Pendleton OR, Medford OR, Salem OR.  It’s difficult to tell at a glance from the Brightness Temperature Difference field where the lowest ceilings and poorest visibilities are — because the satellite sees the top of the cloud, and it’s difficult to infer cloud base properties from infrared imagery of the cloud top.

The Advanced Nighttime Microphysics RGB can also be used to detect low ceilings, because its green component is the Night Fog Brightness Temperature Difference as shown above.  The toggle below compares the GOES-16 and GOES-17 RGBs.  Again, it is difficult to pinpoint at a glance where the IFR conditions are occurring in this product.

There are subtle differences in the colors of the RGB from the two satellites.  These are related to the distance from the sub-satellite point.  Limb cooling will cause the brightness temperatures from the GOES-16 Clean Window to be slightly cooler than the GOES-17 values, and that will affect the color:  The Clean Window is the Blue component of the RGB.  In addition, the Split Window Difference values will be slightly different because of the different amounts of limb cooling in 12.3 µm and 10.3 µm brightness temperatures.  GOES-17 data also includes striping that is being addressed with ongoing calibration work with the satellite.

Advanced Nighttime Microphysics RGB from GOES-16 and GOES-17 at 1202 UTC on 3 December 2018 (Click to enlarge)

The toggle below shows, (from GOES-16 data) the 10.3 µm – 3.9 µm Brightness Temperature Difference, the Nighttime Microphysics RGB, and the IFR Probability fields at 1202 UTC. IFR Probability fields include information about low-level saturation from the Rapid Refresh model, and that information allows the product to screen out regions of mid-level stratus; thus, the region of IFR conditions is better captured.  There are three main regions:  eastern WA southwestward to Pendleton OR, Seattle southward into Oregon, and the peaks of central Washington.

GOES-16 Night Fog Brightness Temperature Difference (10.3 µm – 3.9 µm), Nighttime Microphysics RGB and IFR Probability, 1202 UTC on 3 December 2018 (Click to enlarge)