Monthly Archives: May 2018

Fog over Kansas

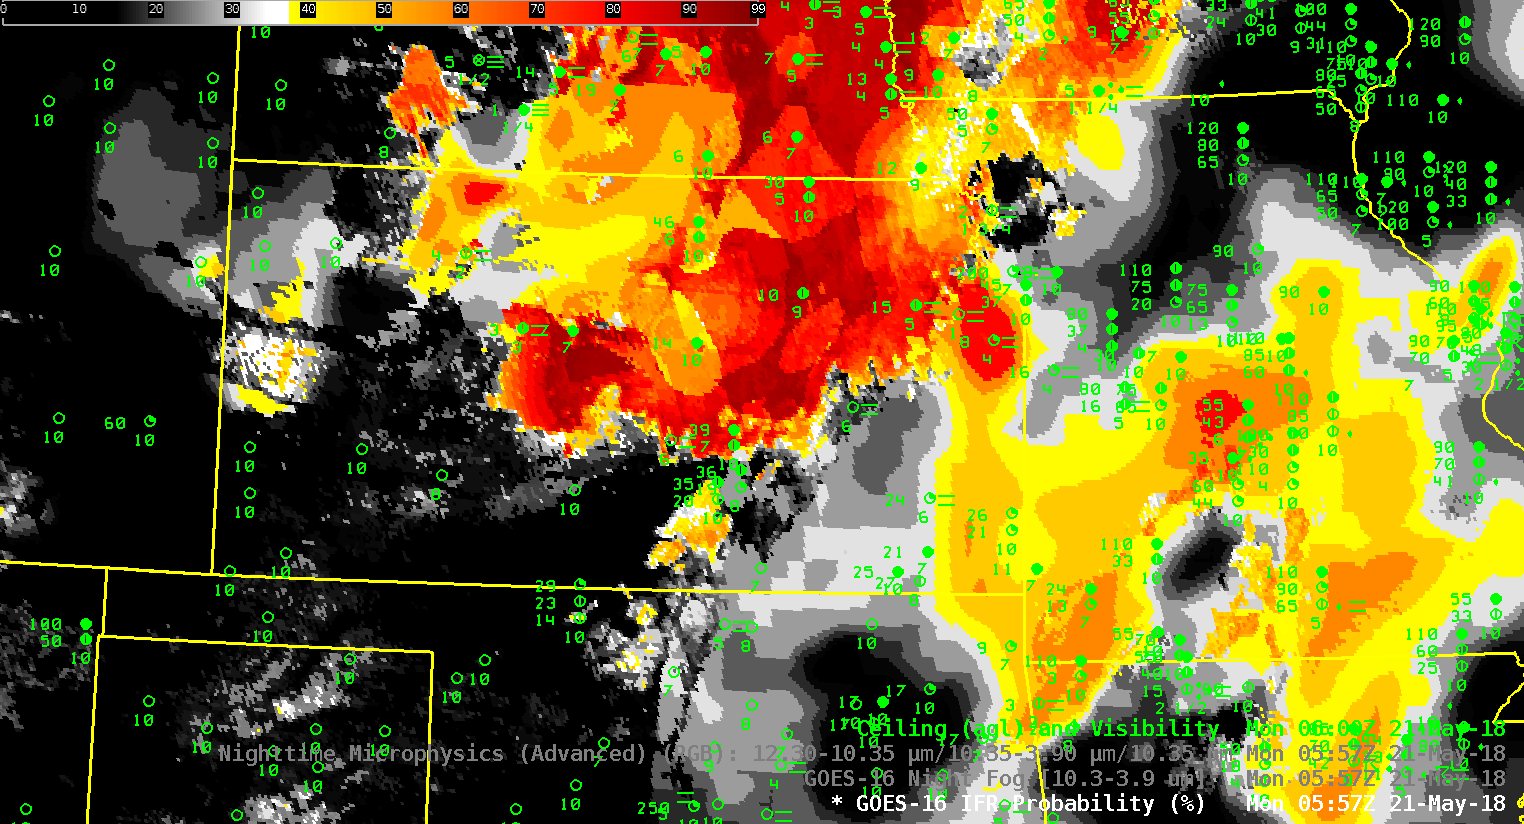
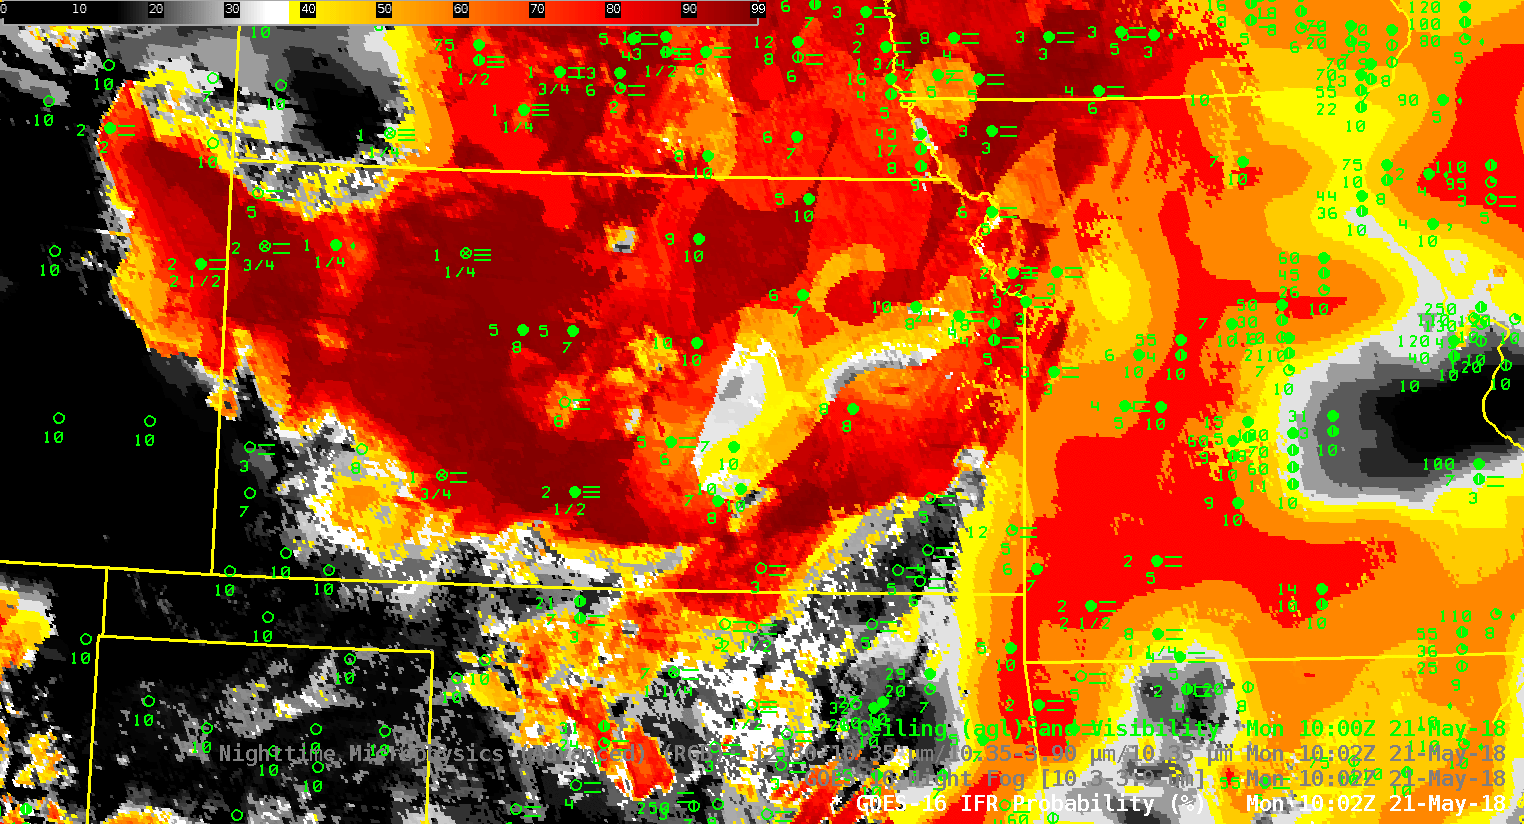
GOES-16 IFR Probability fields, 0557 – 1157 UTC on 21 May 2018 (Click to animate)

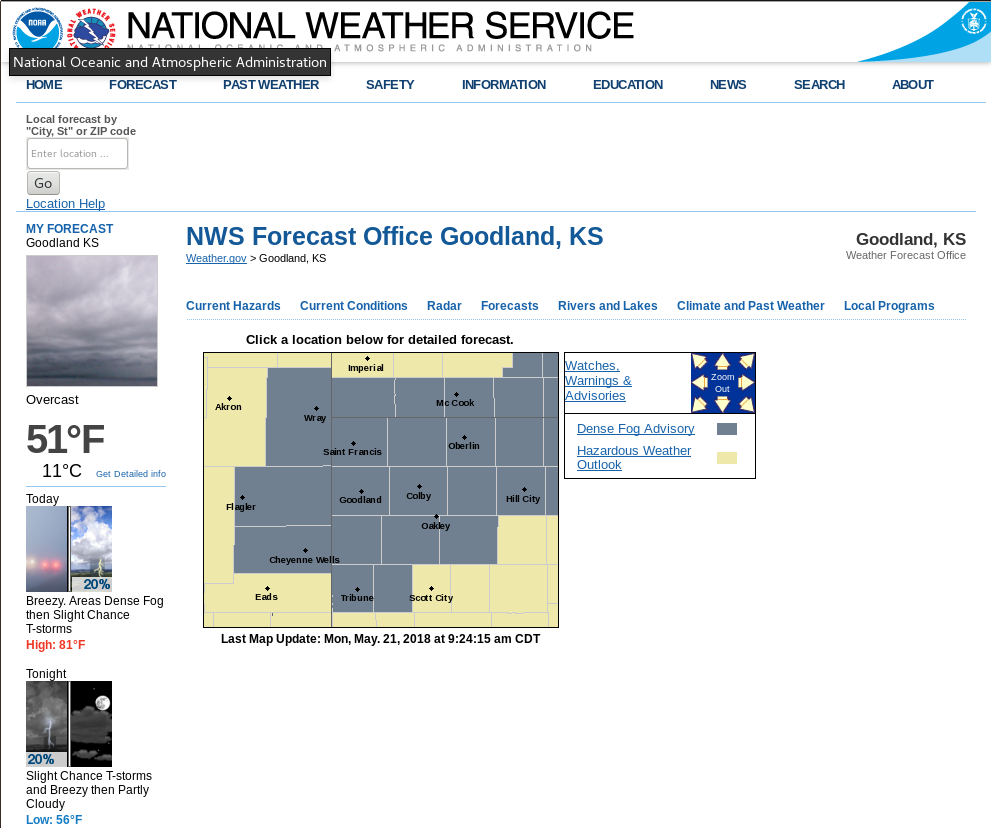
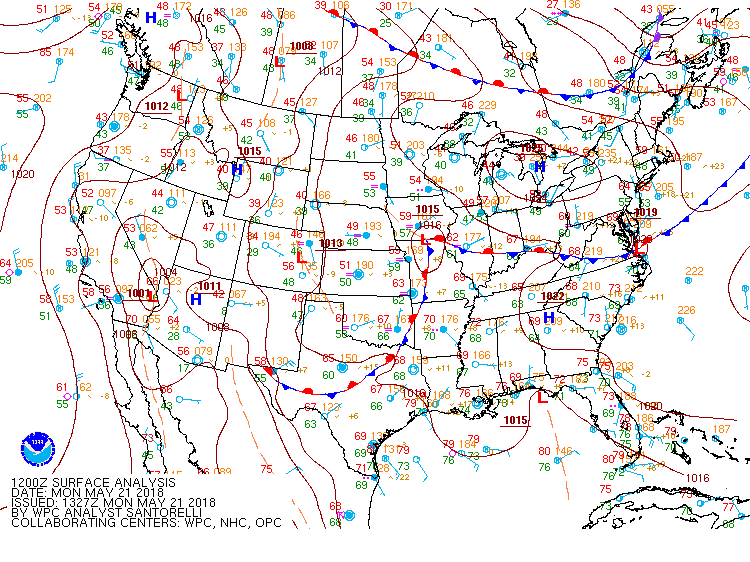
Dense Fog Advisories were issued over Kansas by the Goodland KS Forecast Office on Monday 21 May 2018. The IFR Probability field, above, computed using GOES-16 and Rapid Refresh Model output shows the development of fog as it developed westward across Kansas. (Surface winds in the region were light (source); Plot 2 (from here)).

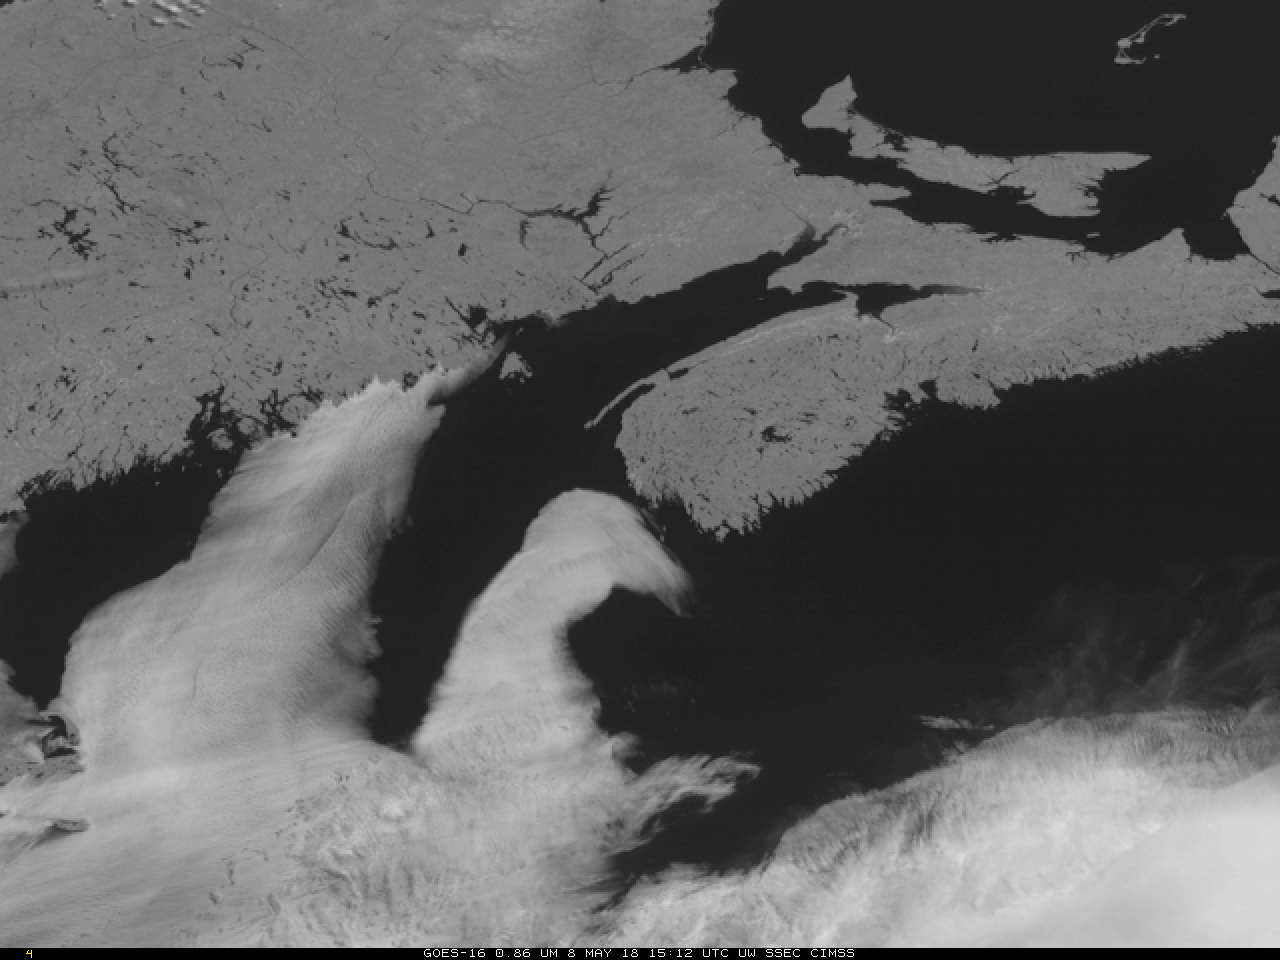
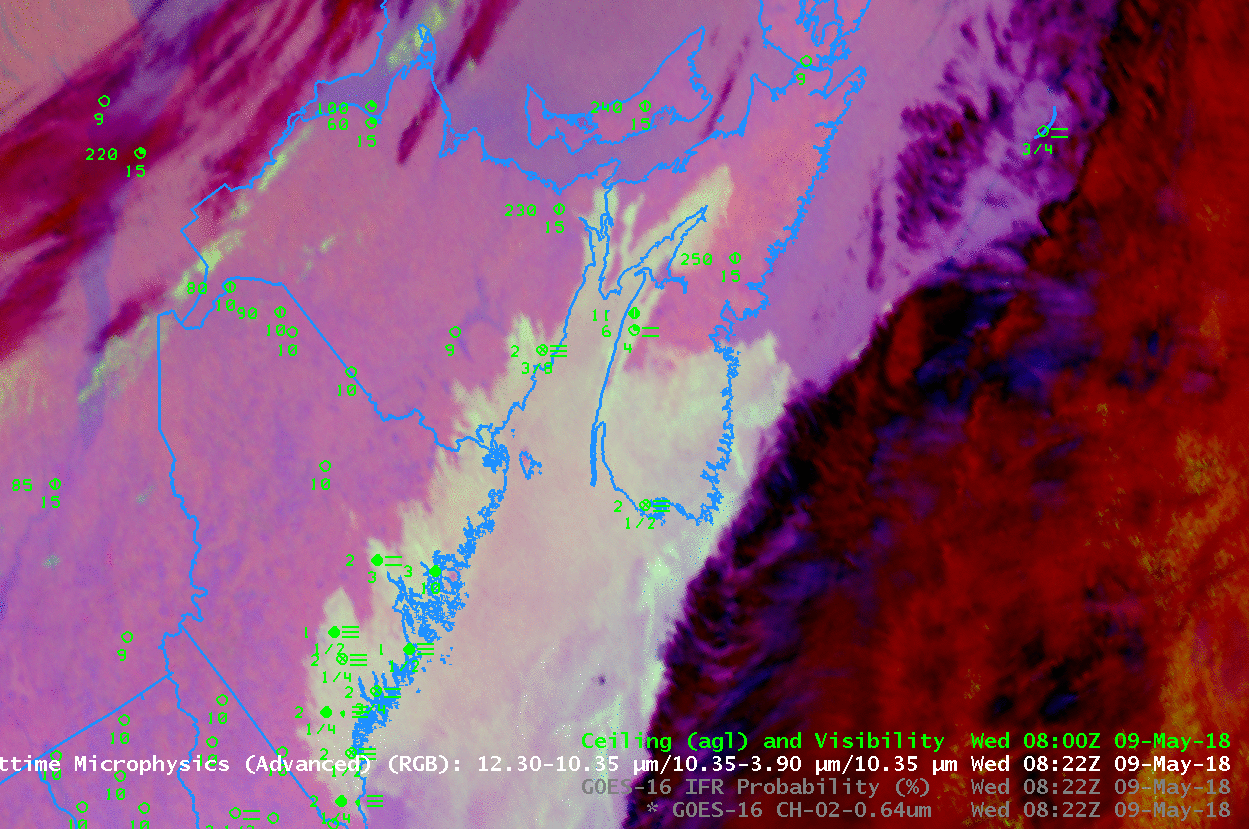
High clouds around Kansas impeded the detection of low stratus/fog from satellite in some regions.  Those regions benefit from the fused data methods of IFR Probability:  where satellite data alone cannot be used, model data can give important information.  Consider the ‘Night Fog’ Brightness Temperature Difference field, below (10.3 µm – 3.9 µm) for the same period as shown above.  High clouds are apparent over southeast Kansas and Missouri, and also occasionally over Nebraska.  High clouds over McCook, Nebraska, just north of the Kansas-Nebraska state line in southwest Nebraska, prevent the satellite detection of fog even as the ceilings and visibilities decrease. (Here is a toggle of the three products at 1002 UTC).

Similarly, IFR or near IFR conditions develop over southwestern Missouri, but a cirrus shield there means that Brightness Temperature Difference (10.3 µm – 3.9 µm) fields, and the Nighttime Microphysics RGB (that relies on the Brightness Temperature Difference field) cannot observe the low clouds.

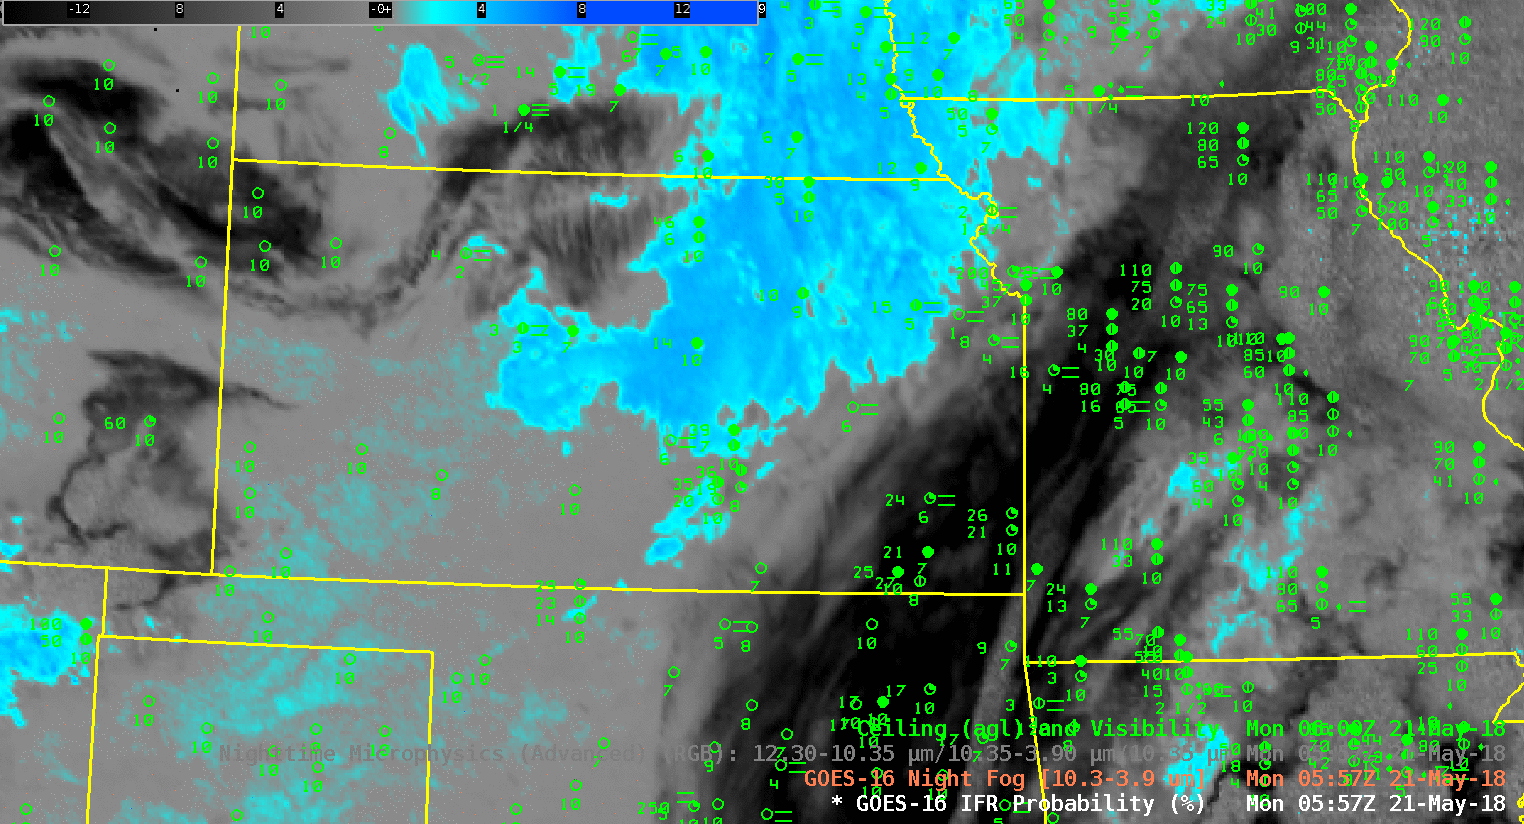
GOES-16 ‘Night Fog’ Brightness Temperature Difference (10.3 µm – 3.9 µm), 0557 – 1157 UTC on 21 May 2018 (Click to animate)

GOES-16 Nighttime Microphysics RGB, 0557 – 1157 UTC on 21 May 2018 (Click to animate)

When you use a product to ascertain the presence of fog/low stratus, be certain that you understand its limitations.

Fog in the Canadian Maritimes

GOES-16 ABI Band 2 (0.64 µm) from 0902-1312 UTC on 9 May 2018 (Click to enlarge)

GOES-16 Visible Imagery on the morning of 9 May 2018 shows the steady erosion of fog in/around the Bay of Fundy, and along coastal Maine.  The default 5-minute temporal cadence with the CONUS GOES-16 sector allows for a precise observation for when coastal fog will clear.

The satellite view of the fog in the bay was unobstructed by high clouds.  (except to the east of Nova Scotia, where a cirrus shield is apparent in the visible animation above, and in animation below)    Thus, the GOES-16 Night Fog Brightness Temperature Difference field (10.3 µm- 3.9 µm), below, could ably capture the fog’s presence and evolution.  The animation of that product, below, shows how the signal changes at sunrise as reflected solar 3.9 µm radiation overwhelms the brightness temperature difference (driven at night by differences in emissivity at 3.9 and 10.3 µm from cloud droplets): the sign flips.  Because the fog was captured in the Night Fog Brightness Temperature Difference, it was also present in the Nighttime Microsphysics RGB Composite (here), although the color associated with fog  changes as the sun rises, and clear skies also allowed the Day Snow Fog RGB Product to show the fog during the day (here).

None of the Satellite-based products can provide information on the likelihood of fog over the ocean to the east of Nova Scotia, however, because the presence of cirrus clouds there prevents the satellite from viewing low clouds.  What products can help with that?

GOES-16 ABI Night Fog Brightness Temperature Difference (10.3 µm – 3.9 µm) from 0817-1312 UTC on 9 May 2018 (Click to enlarge)

GOES-16 IFR Probability fields, below, combine together satellite and model information to determine where IFR Conditions are most likely.  Very high probabilities exist where other satellite fog detection products suggest the presence of fog/low stratus (and where surface observations confirm the presence of fog).  But there are also high probabilities over the ocean east of Nova Scotia where satellite-only fog detection fails because of the presence of high clouds;  this large signal is derived from Rapid Refresh data there that suggests low-level saturation. IFR Probability combines the strengths of both satellite data and model output to provide useful information to a forecaster.

GOES-16 IFR Probability (10.3 µm – 3.9 µm) from 0817-1322 UTC on 9 May 2018

(Thanks to Paul Ford, ECC Canada, for alerting us to this event)

Added: The GOES-16 ABI Band 3 (0.86 µm) “Veggie” Band, which has great land/sea contrast, shows the fog encroaching into the Bay of Fundy during the day on 8 May. Note in particular how the low clouds race up the west coast of Nova Scotia near sunset.

GOES-16 ABI Band 3 (0.86 µm) from 1512-2257 UTC on 8 May 2018 (Click to enlarge)