Monthly Archives: July 2017

Resolution: GOES-R IFR Probability Fields and GOES-16 Data

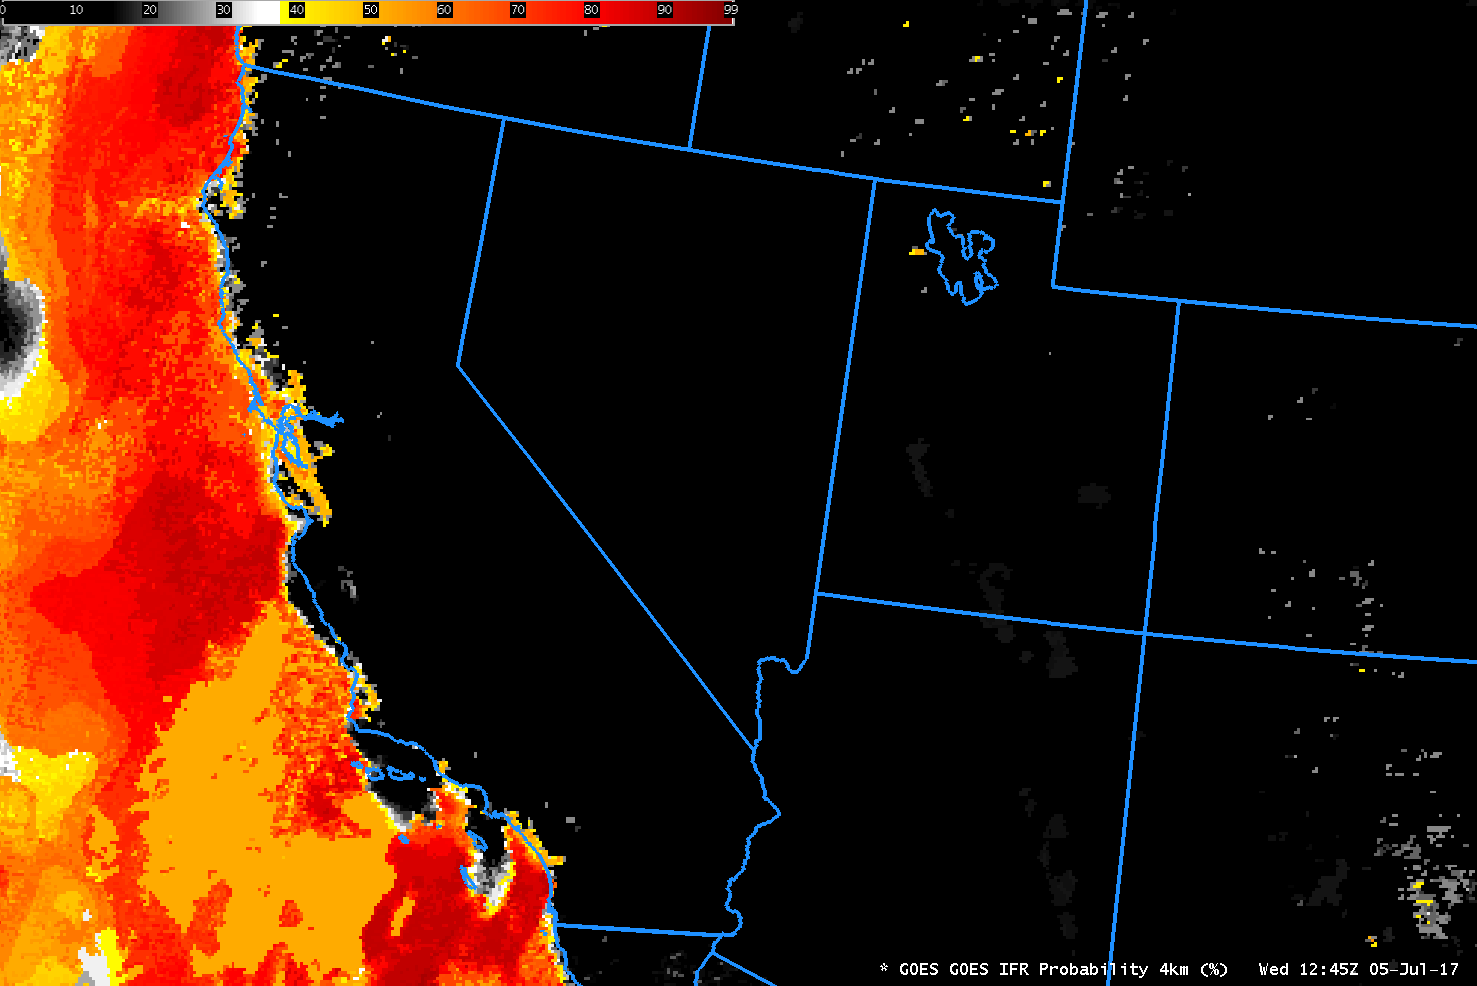
GOES-R IFR Probabilities computed with GOES-13 and Rapid Refresh Data, Hourly from 0215-1115 UTC on 31 July 2017 (Click to enlarge)

GOES-R IFR Probabilities are computed using Legacy GOES (GOES-13 and GOES-15) and Rapid Refresh model information; GOES-16 data will be incorporated into the IFR Probability algorithm in late 2017

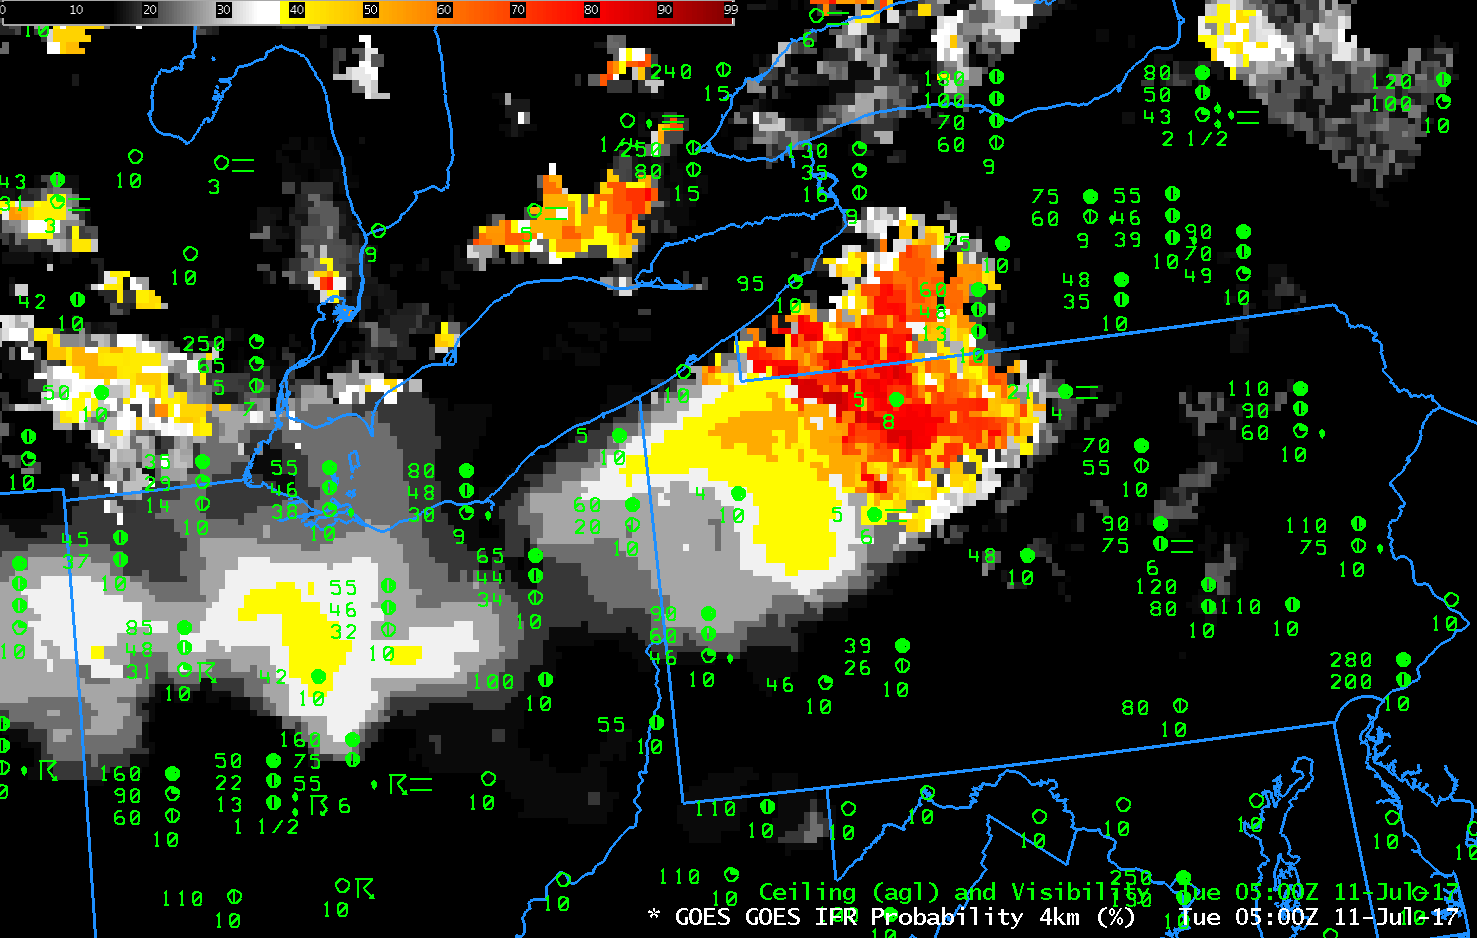
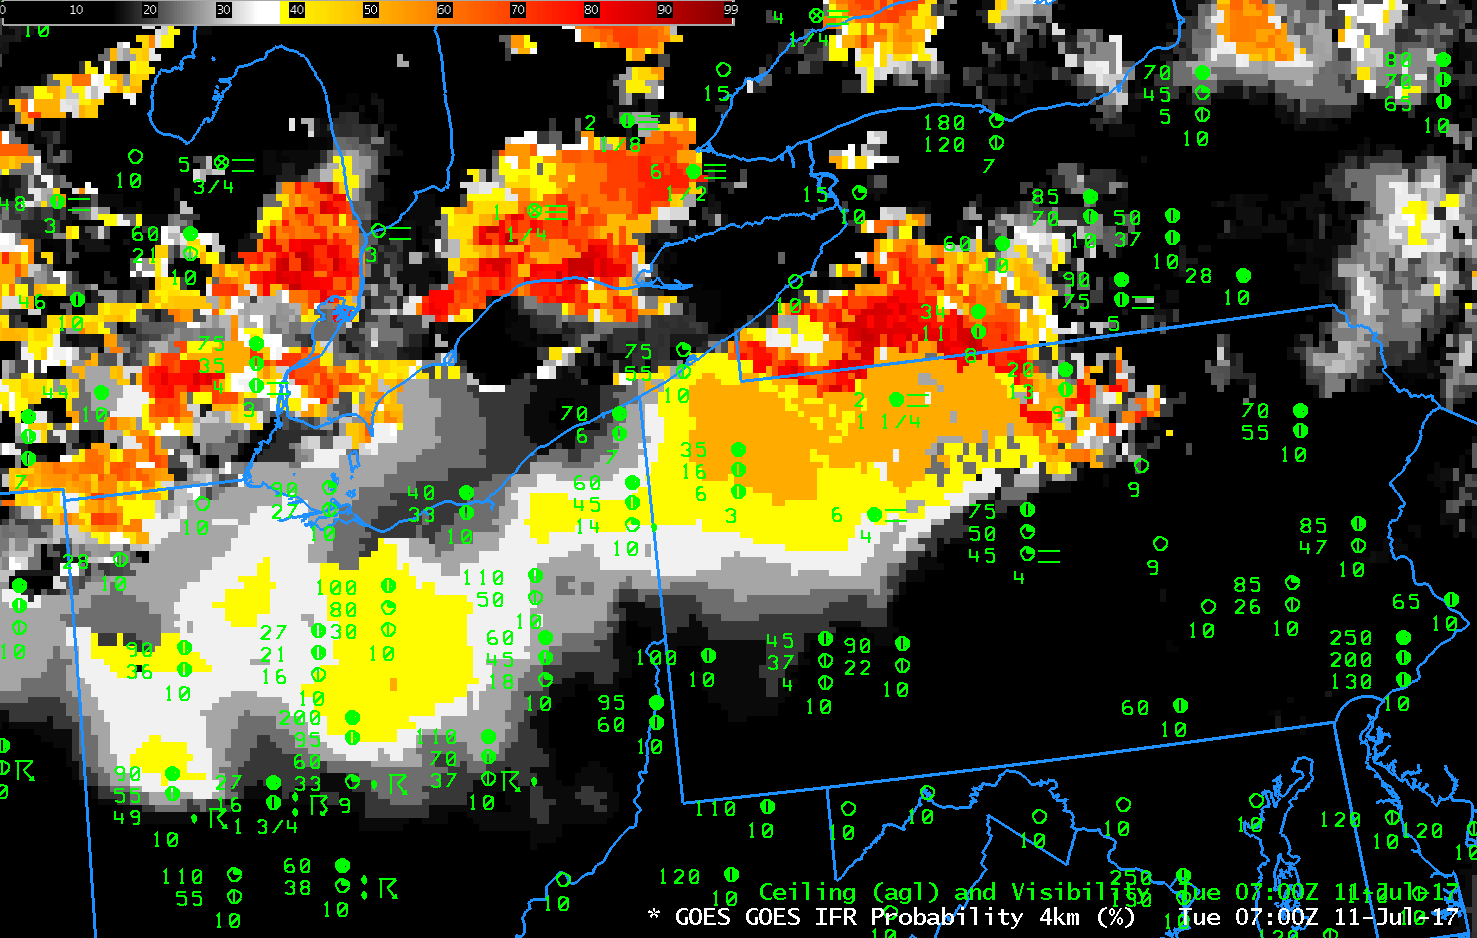
The animation above shows the evolution of GOES-R IFR Probability fields over West Virginia early on 31 July 2017, when IFR and Low IFR Conditions developed over much of the state. In addition to elevated probabilities over West Virginia, probabilities increased over eastern Virginia as well, where IFR conditions were not reported. The IFR probabilities over eastern Virginia diminished rapidly at sunrise, as indicated at the end of the animation.

Much of the fog on 31 July 2017 over West Virginia was valley fog. Legacy GOES (GOES-13 and GOES-15) has nominal 4-km resolution at the sub-satellite point, and this resolution can be insufficient to resolve the narrow valleys of the Appalachian Mountains.

GOES-16 data posted on this page are preliminary, non-operational and are undergoing testing

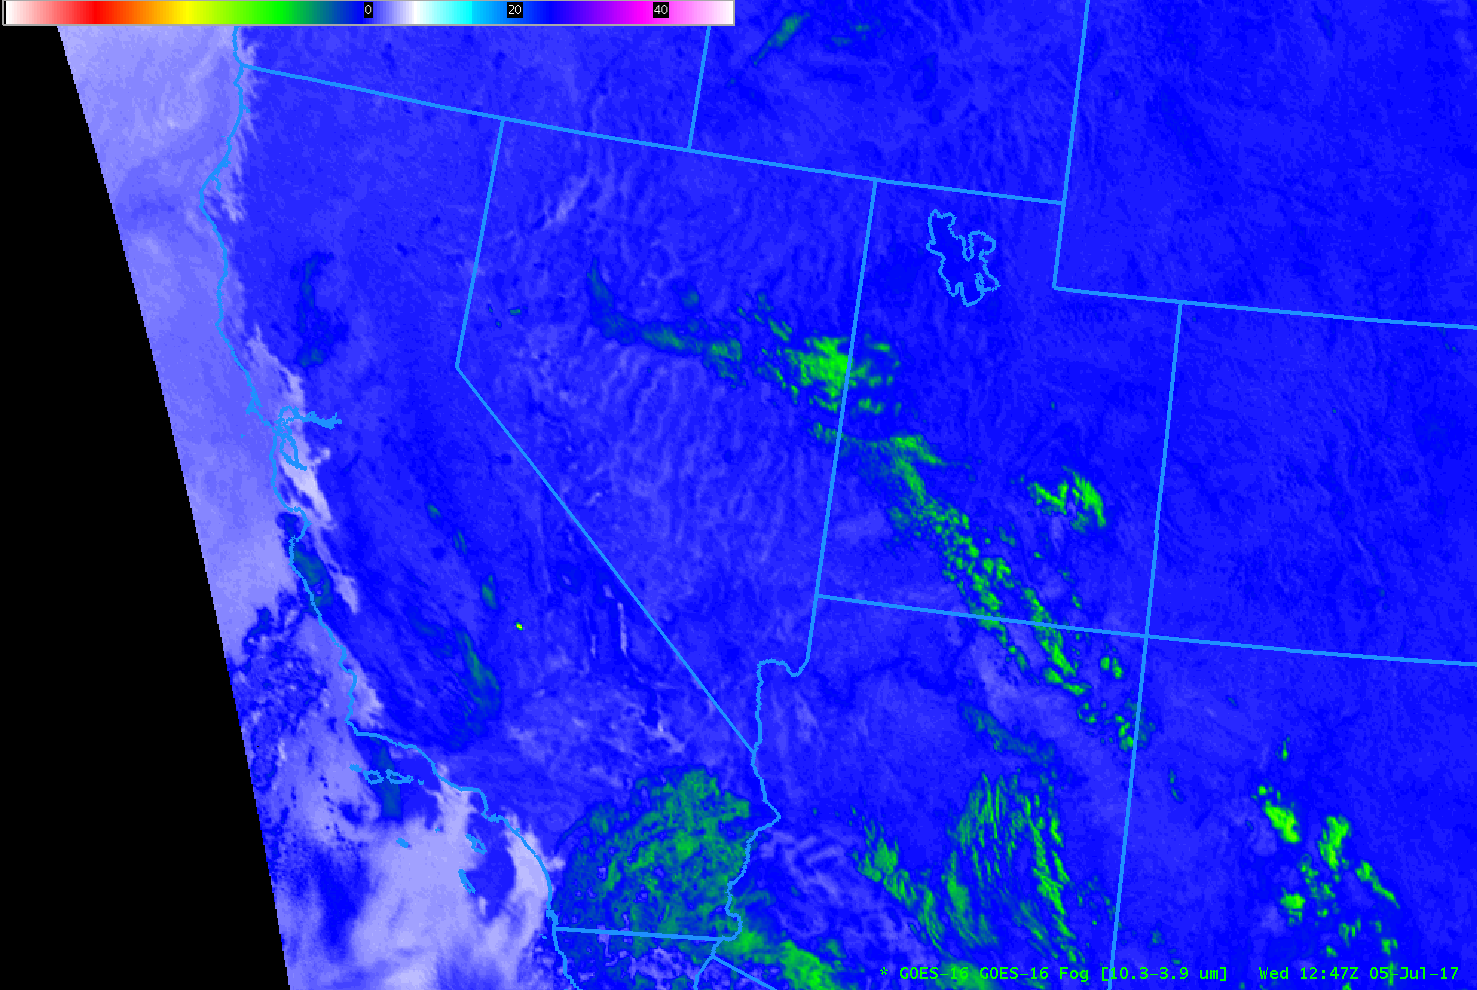
The GOES-16 Animation below shows the 10.3 µm – 3.9 µm Brightness Temperature Difference field for approximately the same time as above. The superior spatial resolution of GOES-16 is evident: tendrils of low clouds/fog are apparent in the animation that until sunrise highlights in green the clouds composed of water droplets (such as fog and stratus). A similar animation of the Nighttime Microphysics RGB Composite (here) similarly highlights stratus (as a whitish color) in the narrow river valleys.

GOES-16 Brightness Temperature Difference Fields (10.3 µm – 3.9 µm), hourly from 0312 – 1112 UTC on 31 July 2017 (Click to enlarge)

This Toggle between the GOES-R IFR Probability and the GOES-16 Brightness Temperature Difference field at 1015 UTC suggests how the IFR Probability Fields will better handle small valley fogs when GOES-16 data are used in the algorithm.

Why Fused Data is better than Satellite Data alone in detecting IFR Conditions: Pennsylvania Example

GOES-R IFR Probability Fields, 0200-1100 UTC on 11 July 2017 (Click to enlarge)

GOES-16 data posted on this page are (still!) preliminary, non-operational data and are undergoing testing

GOES-R IFR Probabilities are computed using Legacy GOES (GOES-13 and GOES-15) and Rapid Refresh model information; GOES-16 data will be incorporated into the IFR Probability algorithm in late 2017

Low ceilings and reduced visibilities developed in and around thunderstorms from Ohio and Michigan into southwestern Ontario, upstate New York and northern Pennsylvania during the morning of 11 July 2017. (Reduced visibilities/lowered ceilings persisted past 15 UTC as shown in this image from here). Regions of IFR conditions over northwestern Pennsylvania are in regions of higher IFR Probability after 0500 UTC (over northwest Pennsylvania) and after 0700 UTC (over much of northern Pennsylvania) that have the characteristic flat field look that comes from having only Rapid Refresh Model output drive the Probability (because high clouds, as might occur downwind of Convection, prevent the satellite from seeing low clouds). GOES-R IFR Probability fields also retain a signal through sunrise, as shown in the this toggle between 1000 UTC and 1100 UTC, two times on either side of the terminator.

Because high clouds inhibit the view of low stratus (and potential fog), products that rely on solely satellite data become ineffectual as a situational awareness tool. Consider the toggle below from 0800 UTC of GOES-R IFR Probabilities, the GOES-16 “Fog Product” Brightness Temperature Difference (10.3 µm – 3.9 µm) and the Advanced Nightime Microphysics RGB (that uses the Brightness Temperature Difference Product as one of its components). IFR Conditions over NW Pennsylvania are not diagnosed by the GOES-16 products that rely on the 10.3 µm – 3.9 µm Brightness Temperature Difference field. Where there is a clear field of view, all three products can highlight IFR conditions (in/around London Ontario, for example). Regions of low stratus — but not fog — are also highlighted over parts of upstate New York by the GOES-16 products. (Similar toggles at 0915 and 1100 UTC are available; note that the signal from GOES-16 becomes weak at 1102 UTC because increasing amounts of solar reflectance change the sign of the 10.3 µm – 3.9 µm Brightness Temperature Difference.

These examples typify why GOES-R IFR Probability fields typically have better statistics as far as IFR detection is concerned: Model data fills in regions where high clouds are present, and model data screens out regions where stratus is highlighted by a Brightness Temperature Difference field, but where fog does not exist.

GOES-R IFR Probabilities (computed using GOES-13 and Rapid Refresh Data), GOES-16 “Fog Product” Brightness Temperature Difference (10.3 µm – 3.9 µm) and the Advanced Nighttime Microphysics RGB, all around 0800 UTC on 11 July 2017 (Click to enlarge)


What GOES-16 Resolution will bring to IFR Probability

GOES-16 Brightness Temperature Difference field (10.3 µm – 3.9 µm) at 1247 UTC on 5 July 2017 (Click to enlarge)

GOES-16 data posted on this page are preliminary, non-operational data and are undergoing testing

GOES-R IFR Probabilities are computed using Legacy GOES (GOES-13 and GOES-15) and Rapid Refresh model information; GOES-16 data will be incorporated into the IFR Probability algorithm in late 2017

GOES-R IFR Probability fields continue to be created using legacy GOES (GOES-13 and GOES-15) data. This is slated to continue through late 2017. The toggle above, over Oregon, hints at how the change in resolution in GOES-16, even far from the sub-satellite point, will likely improve GOES-R IFR Probability performance in regions where topography can constrain low clouds and fog.  The GOES-16 Brightness Temperature Difference field, above, is color enhanced so that positive values (that is, where the brightness temperature at 10.3 µm is warmer than the 3.9 µm brightness temperature, which regions indicate cloud tops composed of water droplets, i.e., stratus) are whitish — and the data shows stratus/fog along the Oregon Coast, with fingers of fog advancing up small valleys.  The image below shows the GOES-R IFR Probability field for the same time (Click here for a toggle).

GOES-R IFR Probability fields show strong probabilities where the Brightness Temperature Difference field above is indicating low clouds.  This is not surprising as the morning fog on this date was not overlain by higher clouds.  However, the resolution inherent in the legacy GOES (inferior resolution compared to GOES-16), shows up plainly as a blocky field.  When GOES-R IFR Probability fields are computed using GOES-16 data, the IFR Probability field resolution will match the GOES-16 resolution.  (Click here for a aviationweather.gov observation of IFR / Low IFR conditions on the morning of 5 July).

GOES-R IFR Probability field computed from GOES-15 data at 1245 UTC on 5 July 2017 (Click to enlarge)

A similar set of figures for California at the same time is below.  The toggle is here, and the aviationweather.gov screen capture is here.

GOES-16 Brightness Temperature Difference field (10.3 µm – 3.9 µm) at 1247 UTC on 5 July 2017 (Click to enlarge)

GOES-R IFR Probability field computed from GOES-15 data at 1245 UTC on 5 July 2017 (Click to enlarge)