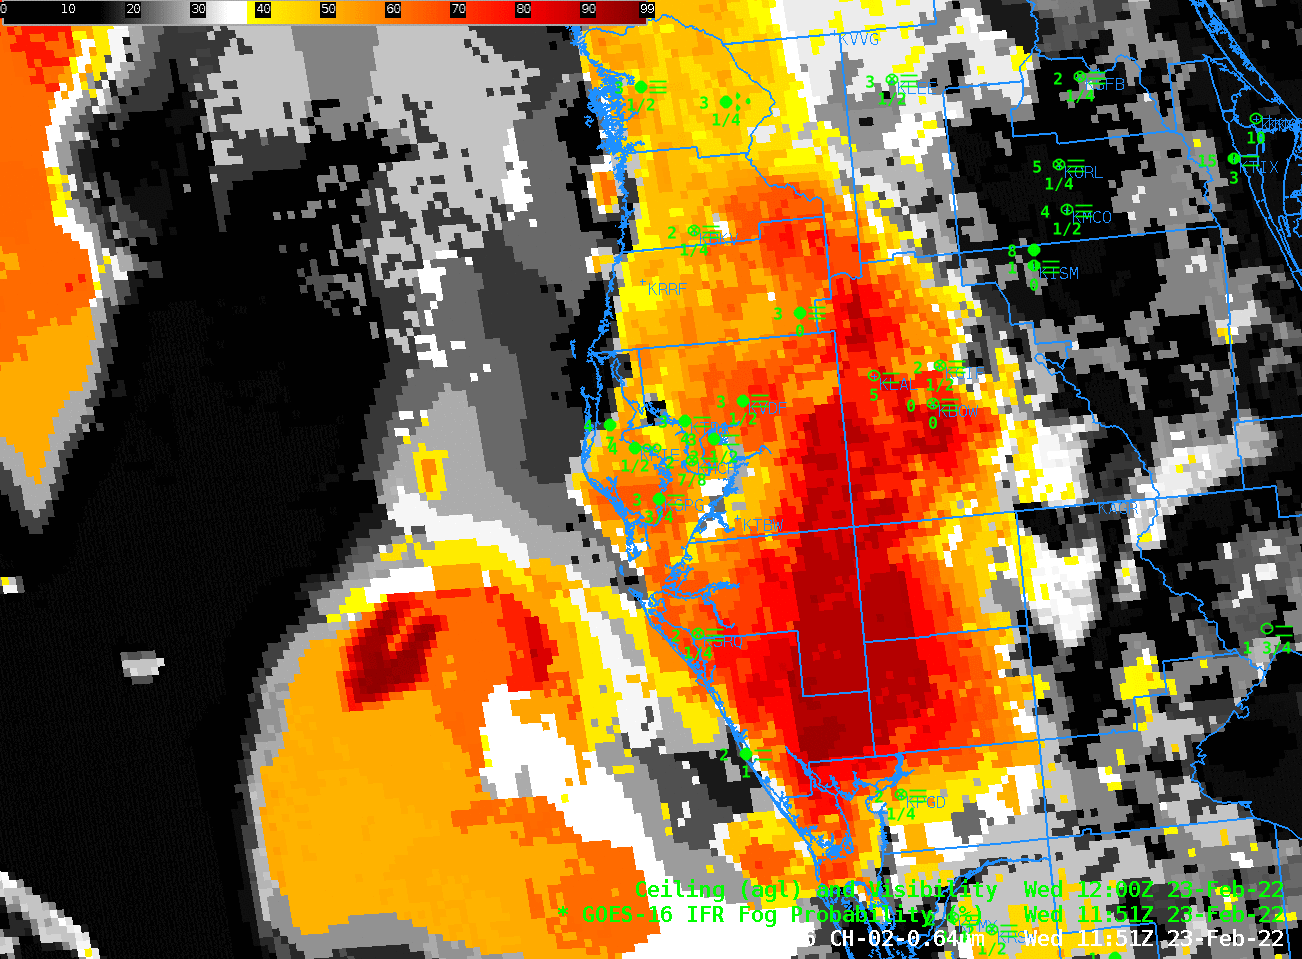
The animation below shows IFR Probability fields layered on top of visible imagery. Early morning fog that reduced visibilities and ceilings to sub-IFR conditions are indicated over much of the middle of the Florida peninsula. (Note that the IFR Probabilty color enhancement was altered so that it was transparent for values < 20%, allowing the visible imagery beneath to appear).
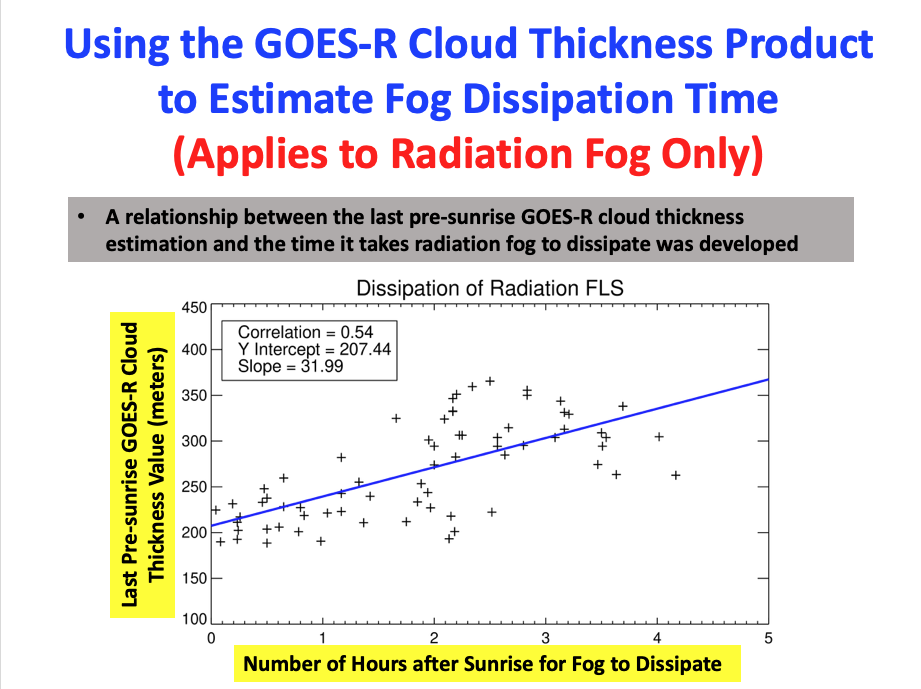
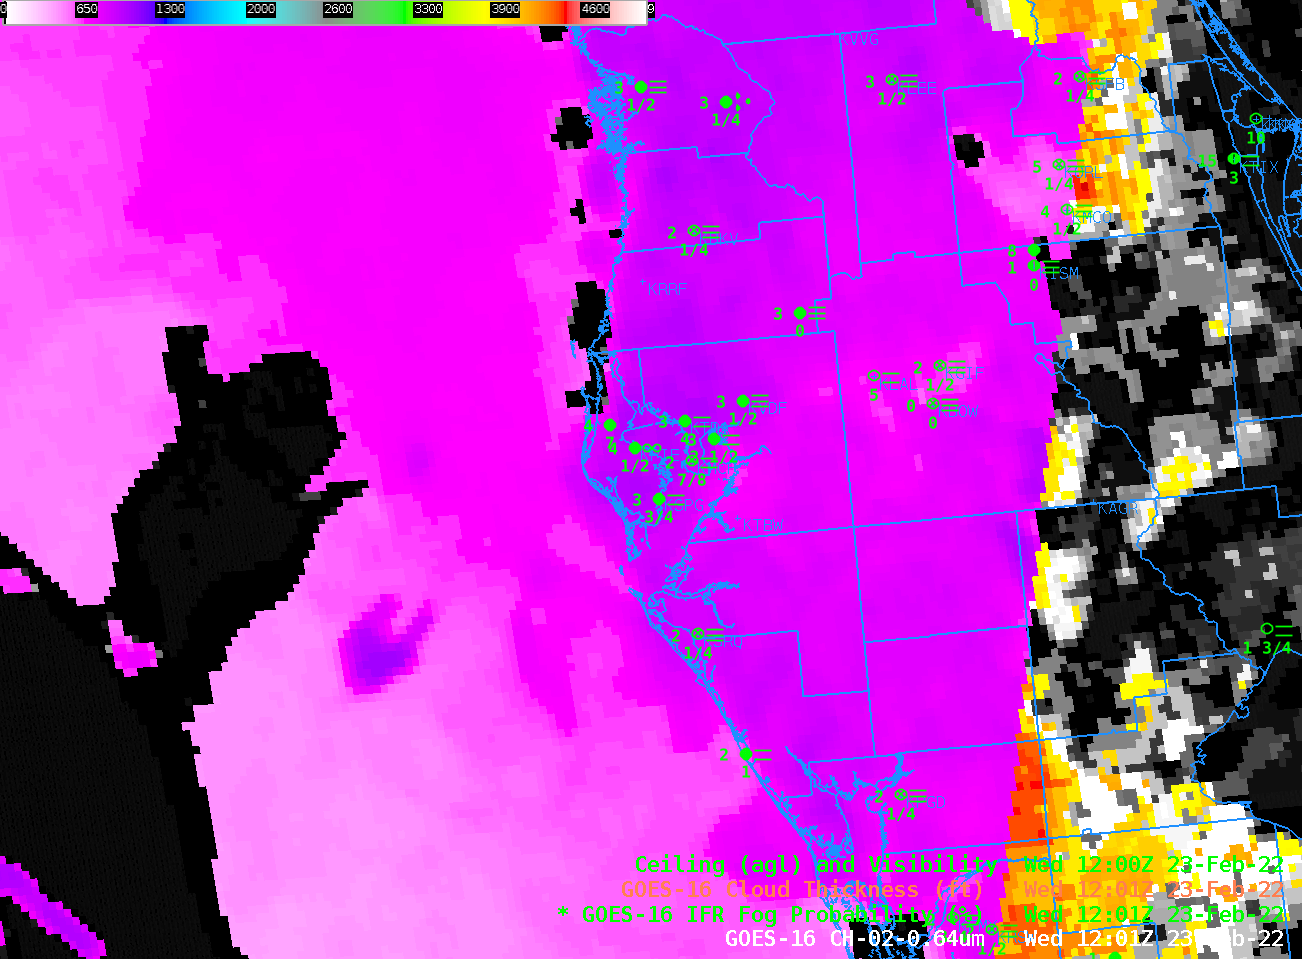
GOES-16 Cloud Thickness fields, below, depict a shallow fog: thickness values in general are under 1000 feet. This scatterplot relates the last pre-sunrise Cloud Thickness — in meters! — to burn-off time; a value of 1000 feet will burn off very quickly as observed above.
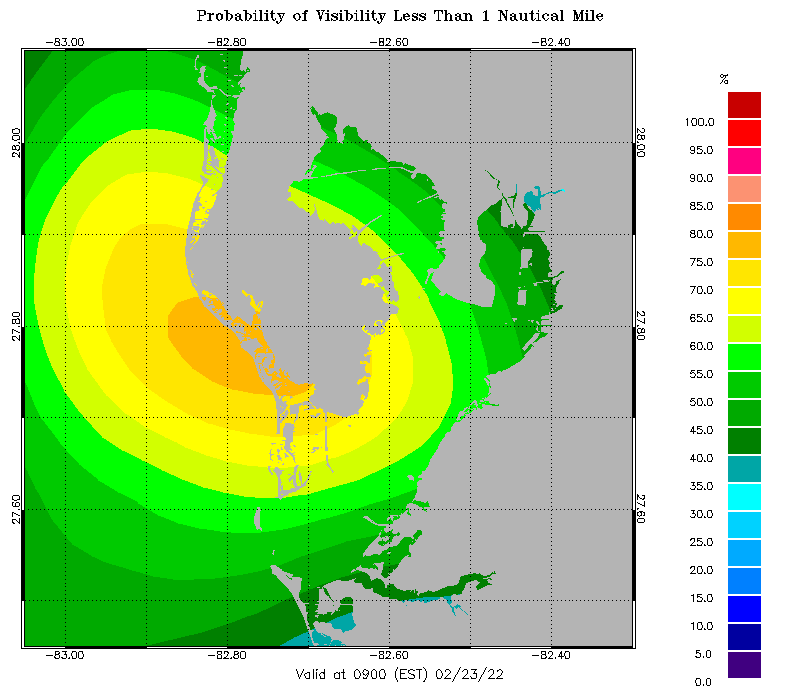
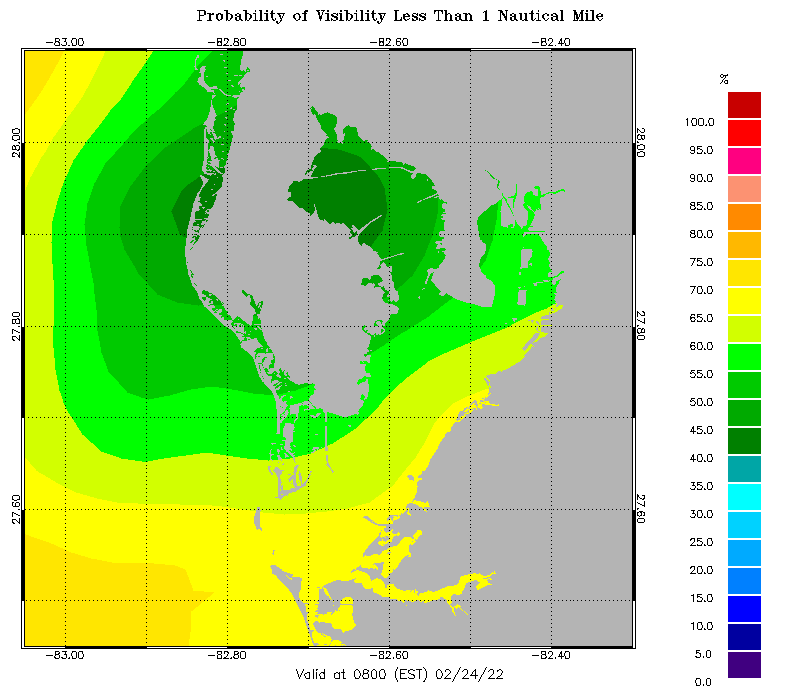
This website includes forecasts of visibility over Tampa Bay (and there are links to other coastal regions). The forecast below, for 1400 UTC 23 February / 0900 EST 23 February, has a maximum in predicted low visibility probability in about the right location. This forecast for the 24th suggests fog will be mostly offshore on the 25th.