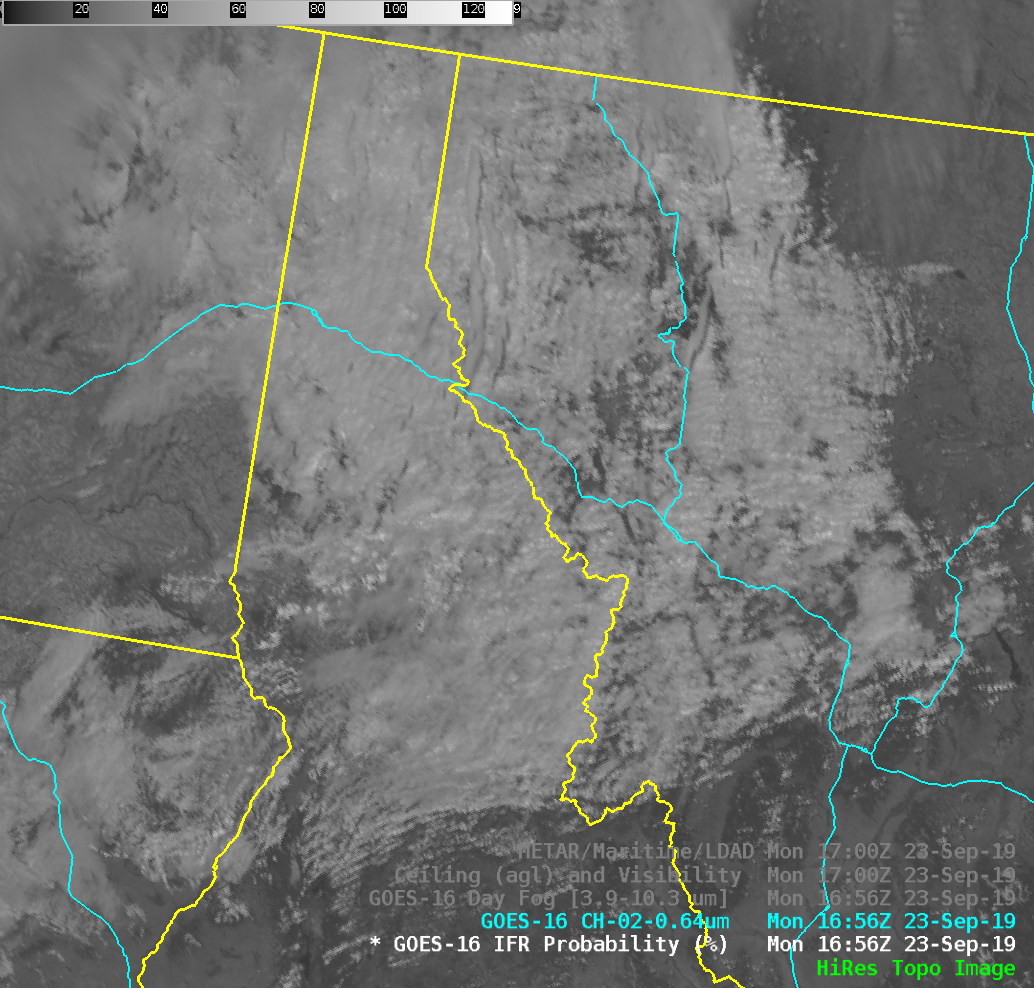
GOES-16 Band 2 (0.64 µm) over Montana and northern Idaho, 1656 UTC on 23 September 2019. Major highways are also shown, including east-west I-90 (Click to enlarge)
Consider the image shown above, visible imagery (0.64 µm) from the GOES-16 Advanced Baseline Imager. Can you tell at a glance where the IFR Conditions exist? If you are familiar with northern Rockies topography, and know that the prevailing surface winds in this area were southwesterly, perhaps you can make a good intuitive guess: low ceilings and reduced visibilities are likely on the upwind side of the topography.
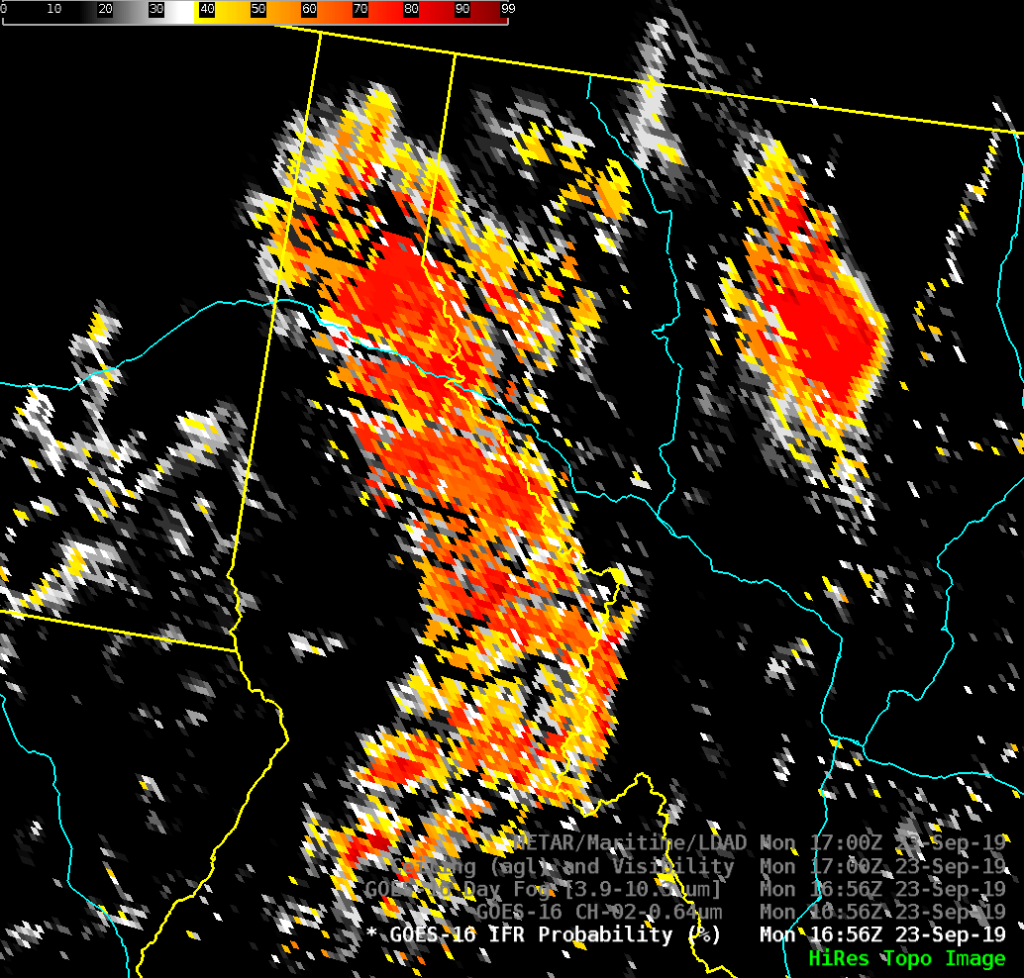
GOES-R IFR Probability fields are computed from visible and infrared imagery as well as from Rapid Refresh model estimates of low-level saturation. IFR Probability fields, below, correctly show increased likelihood of IFR conditions over the mountains, and mostly on the windward side of the topography. Mullan Pass, north of the center of the image, at ~6000 feet above sea level, is observing IFR conditions.
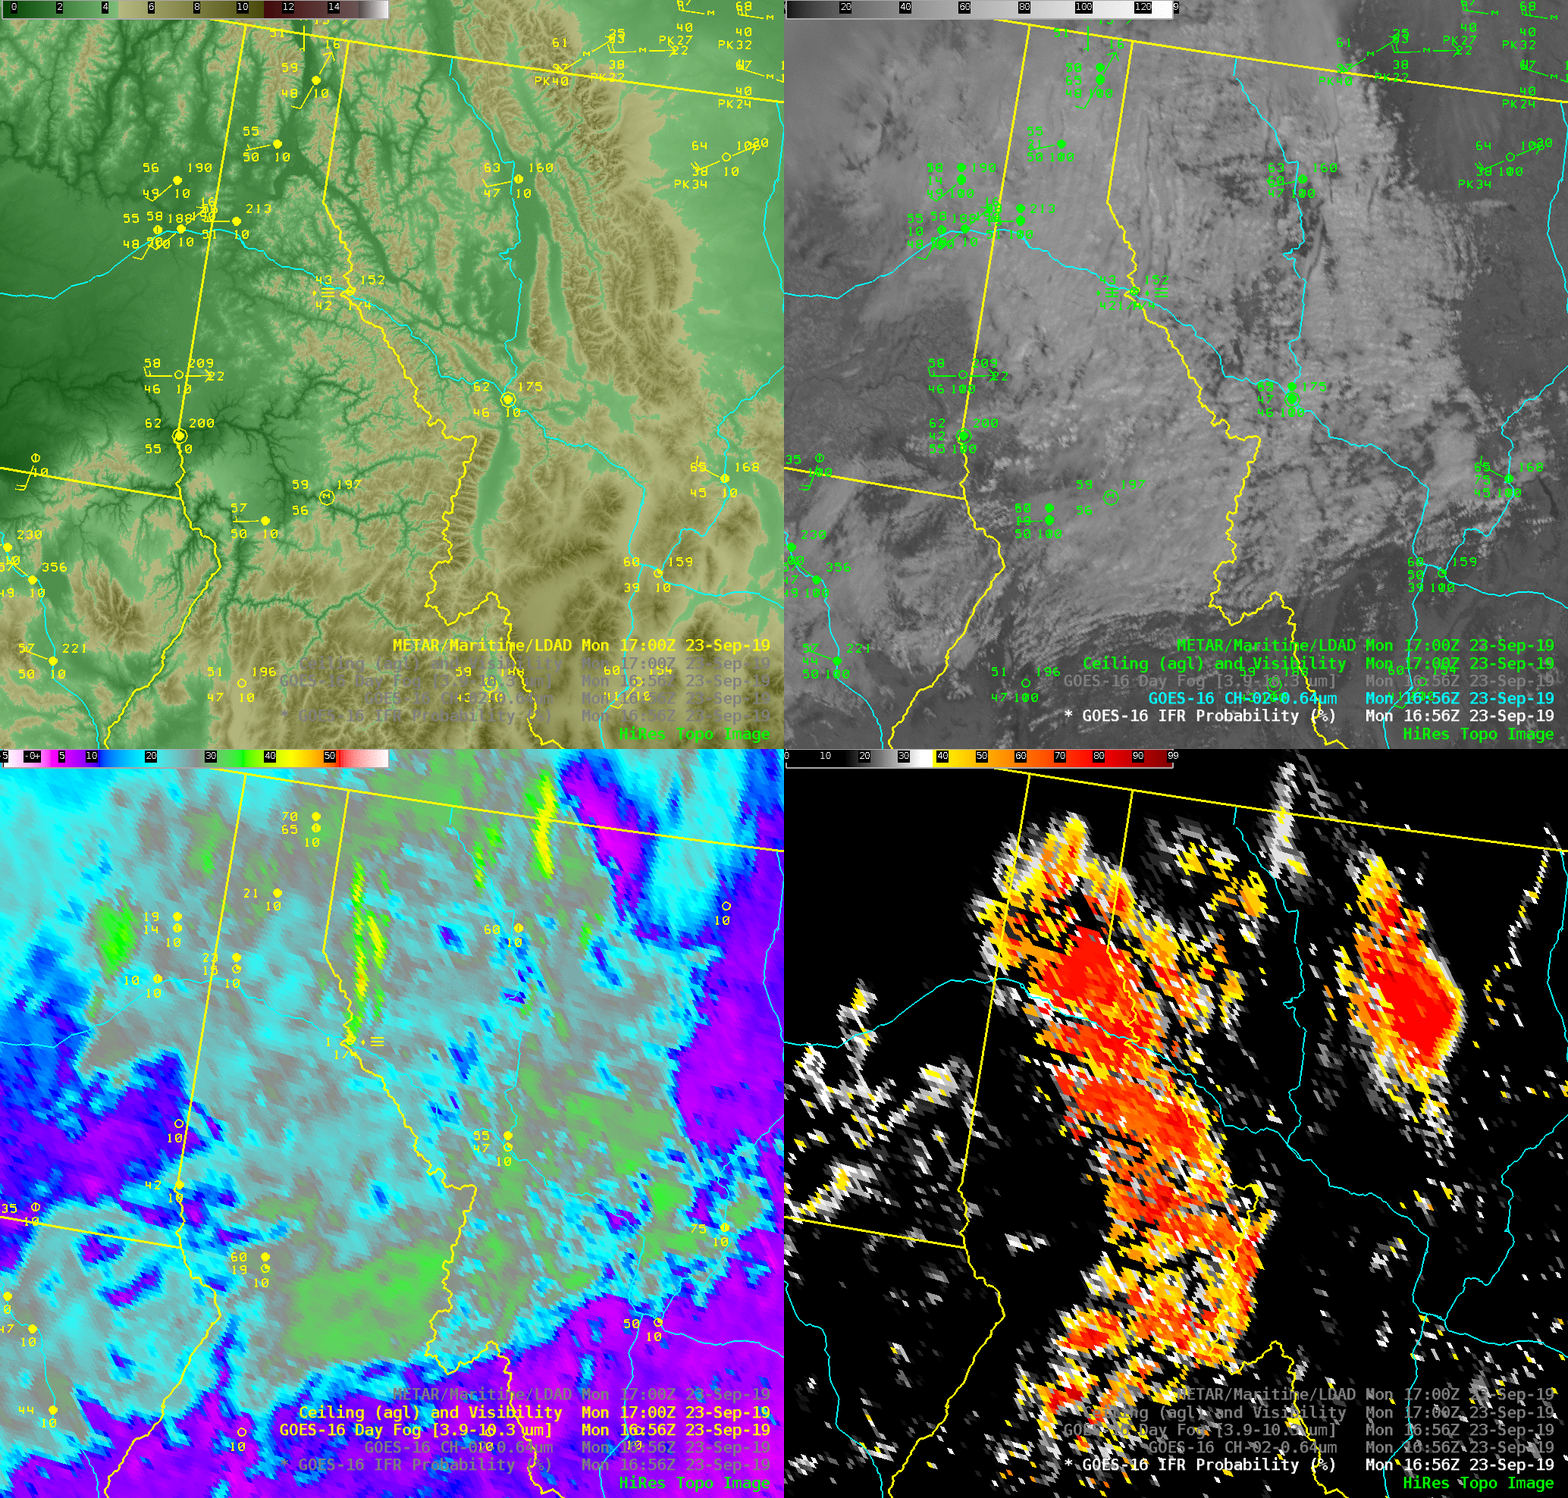
The animation below steps through the topography, visible imagery, ‘day fog’ brightness temperature difference (3.9 µm – 10.3 µm) and IFR Probability. The Brightness Temperature Difference field and the visible imagery show little relationship to the IFR Probability field.

Topography, GOES-16 ABI Band 2 (0.64 µm), ‘Day Fog’ Brightness temperature Difference (3.9 µm – 10.3 µm) and IFR Probability fields, all at 1656 UTC on 23 September 2019 (Click to enlarge)
An added benefit of IFR Probability fields: It can be used day or night.


