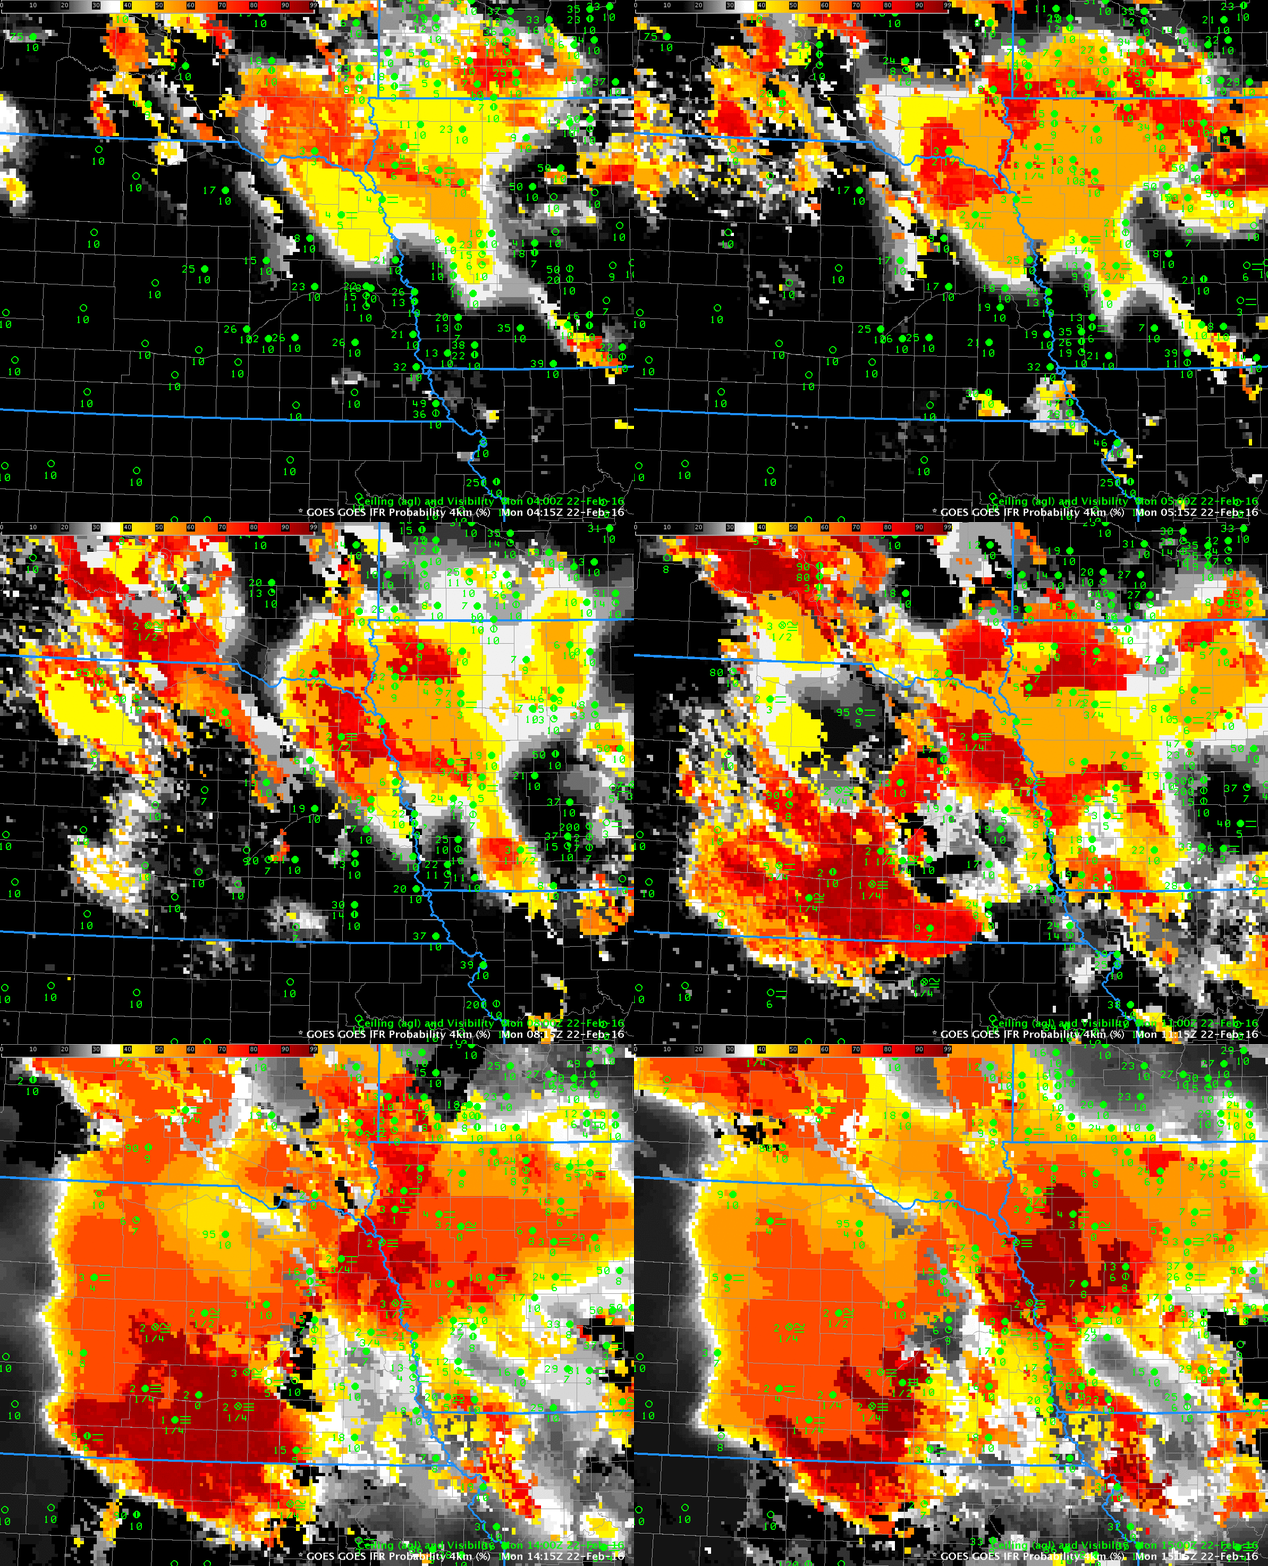
GOES-R IFR Probability fields, hourly from 0415 to 1515 UTC on 22 February, along with surface observations of ceilings and visibilities (Click to enlarge)
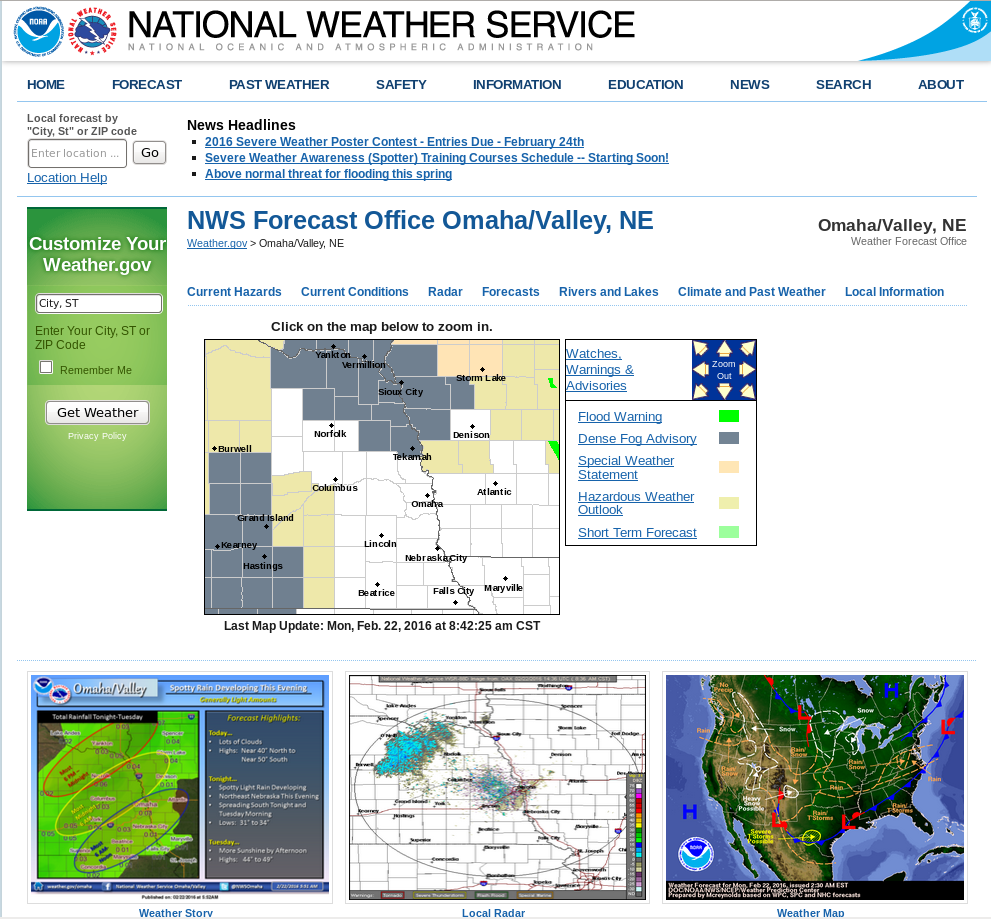
Dense Fog developed in two regions over Nebraska overnight, as shown in the screen capture below (from 1445 UTC) showing Dense Fog Advisories. GOES-R IFR Probabilities discerned the differences between the two regions, as shown in the animation above. The fog feature near the Missouri River (the boundary between Iowa and Nebraska) developed first in a region where high clouds were also present. That high clouds are present is apparent from the flat nature (that is, not pixelated) of the IFR Probability field at, say, 0415 and 0515 over western Iowa. The second region of fog, over south-central Nebraska, develops under clear skies as evidences by the (initially) very pixelated field. Towards the end of the animation high clouds overspread that region also. When that happens, IFR Probability values drop (because only model predictors can be used in the computation of IFR Probability in regions where high clouds exist). At the end of the animation, largest IFR Probabilities overlap the two regions where Dense Fog Advisories were issued. The region in between the advisories has lower Probabilities.
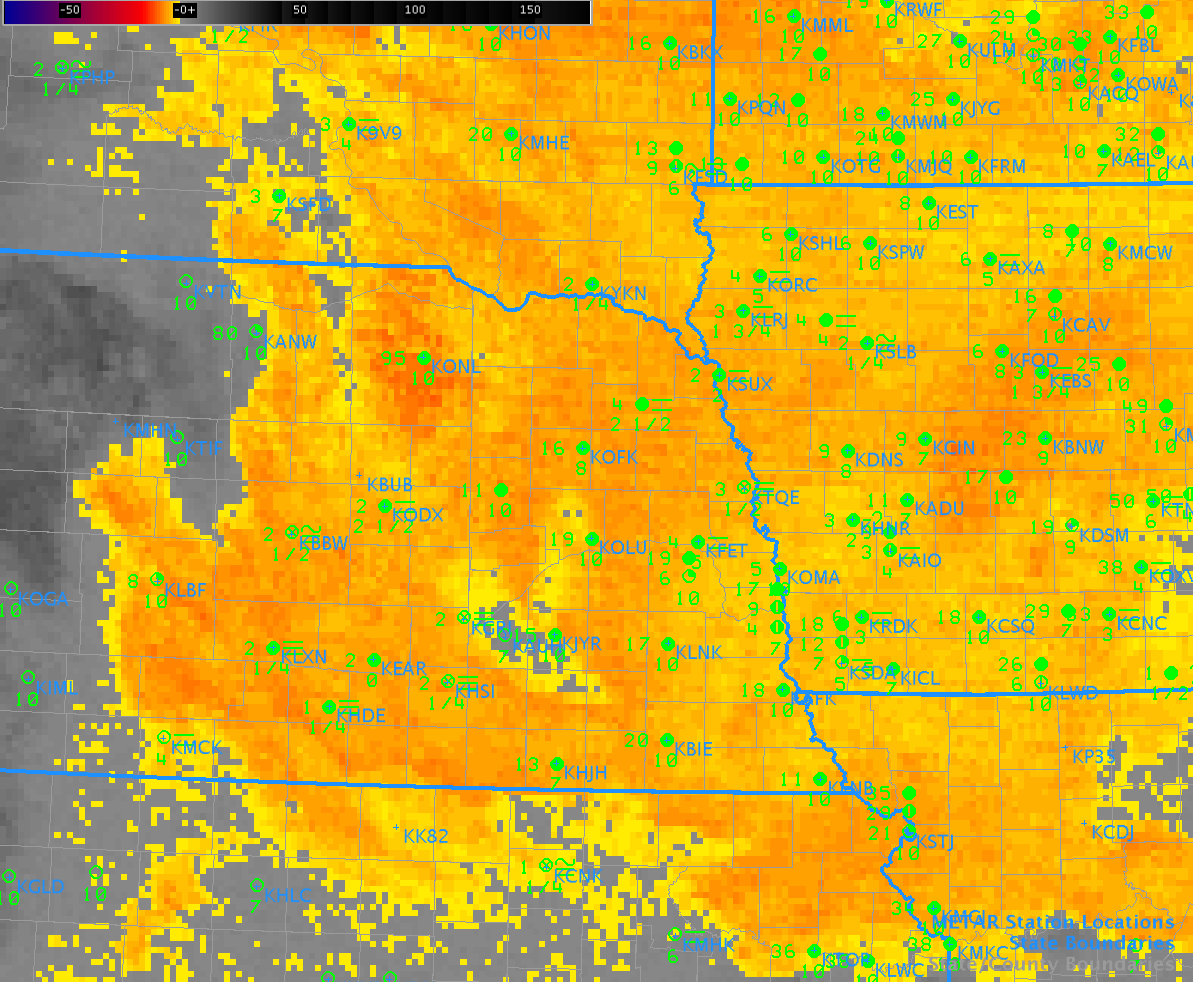
Compare the IFR Probability field, above, to Brightness Temperature Difference, below. Brightness Temperature Difference fields identify regions of Fog and Stratus, but near-surface information cannot be extrapolated (consistently) from cloud-top information. Thus, many stations with ceilings and visibilities far better than IFR conditions are in regions where a strong Brightness Temperature Difference signal exists (for example, KONL in northeastern Nebraska), The incorporation of surface information via Rapid Refresh model predictions of near-surface saturation allows the IFR Probability fields to better outline regions of IFR conditions only.


