Monthly Archives: December 2015

Persistent fog and freezing fog over New Mexico and Texas

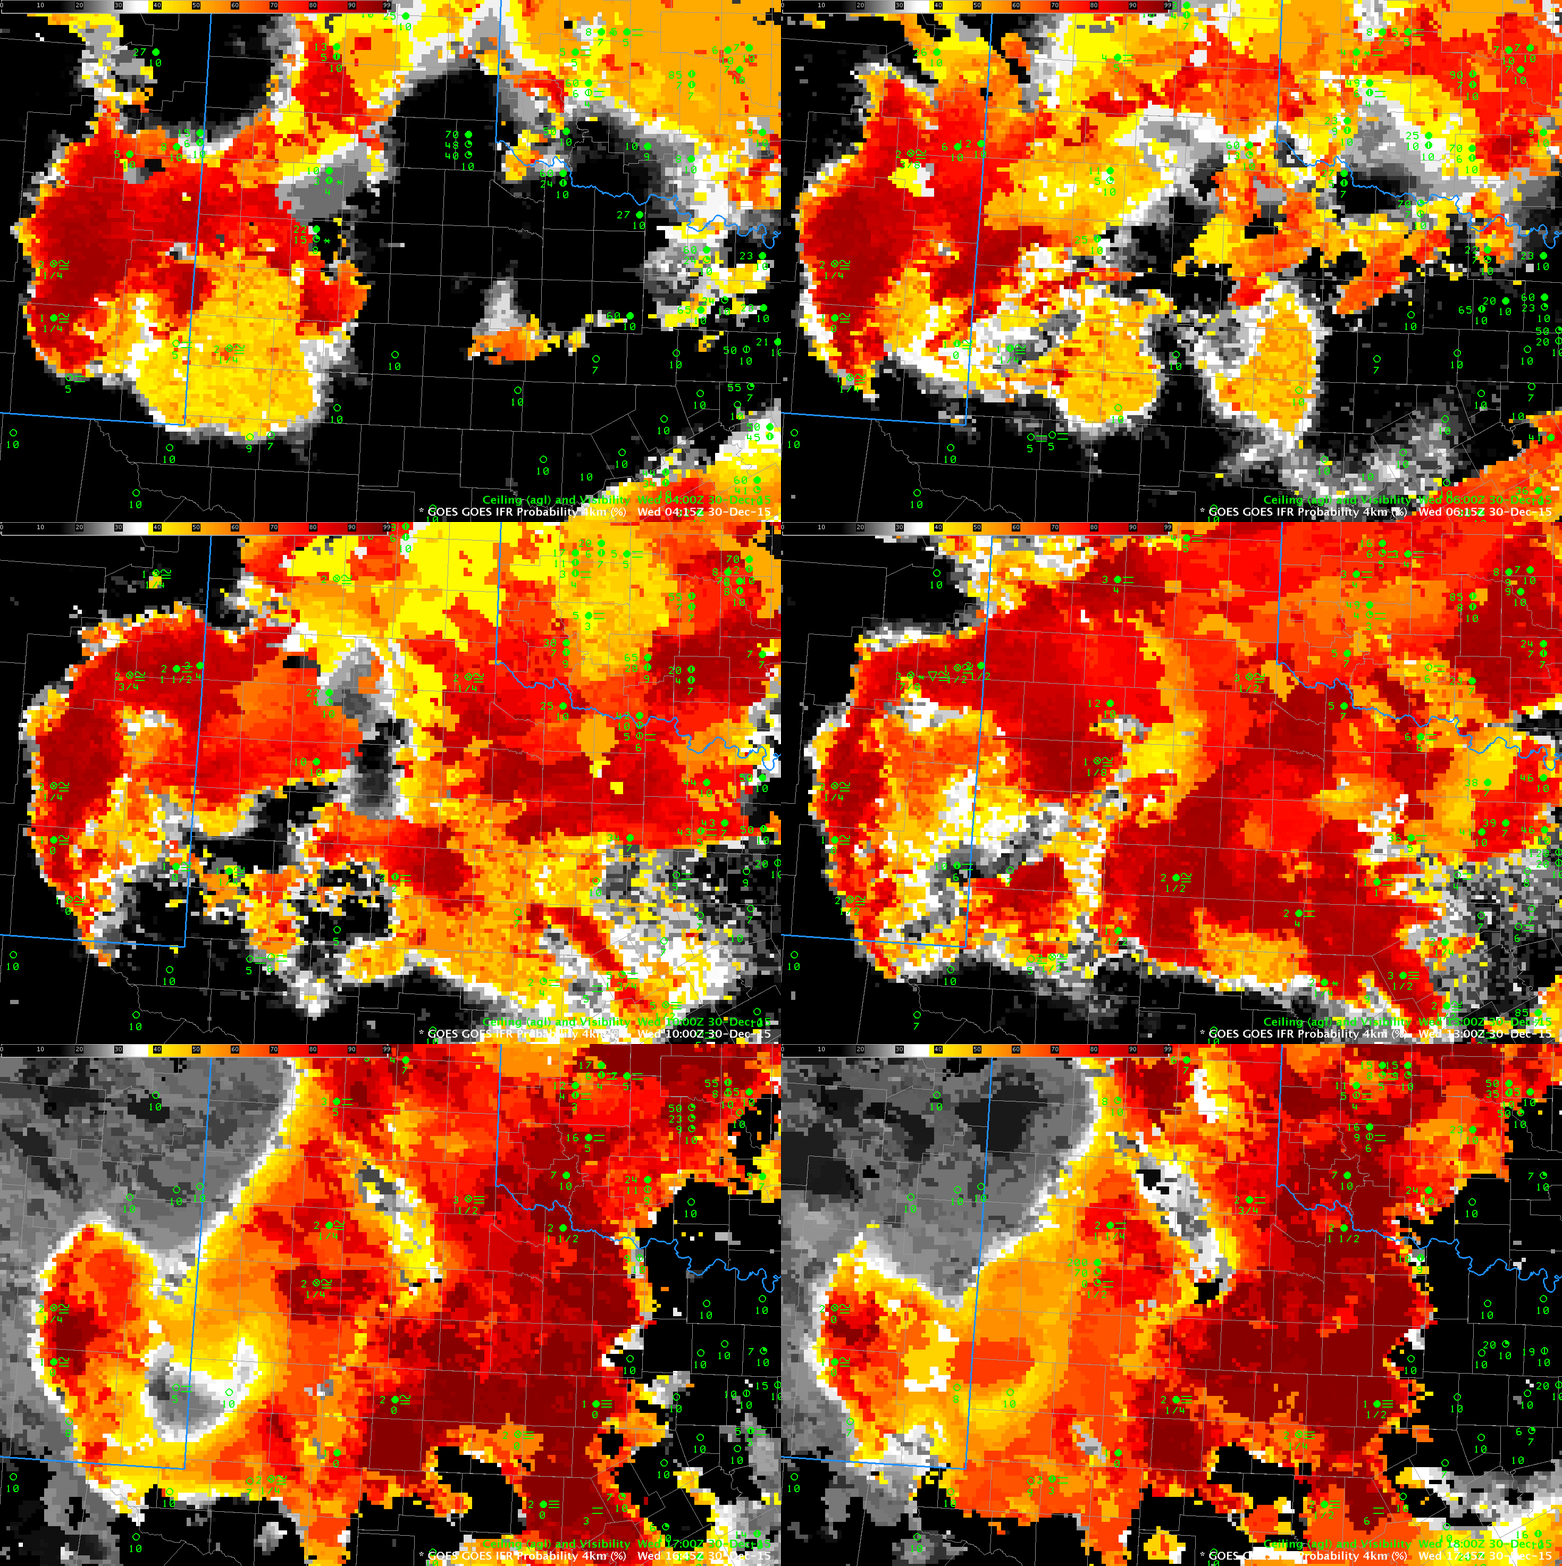
GOES_R_IFR_30Dec2015anim_0415_1745

GOES-R IFR Probability fields, 0415-1745 UTC on 30 December 2015 (Click to enlarge)

Fog with sub-freezing temperatures developed over New Mexico and west Texas early on the 30th of December, and persisted into mid-day. How well did conventional (and newer) algorithms designed to detect fog perform? The GOES-R IFR Probability fields, above, hourly from 0415 UTC through 1745 UTC on 30 December, show highest IFR Probabilities initially along the Pecos River in New Mexico. Airports at both Artesia and Roswell reported IFR conditions continuously during the period shown. IFR Conditions developed over Texas west of a line from about Breckenridge (in Stephens County) to Vernon Texas (in Wilbarger County). The southern extent of the ice fog was near a Midland (in Midland County) to Coleman (in Coleman County) line. High IFR Probabilities were common over Texas where the Fog/Freezing Fog was occurring.

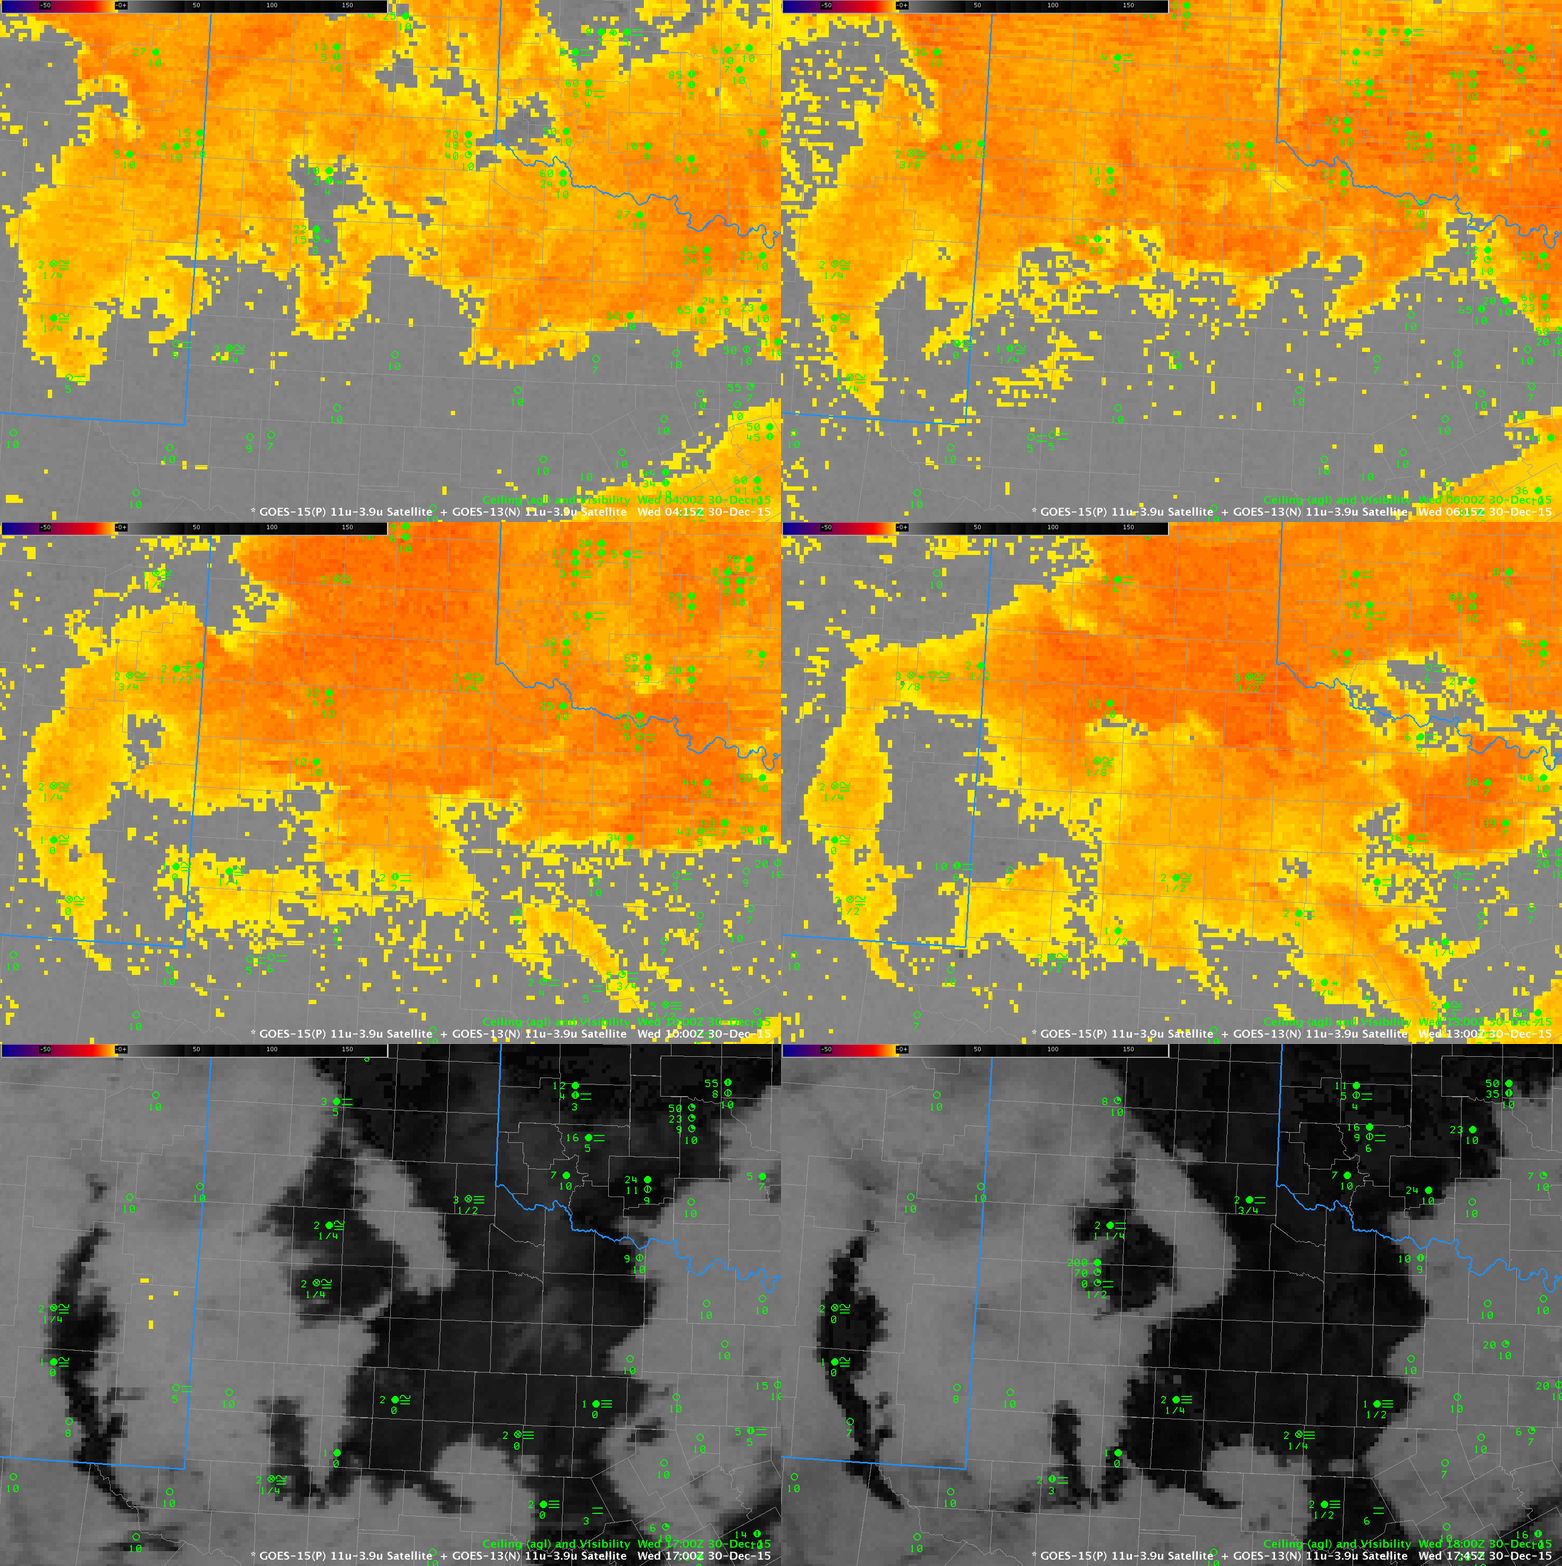
The Brightness Temperature Difference field for the same times are shown below. The Brightness Temperature Difference field captures the presence of water-based clouds along the Pecos River in New Mexico — both at night (orange enhancement) and during the day (black enhancement). The Brightness Temperature Difference field tells you something about the top of the cloud only, however; it cannot give information about the cloud base. (In contrast, the GOES-R IFR Probability product, because it fuses satellite data with surface information derived from Rapid Refresh Model output, a distinction between mid-level stratus and low fog is possible). In addition, there are regions in the brightness temperature difference field where no strong signal occurs even though fog is present (Hobbs, NM in Lea County and Seminole TX in Gaines County, for example).

BTD_30Dec2015anim_0415_1745

GOES-13 Brightness Temperature Difference Fields (10.7 µm – 3.9 µm), 0415-1745 UTC on 30 December 2015 (Click to enlarge)

Fog and Stratus over the Northern Plains

IFRProb_21dece2015anim

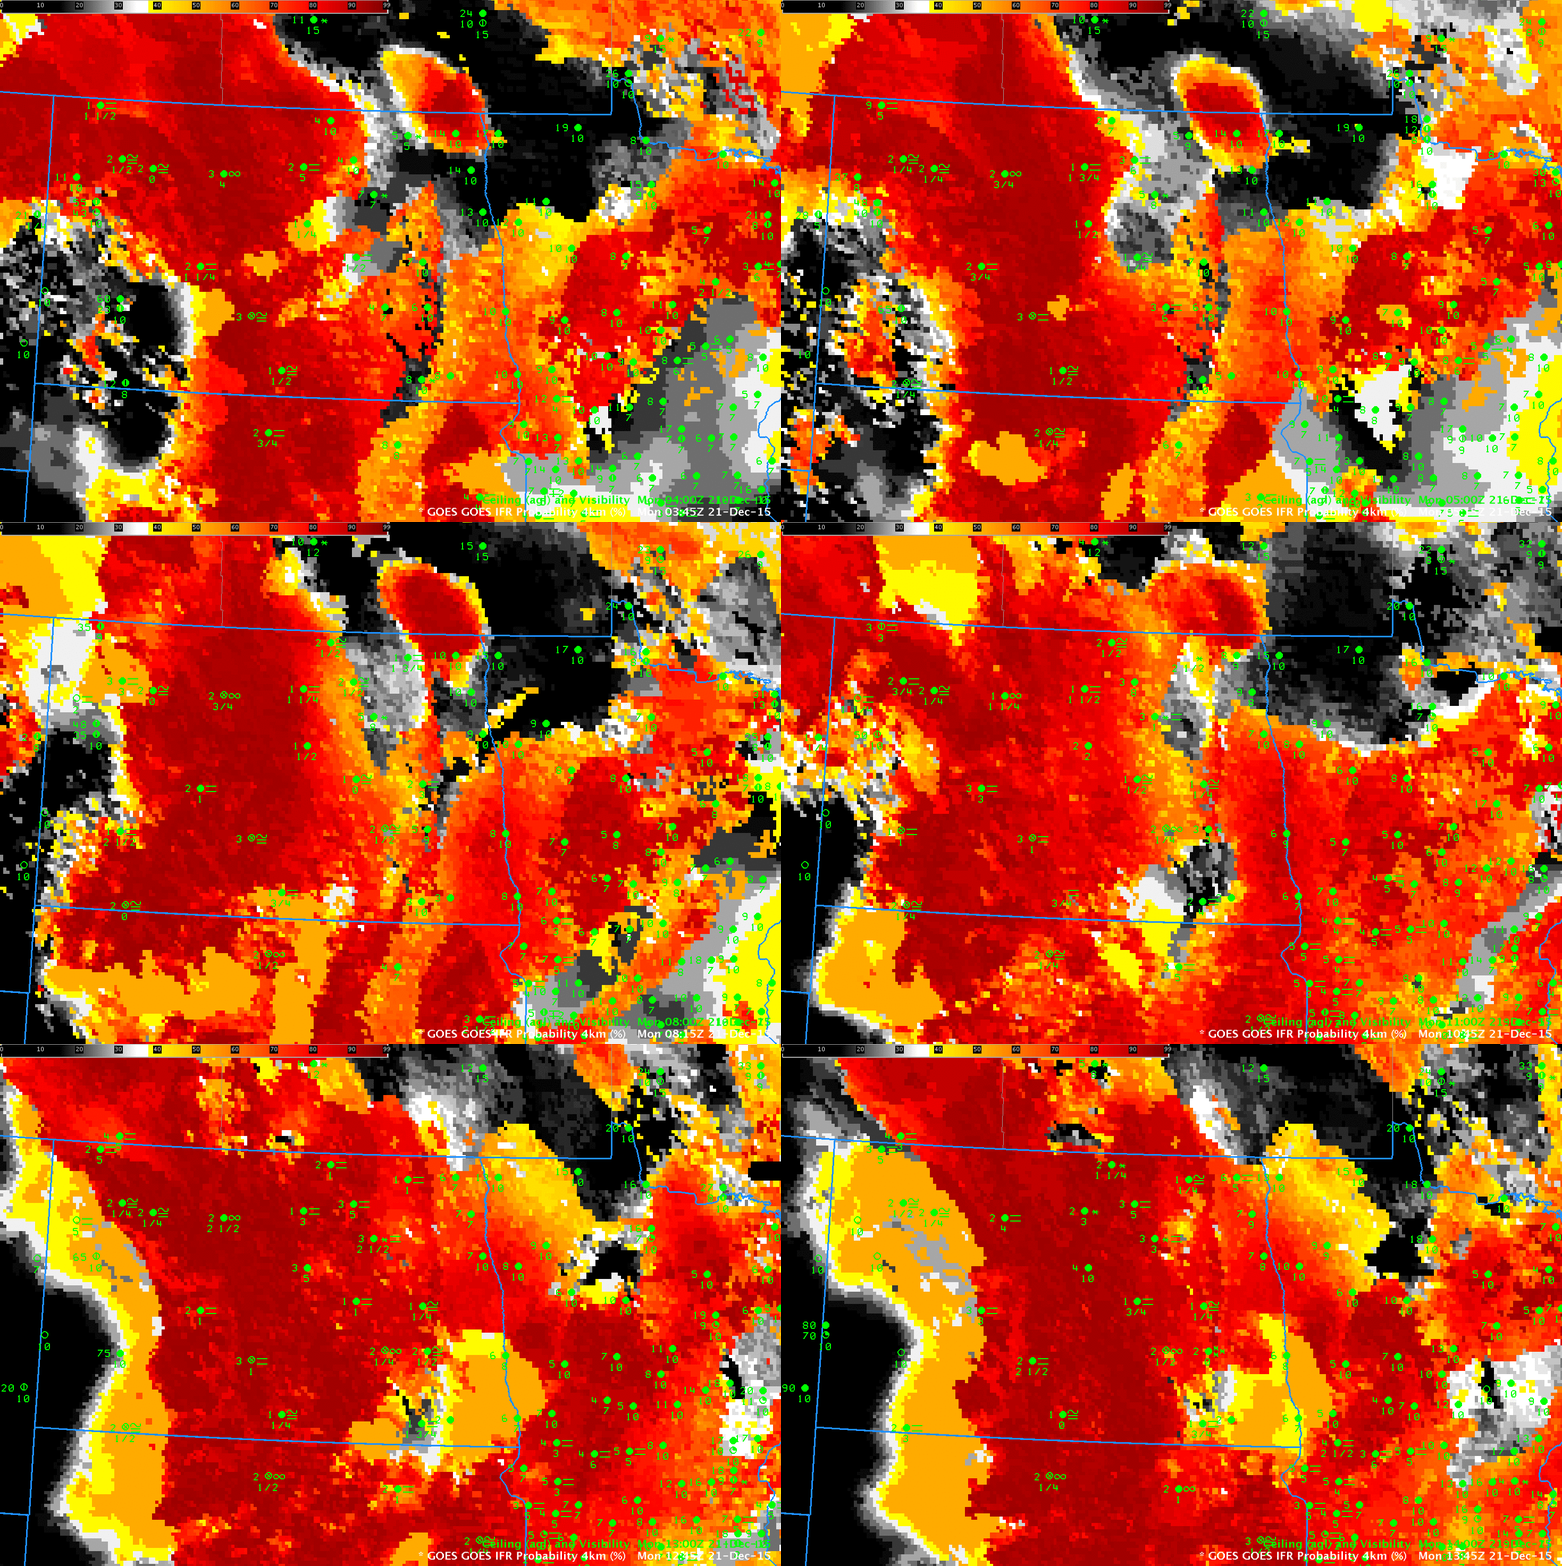
GOES-R IFR Probability Fields, 0345-1345 UTC on 21 December 2015 (Click to enlarge)

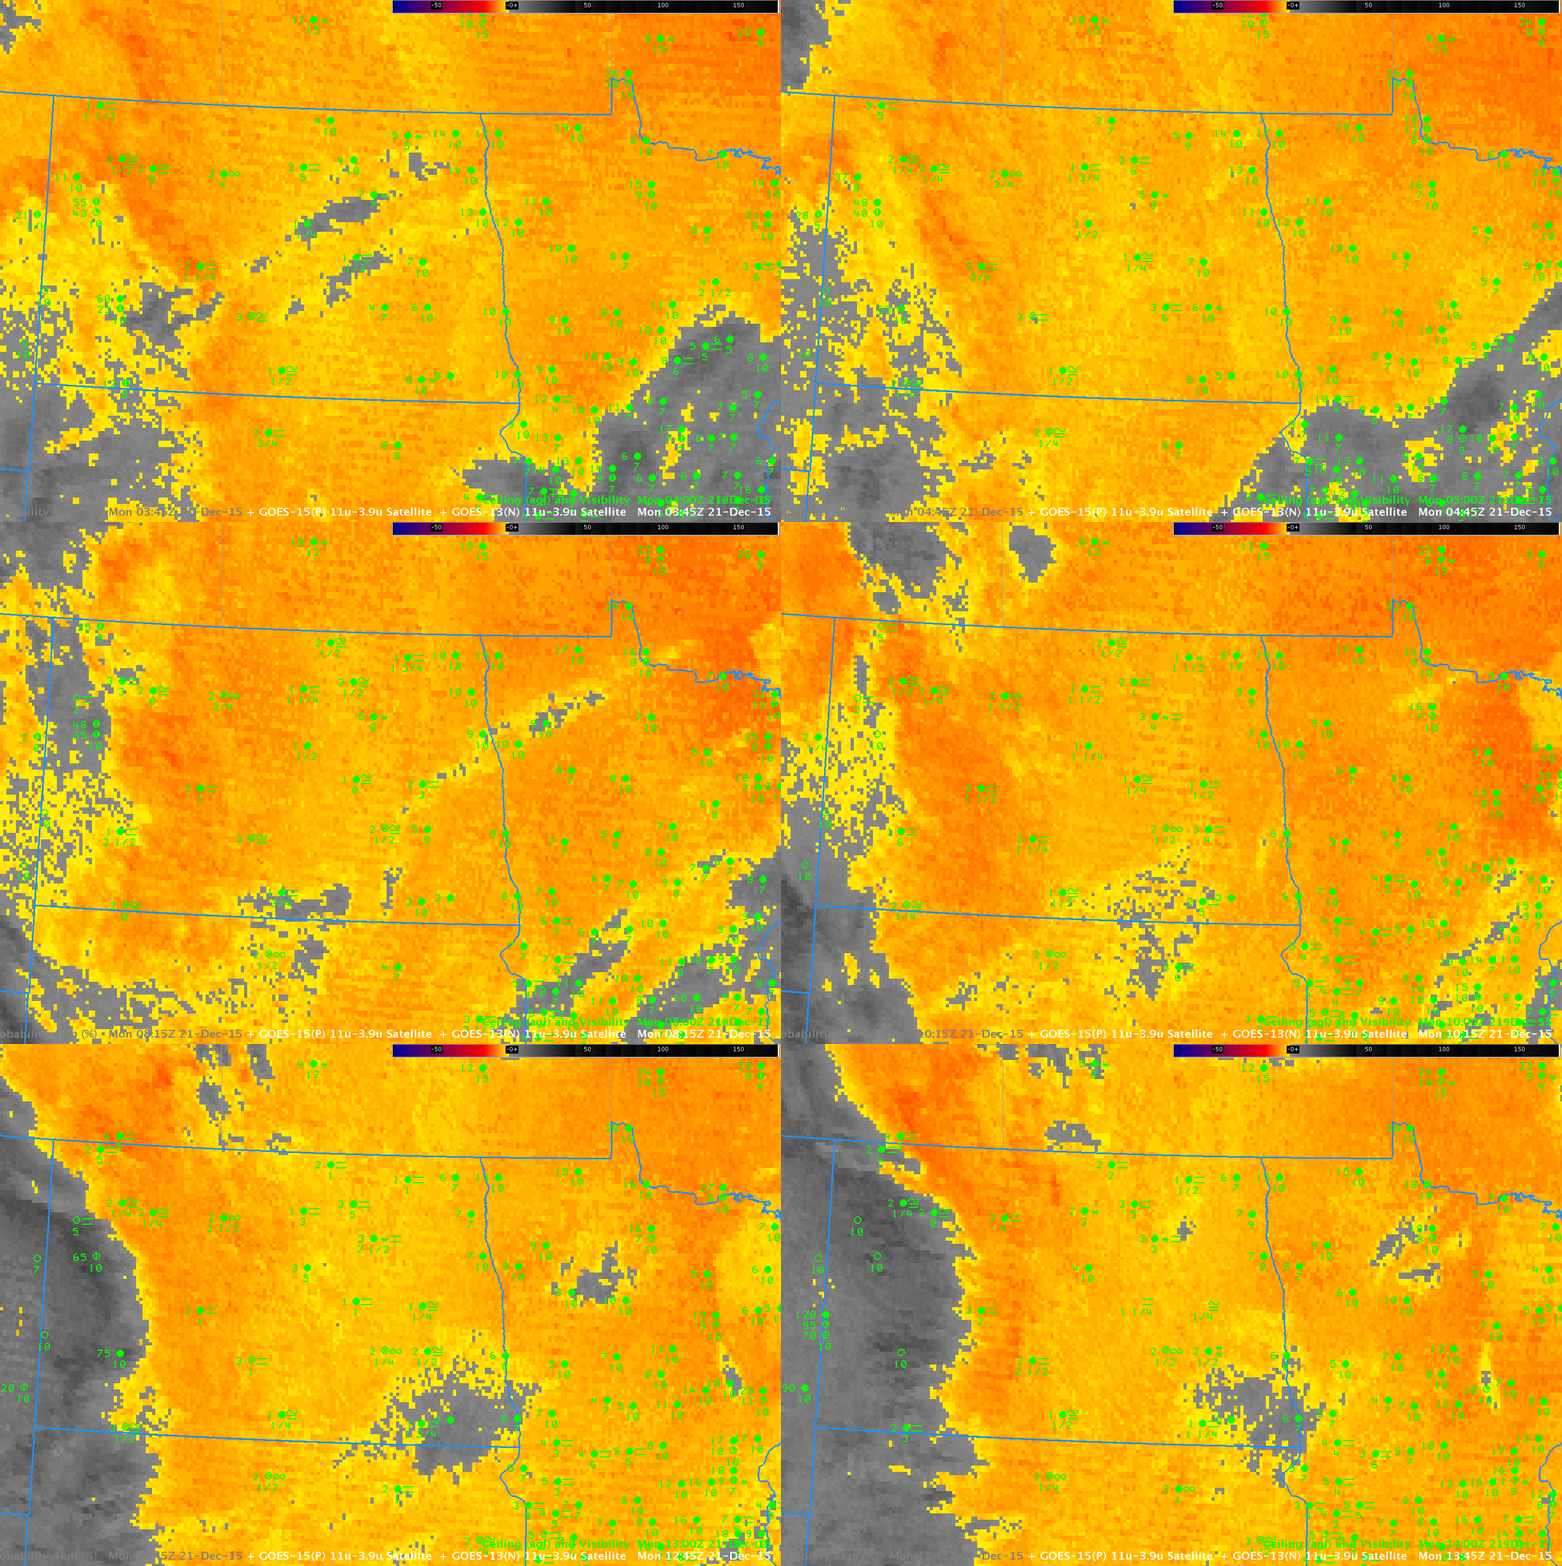
The National Weather Service in Bismarck issued Dense Fog Advisories for a fog and freezing fog early in the morning on December 21 (Happy Solstice!!) 2015. (Link). The half-hourly animation above shows the GOES-R IFR Probability during the overnight hours of 20-21 December 2015. (Here is a faster animation). Several aspects of this animation warrant comment. First, the western edge of the IFR Conditions matches well with the western edge of highest IFR Probabilities over North Dakota. This is true even as high clouds (obvious in the animation of Brightness Temperature Difference, below) move over North Dakota from the west: When this happens, IFR Probabilities decrease (and the field itself becomes more horizontally uniform) because Rapid Refresh Model Data output is the main predictor being used to diagnose the IFR Probability. The edge of the IFR Probability field moves through Dickinson ND (in the southwest part of the state) as the ceilings and visibilities there improve.

In addition, a persistent region of small IFR Probabilities exists over northern Minnesota in a region where IFR conditions are not reported. The Brightness Temperature Difference field there (below) shows a strong signal. (Click here for a faster animation of Brightness Temperature Difference) Thus, GOES-R IFR Probability is better able to differentiate between mid-level stratus and low stratus/fog. Over northern Minnesota, the Satellite data says water-based clouds are present, but the Rapid Refresh data notes little saturation in the lowest 1000 feet of the model. Thus, IFR Probabilities are small there.

GOESBTD_21Dece2015anim

GOES-13 Brightness Temperature Difference Fields (10.7 µm – 3.9 µm), 0345-1345 UTC on 21 December 2015 (Click to enlarge)

Fog vs. Stratus over the Pacific Northwest

Brightness Temperature Difference (10.7 µm – 3.9 µm) from GOES highlight regions of water-based clouds:  water-based clouds emit 10.7 µm radiation nearly as a blackbody does, but those clouds do not emit 3.9 µm radiation as a blackbody.  Thus, the brightness temperature computed from the radiation detected by the satellite (GOES-15 in this case) — a computation that assumes a blackbody emission — is relatively cooler for the 3.9 µm data compared to the 10.7 µm data.  A water-based cloud is normally stratus, and the pertinent question for aviation purposes (for example) is:  Is the ceiling of that cloud near the surface?  (That is:  Is the stratus also a fog bank, or is it “just” mid-level stratus?)
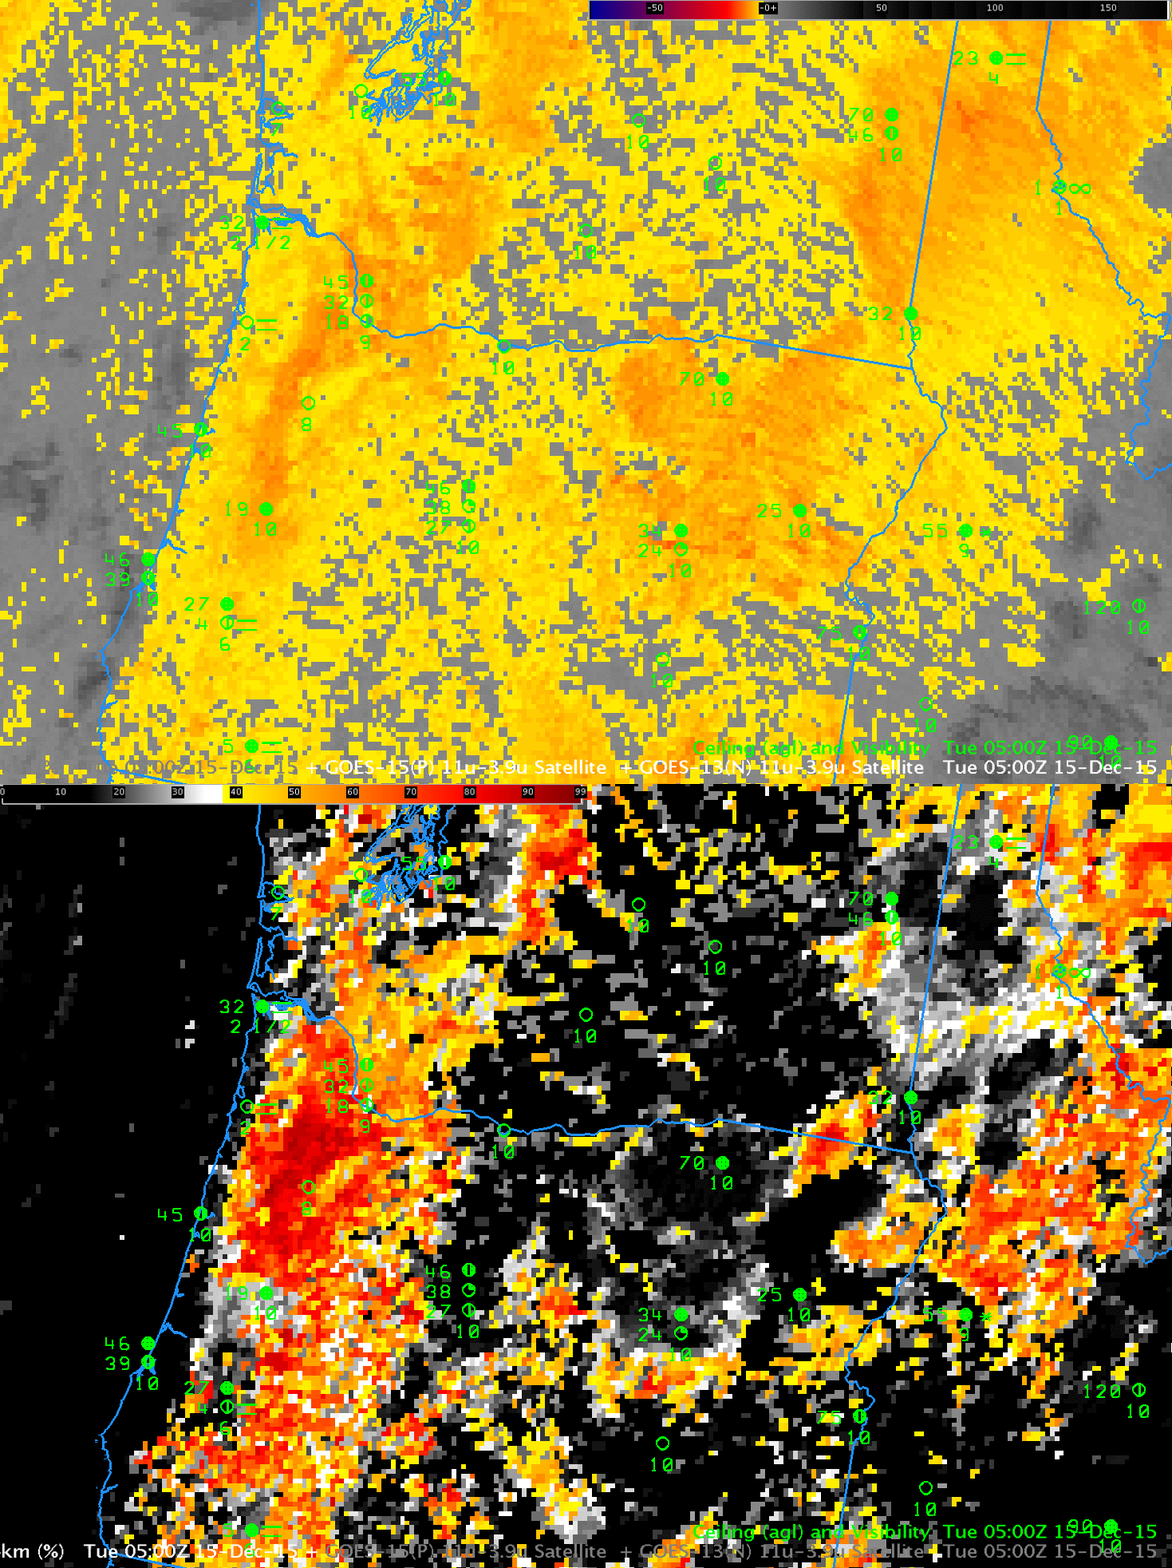
GOESIFRP_BTD_15December2015_0500UTCtoggle

GOES-15 Brightness Temperature Difference (10.7 µm – 3.9 µm) and GOES-based GOES-R IFR Probabilities, 0500 UTC 15 December 2015 (Click to enlarge)

The toggles above (0500 UTC) and below (0900 UTC) show how the GOES-R IFR Probability fields capably screen out many regions of mid-level stratus. This is achieved by fusing the brightness temperature difference information with data from the Rapid Refresh Model. If the lowest 1000 feet of the Rapid Refresh Model is not near saturation, probabilities of IFR conditions are reduced.
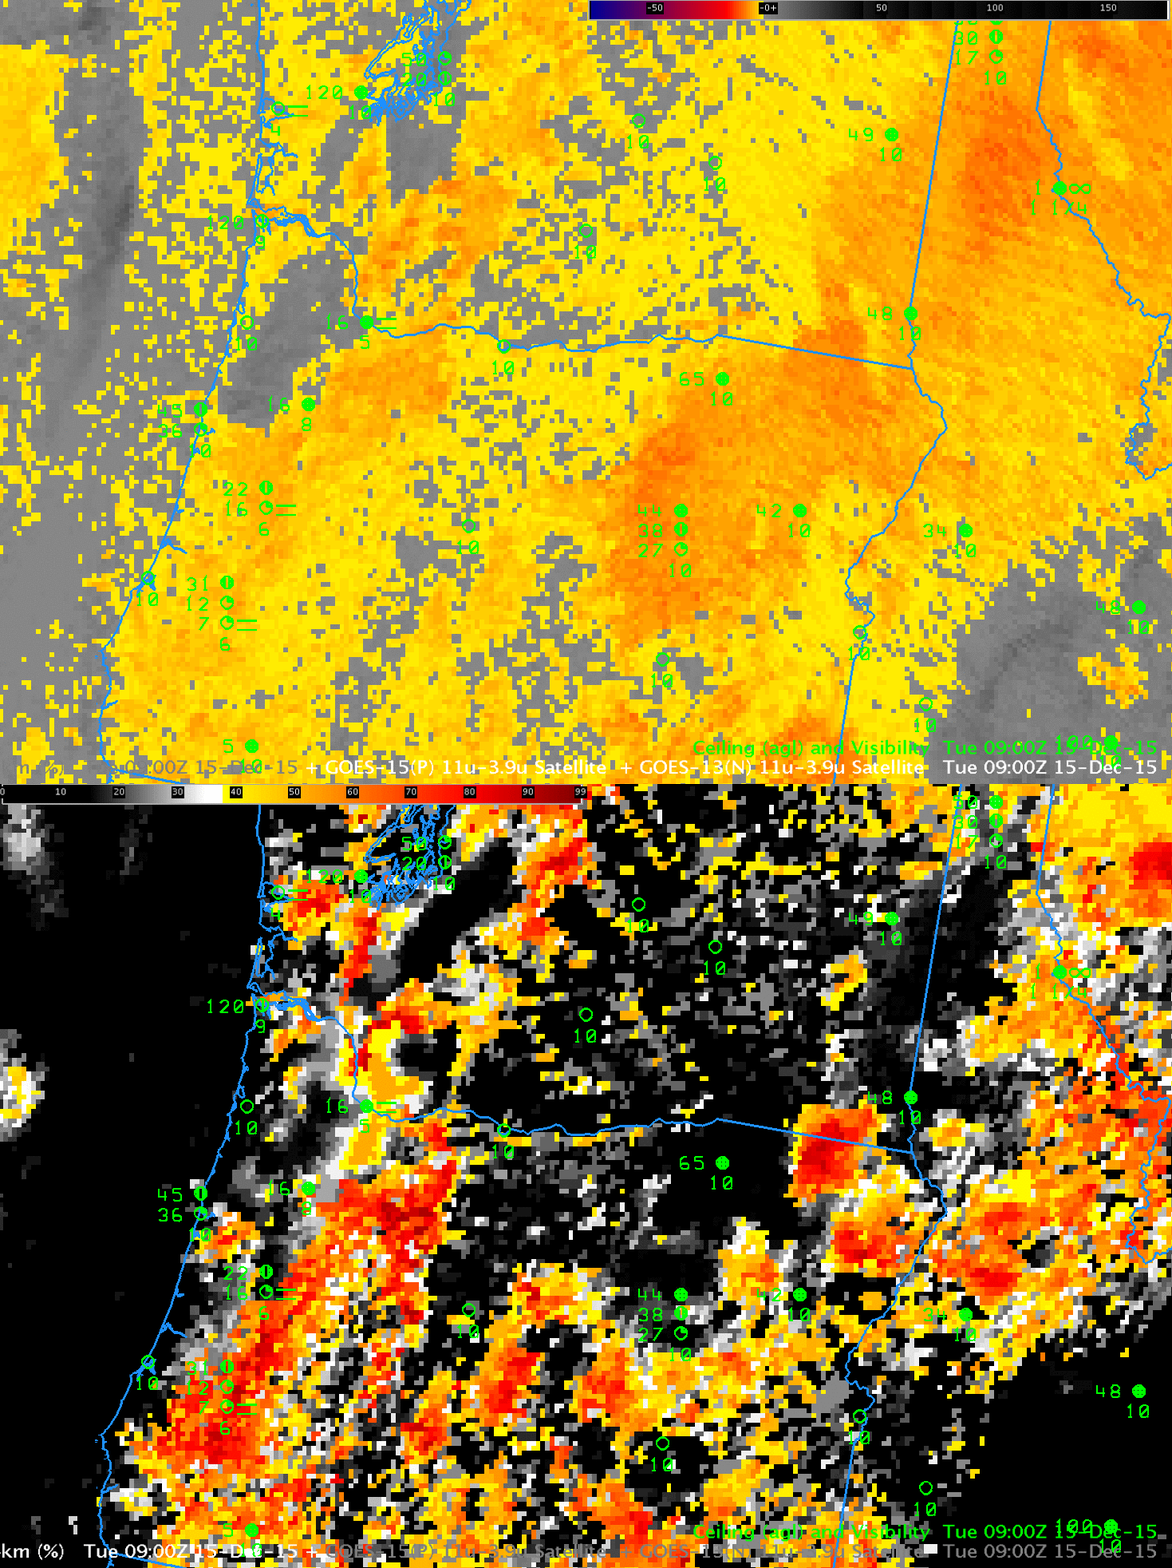
GOESIFRP_BTD_15December2015_0900UTCtoggle

As above, but at 0900 UTC 15 December 2015 (click to enlarge)
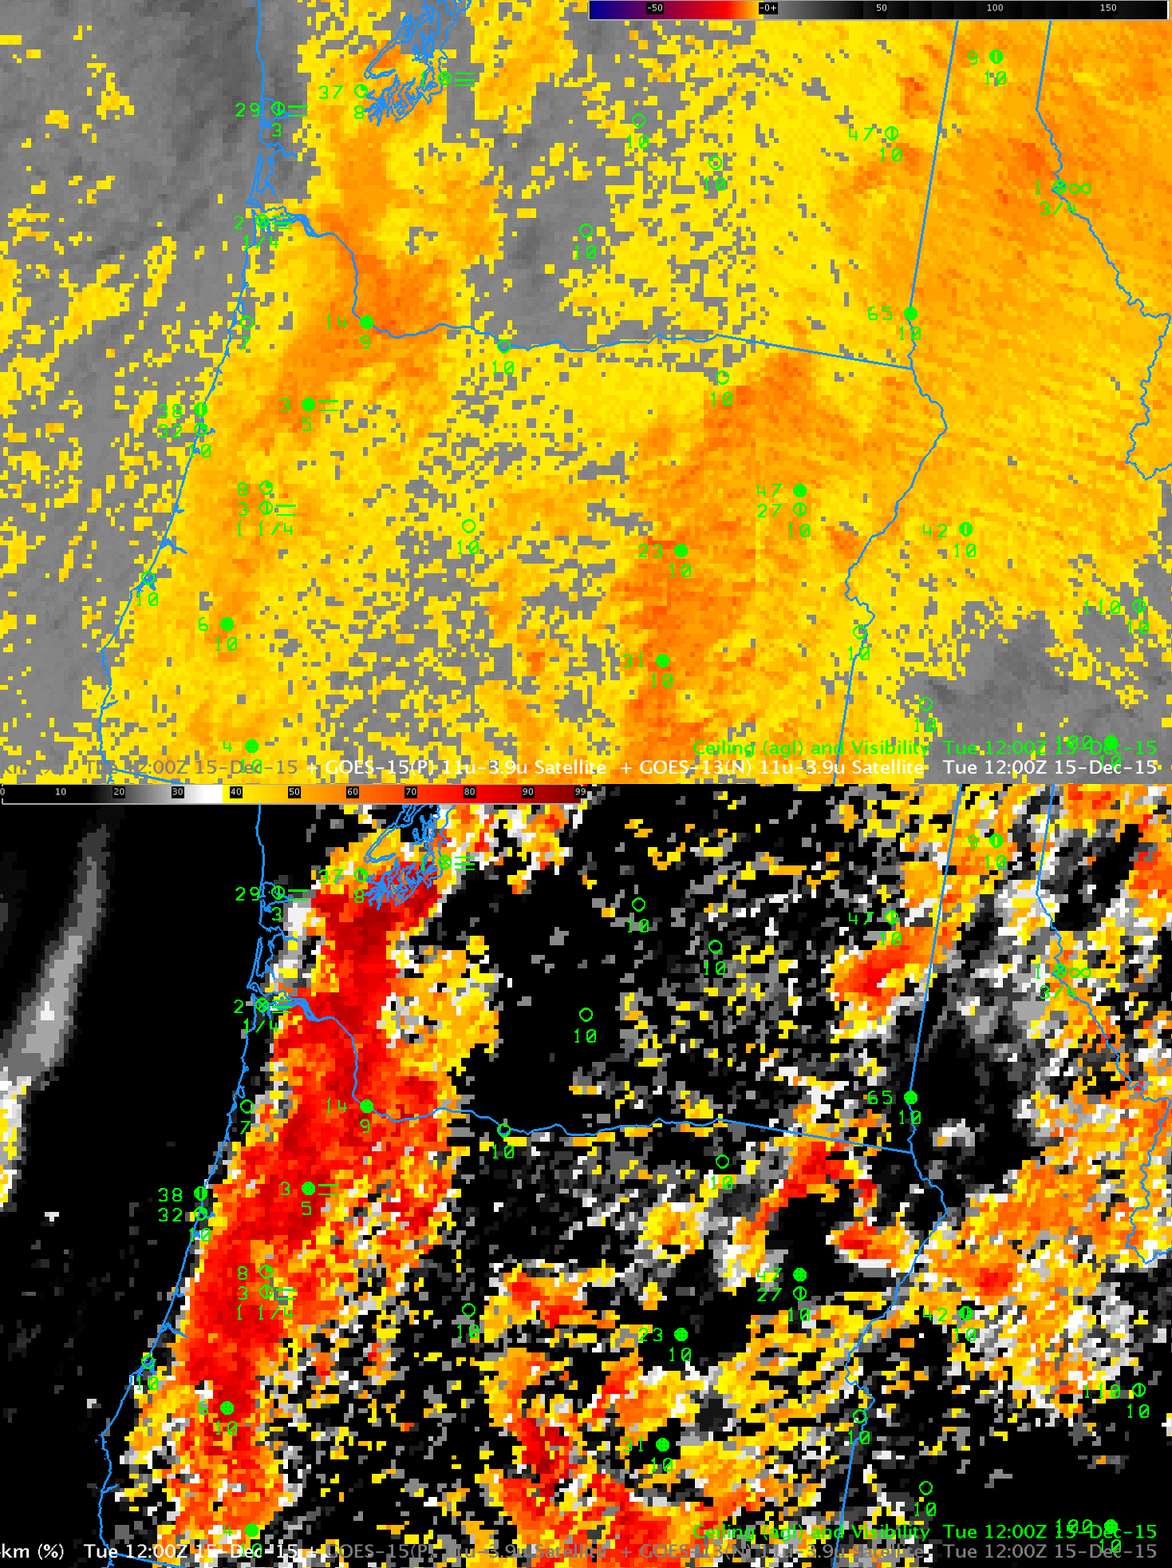
GOESIFRP_BTD_15December2015_1200UTCtoggle

As above, but at 1200 UTC 15 December 2015 (click to enlarge)

Toggles from 1200 UTC (above) and 1400 UTC (below) continue to show IFR Conditions mostly confined to regions near the Willamette Valley in eastern Oregon — banked up against the higher terrain to the east of the Willamette, and also over the higher terrain of northeastern Oregon (Click here for a toggle between the 1400 UTC IFR Probability field and Topography). IFR Conditions are a function of ceilings above ground (not above Mean Sea Level), so it’s important to recognize the influence of topographic features on an IFR Probability field. Fog/Low stratus can bank up against a topographic feature, and/or it can shroud the top of a topographic feature.

Note also how at 1400 UTC high clouds have impinged upon extreme northwest Oregon and coastal western Washington. In these regions IFR conditions nevertheless persist under the high clouds, but satellite data alone does not indicate low cloudiness. In this region, the inclusion of Rapid Refresh data in the GOES-R IFR Probability algorithm allows the IFR Probability field to continue to provide useful information about the presence of fog/low stratus.

GOESIFRP_BTD_15December2015_1400UTCtoggle

As above, but at 1400 UTC 15 December 2015 (click to enlarge)

MODIS and Suomi NPP afforded high-resolution images of the fog/stratus banks over the Pacific Northwest on 15 December. The brightness temperature difference fields and MODIS-based IFR Probability fields from MODIS at 0533 and 0945 UTC, below, support the observations from the coarser-resolution GOES fields above.
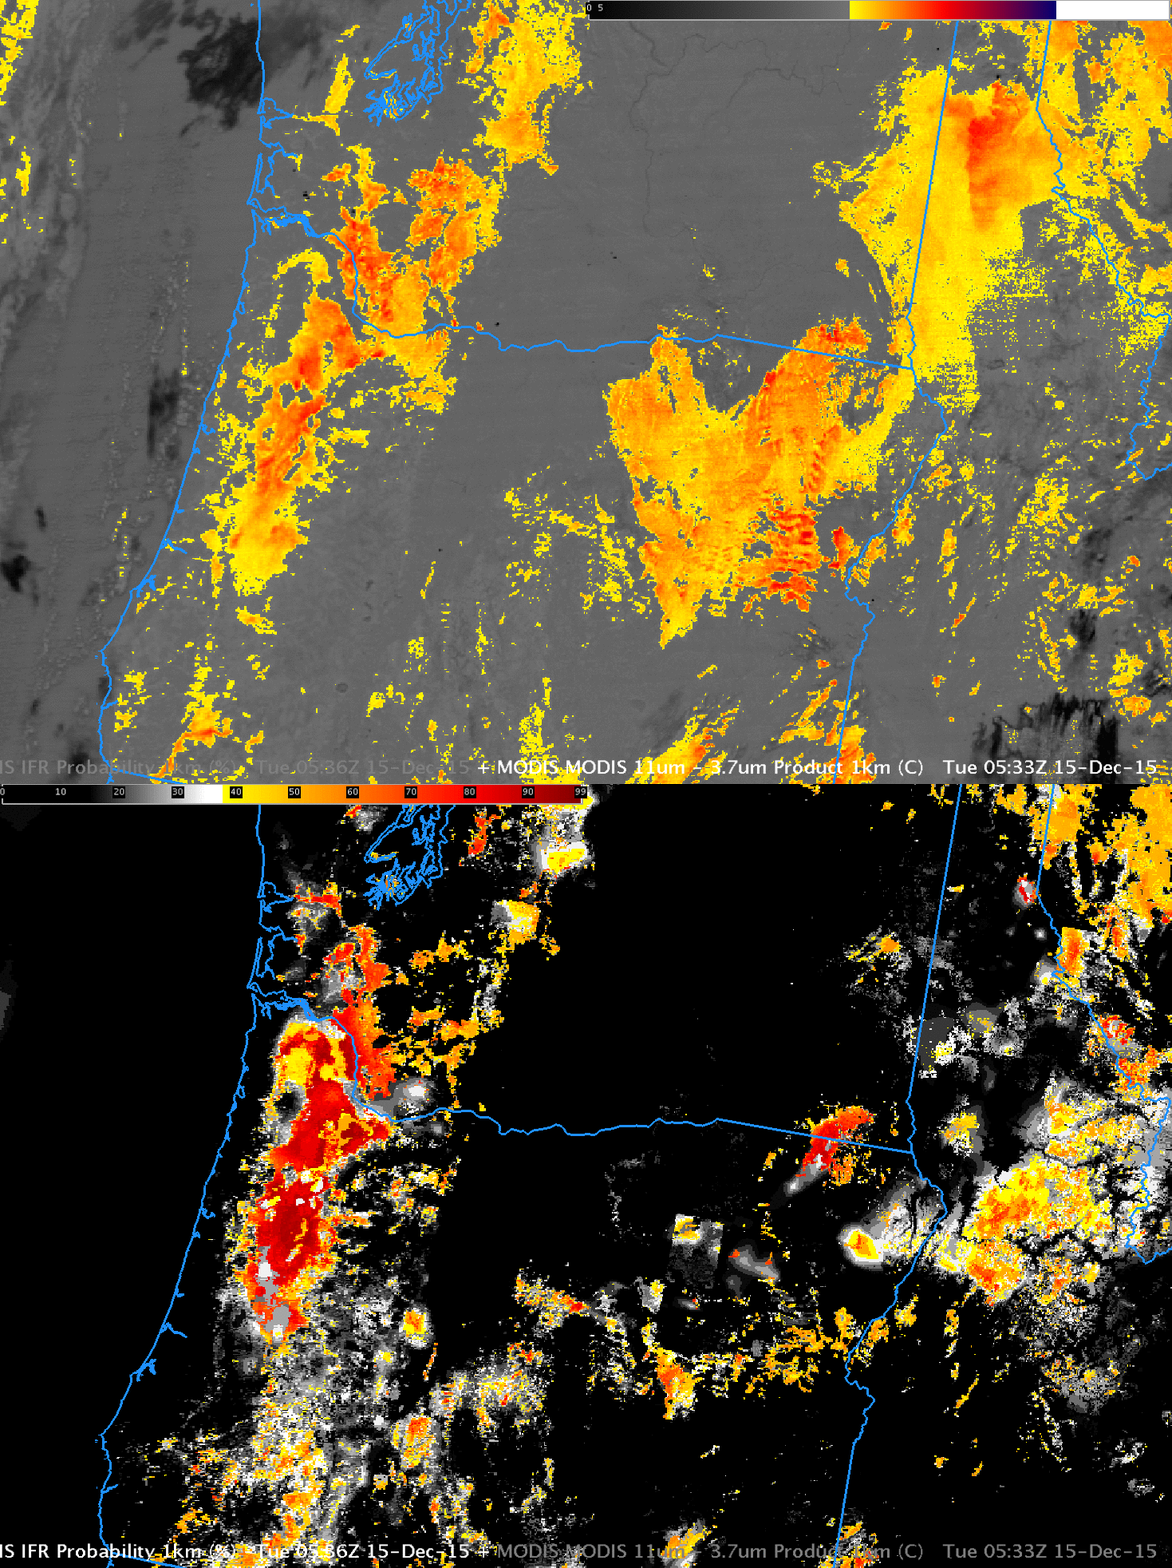
MODISIFRP_BTD_15December2015_0533UTCtoggle

As above, but for MODIS data at 0533 UTC 15 December 2015 (click to enlarge)
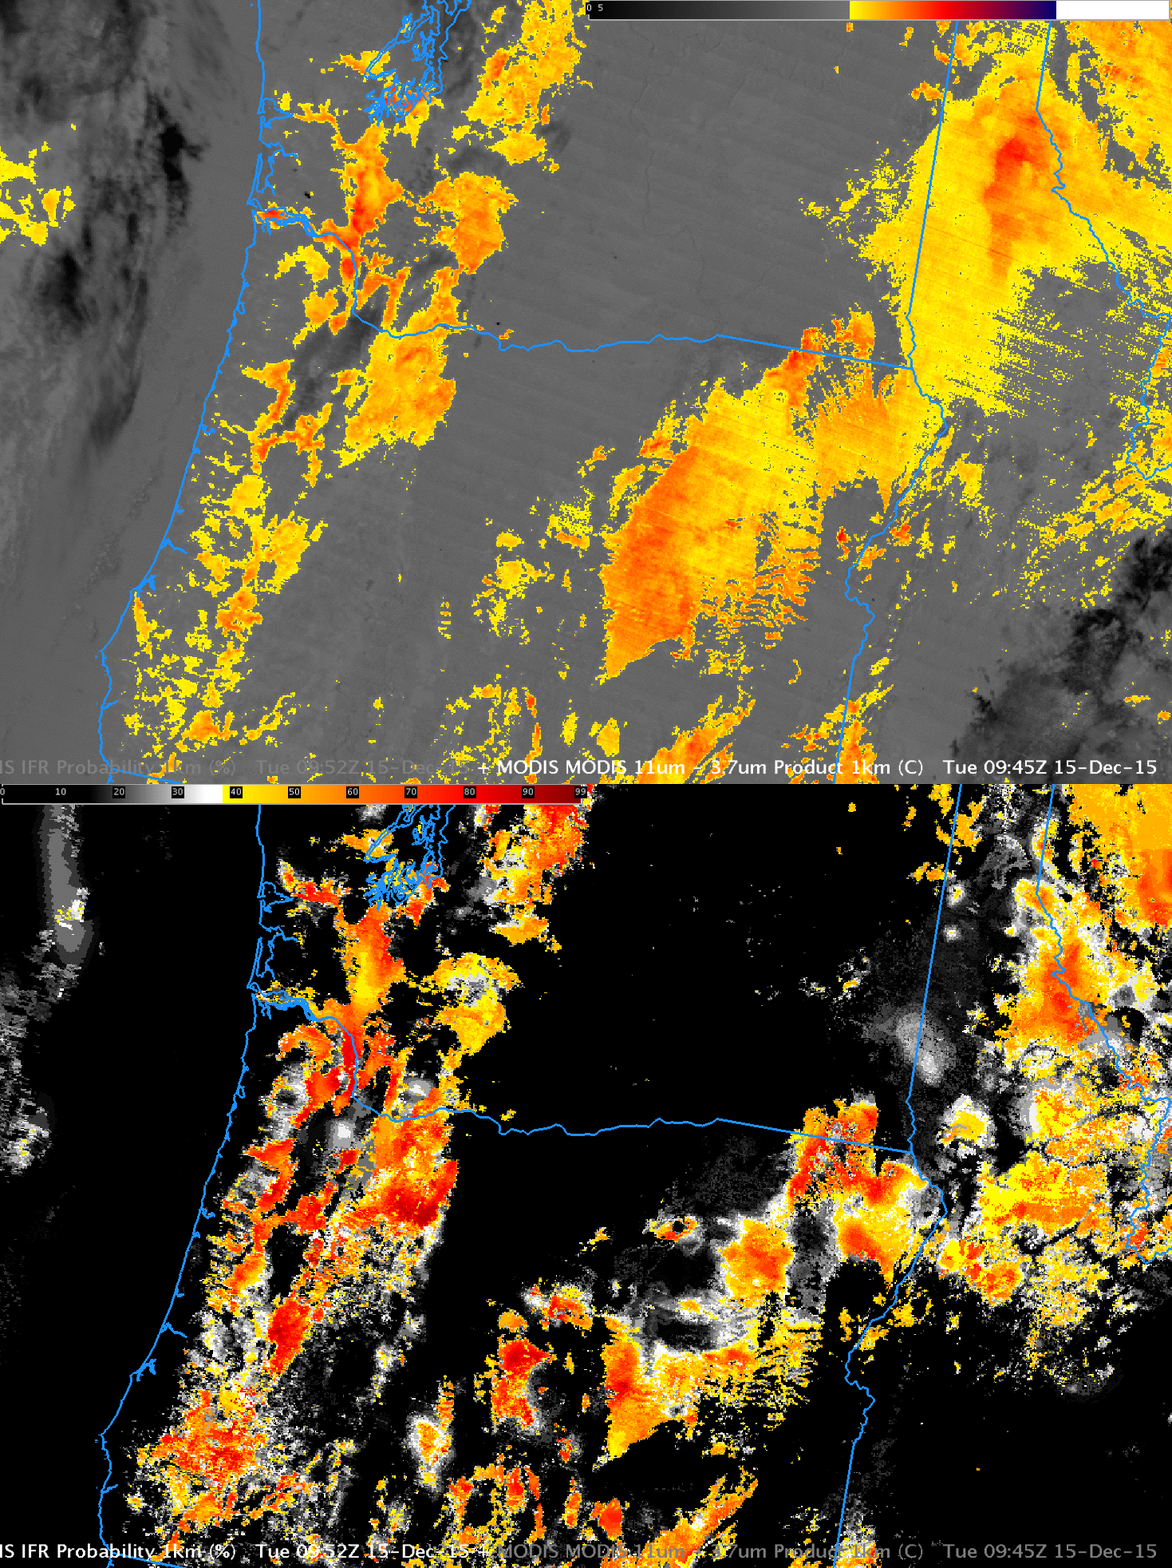
MODISIFRP_BTD_15December2015_0945UTCtoggle

As above, but for MODIS data at 0945 UTC 15 December 2015 (click to enlarge)

GOES-R IFR Probability fields are not yet computed using data from the Suomi NPP Satellite, but the Day Night band and the Brightness Temperature Difference field give information about the presence of cloudiness. For the case of Suomi NPP data, however, it’s more important to consider surface-based observations to confirm regions of low clouds/fog or mid-level stratus. Note also that December 15 was shortly after a New Moon, and the crescent moon that could give illumination was below the horizon (that is, it had set) at 0918 and 1059 UTC.

Note that Suomi NPP Near-Constant Contrast Day Night Band imagery was scheduled to start flowing in to AWIPS II on 14 December 2015 via the SBN. It should be available in NWS offices now.
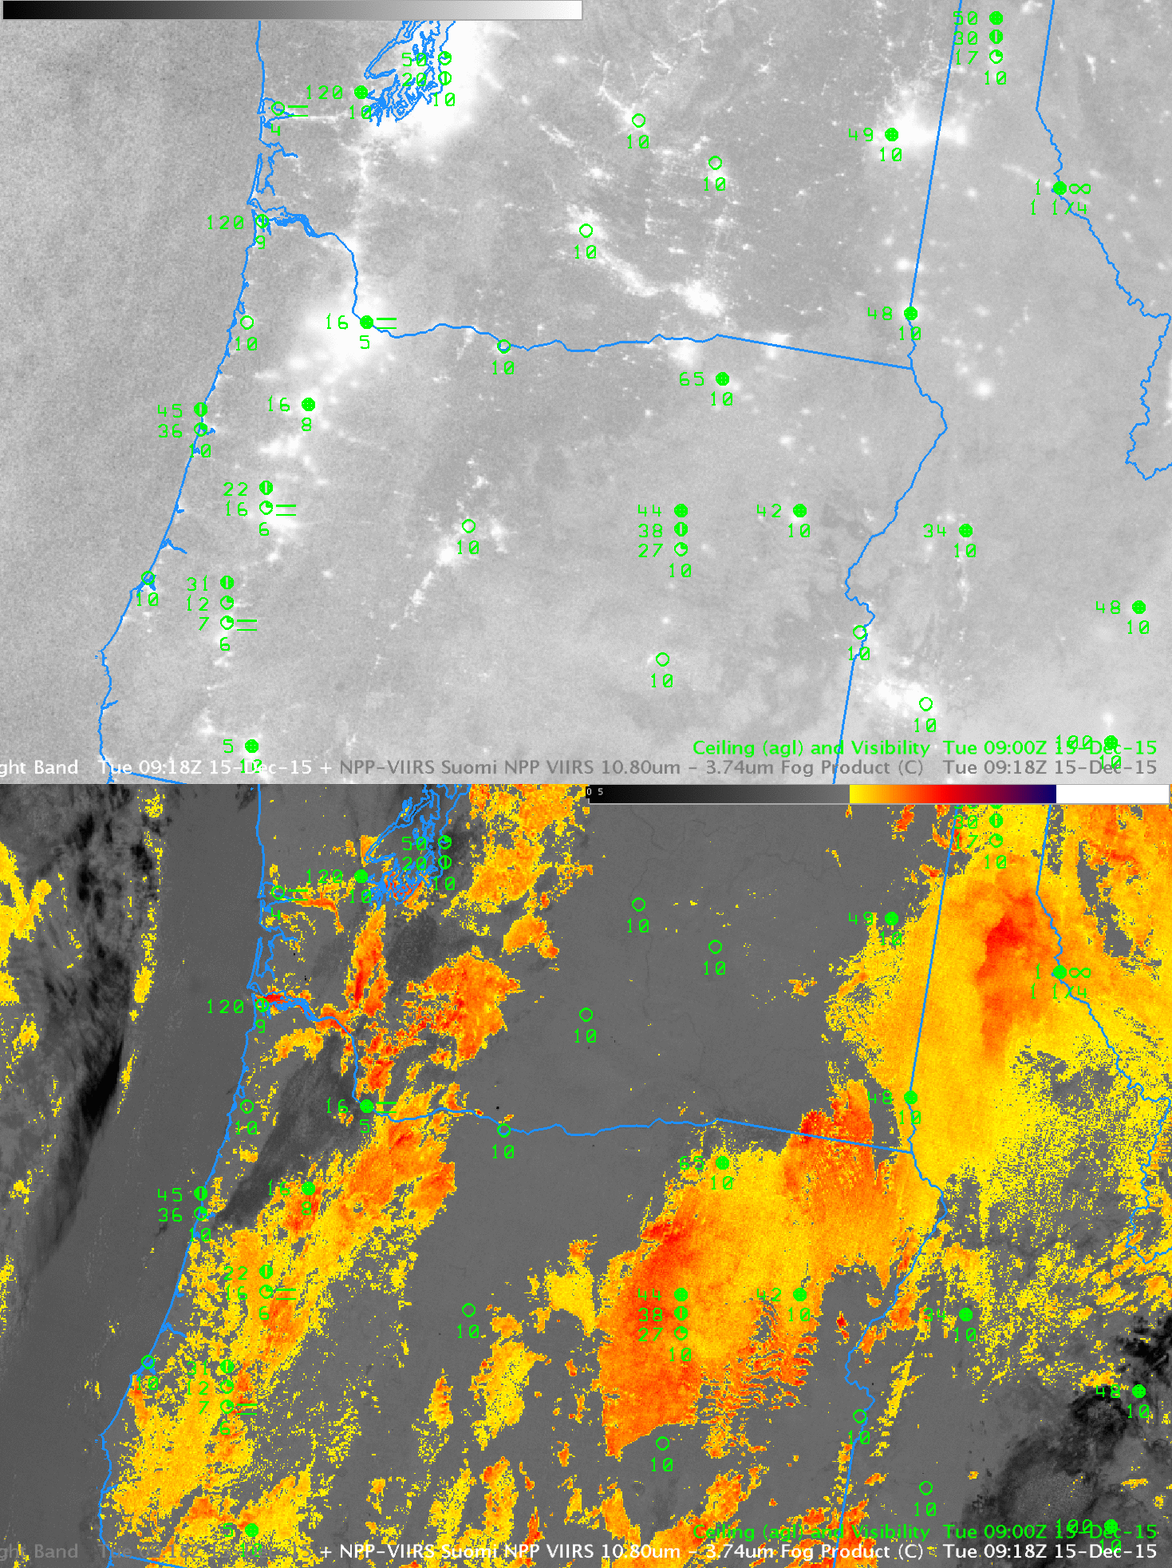
SNPPBTD_DNB_15December2015_0918UTCtoggle

Suomi NPP Day Night Band Visible Imagery (0.70 µm) and Brightness Temperature Difference (10.35 µm – 3.74 µm), 0918 UTC 15 December 2015 (Click to enlarge)
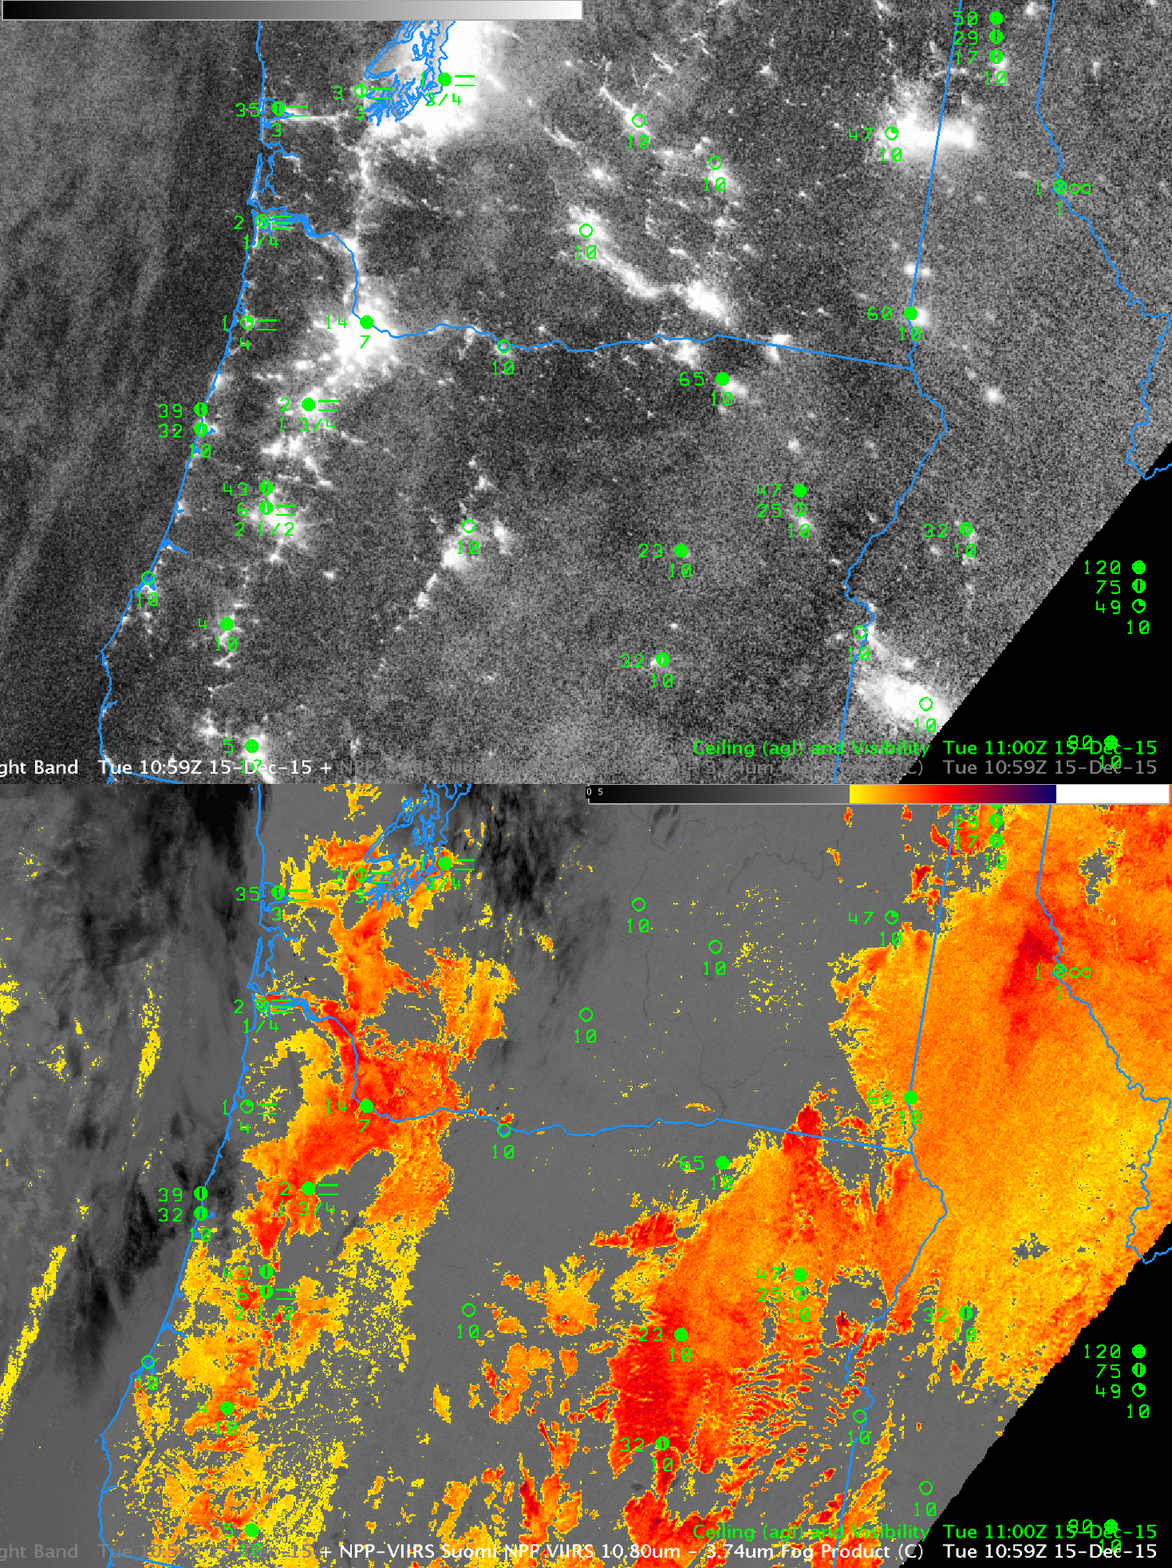
SNPPBTD_DNB_15December2015_1059UTCtoggle

Suomi NPP Day Night Band Visible Imagery (0.70 µm) and Brightness Temperature Difference (10.35 µm – 3.74 µm), 1059 UTC 15 December 2015 (Click to enlarge)

Dense Fog over New England

GOES13_BTD_11dec2015animg

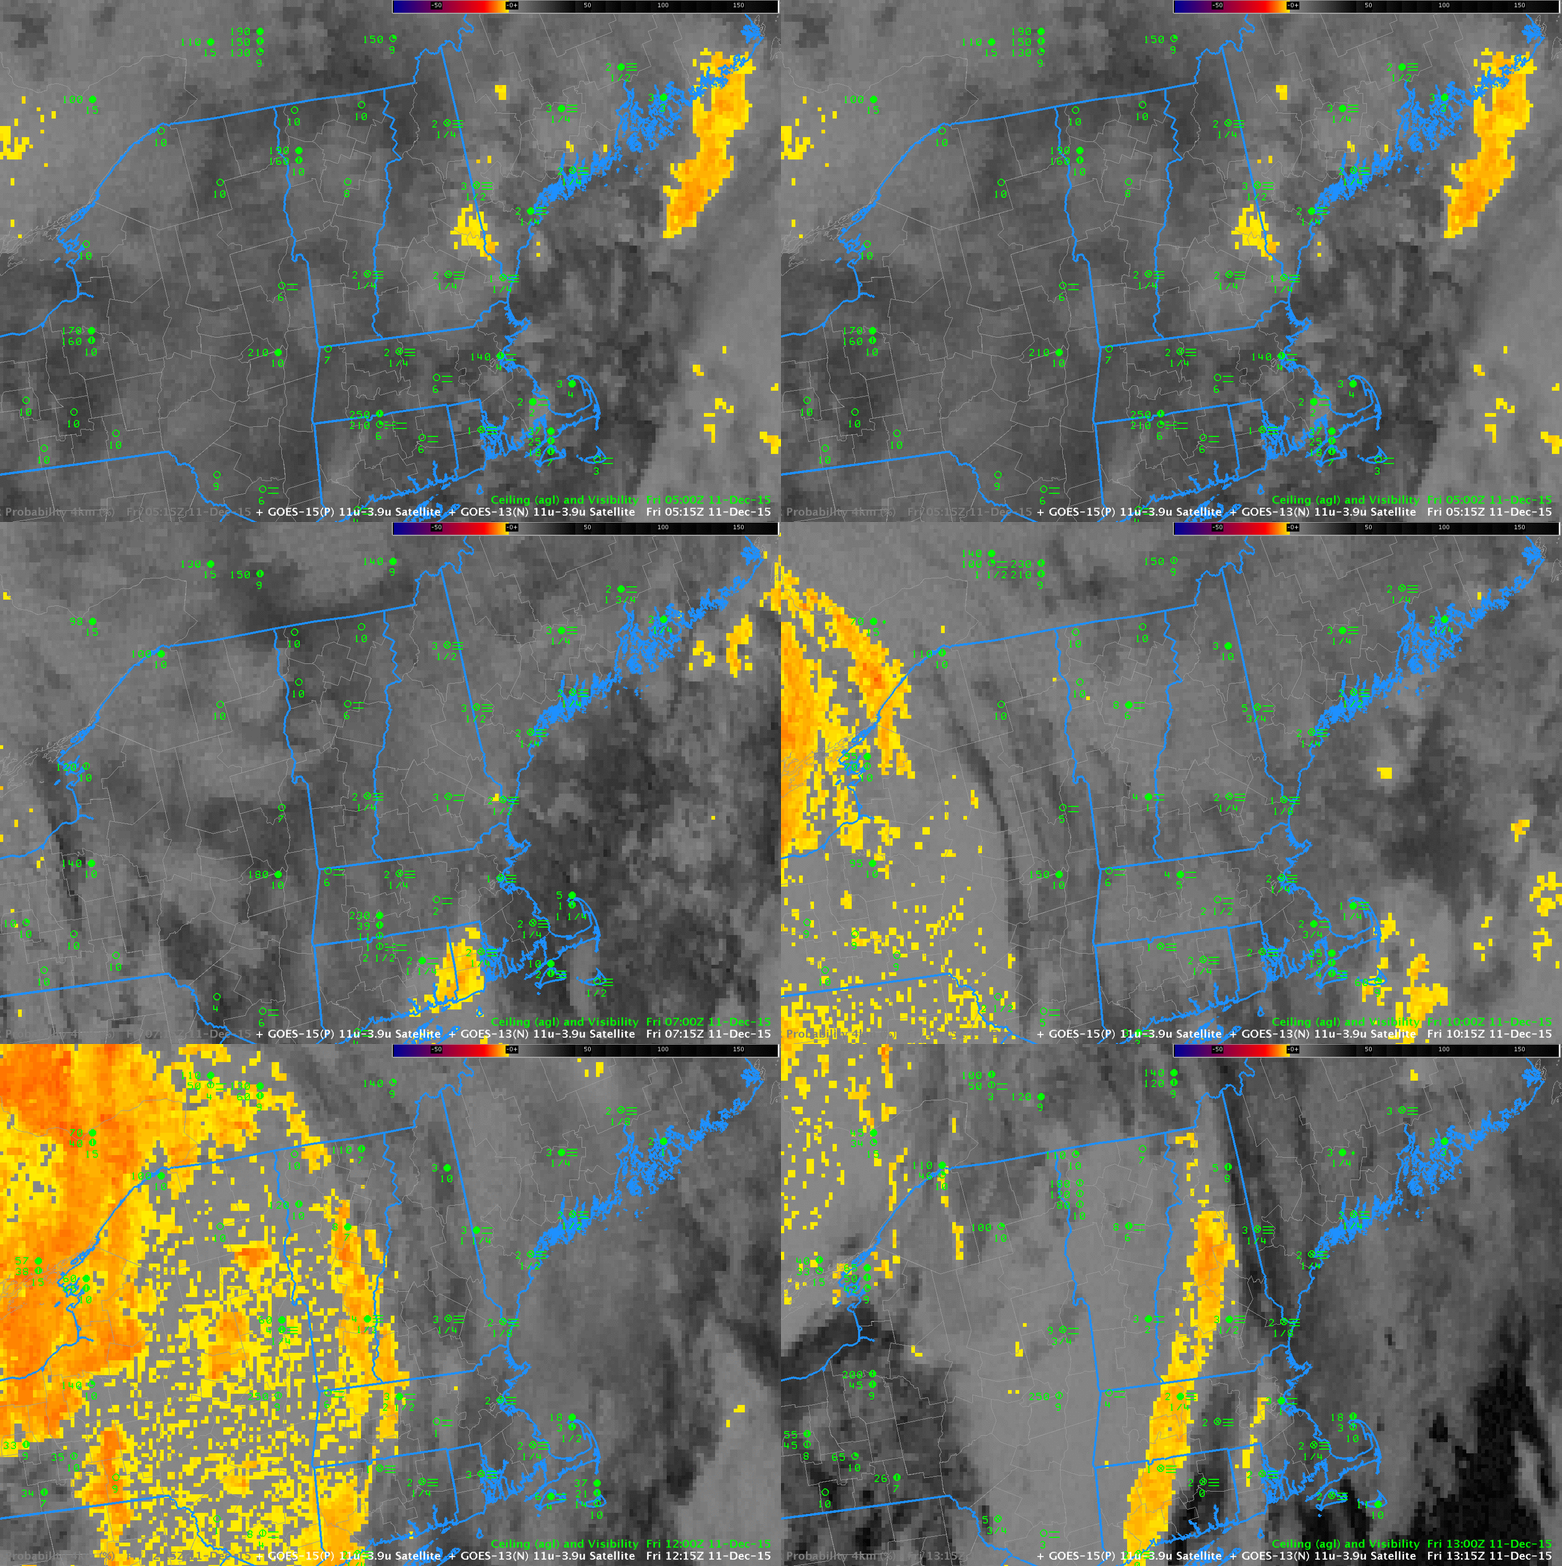
GOES-13 Brightness Temperature Difference Fields (10.7 µm – 3.9 µm), hourly from 0515 through 1315 UTC 11 December 2015 (Click to enlarge)

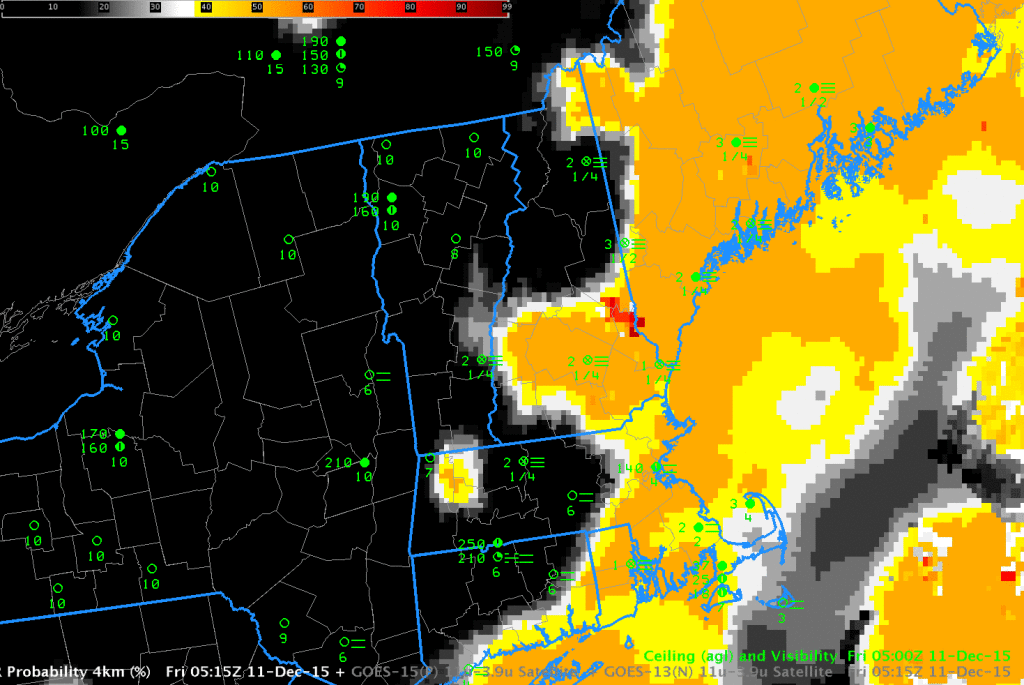
The brightness temperature difference field (10.7 µm – 3.9 µm), above, over New England during the morning of 11 December 2015 shows extensive cirrus cloud cover (a hole in the high clouds moves over Southern New England just before sunrise). Surface observations of ceilings and visibility show widespread IFR conditions, yet cirrus and mid-level clouds prevent a diagnosis of the low clouds.

GOES-R IFR Probability fields for the same times, below, do show a strong signal (that is, higher probability of IFR conditions) in regions where IFR conditions are observed or where they have recently developed.  Because GOES-R IFR Probability fields incorporate information from the Rapid Refresh about low-level saturation.  Even if clouds decks obscure the view of near-surface clouds, as in this case, GOES-R IFR Probability fields, because they fuse together satellite data and surface information from the Rapid Refresh model, can provide useful information.

GOES13_IFR_11dec2015anim

GOES-R IFR Probability Fields, hourly from 0515 through 1315 UTC 11 December 2015 (Click to enlarge)

Central Valley Fog under High Clouds

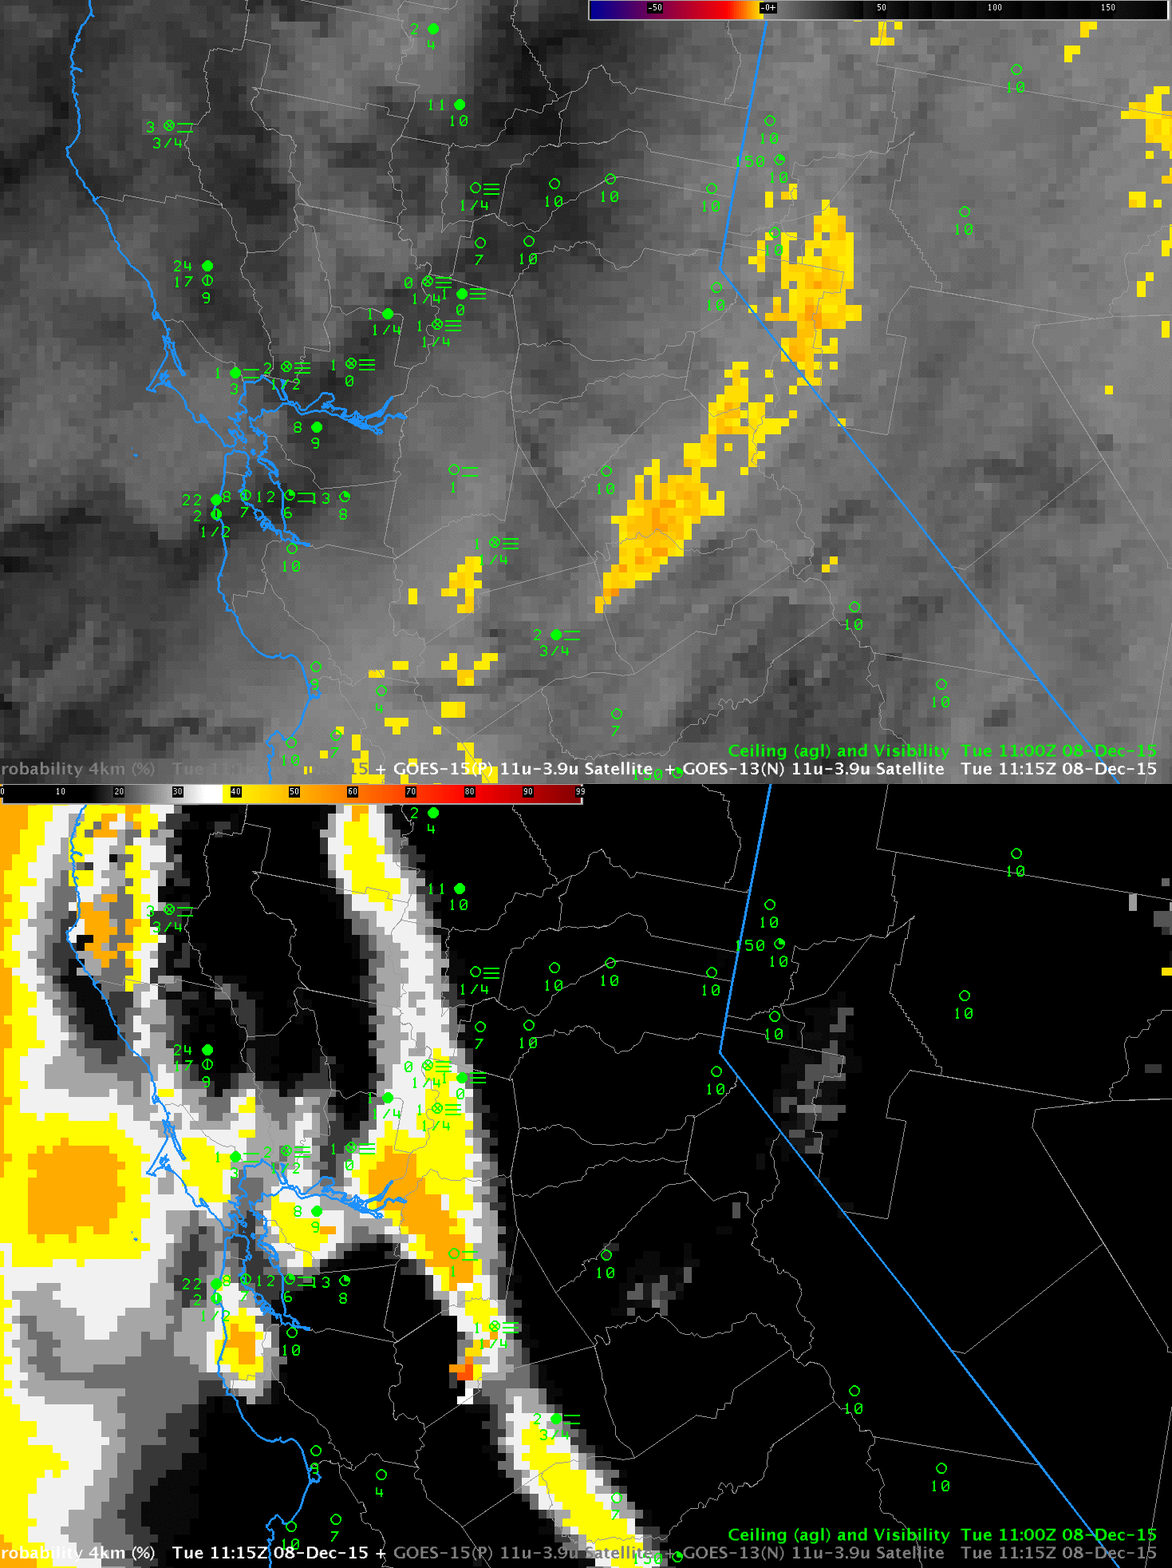
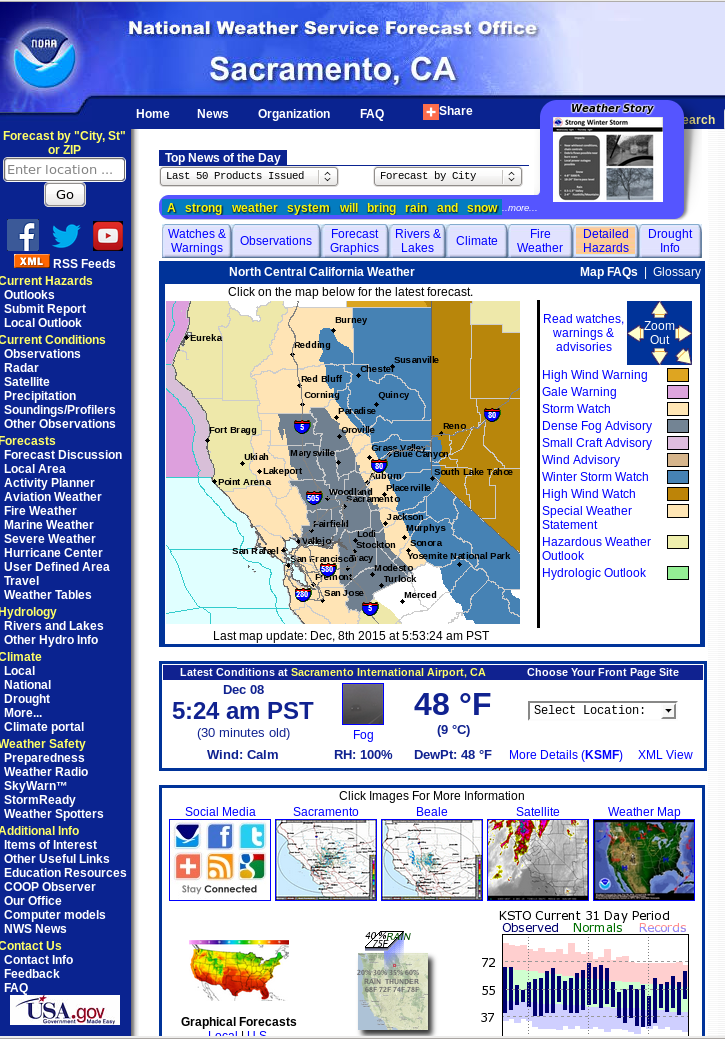
A potent storm in the Gulf of Alaska (Link to surface map) is allowing high clouds to spread inland over much of the west coast of the United States. Dense fog has formed underneath that cloud deck in the California’s Central Valley, and advisories have been issued (Scroll down to see the screen-grab of the NWS Sacramento Office Website). How can satellite products be used to detect such a fog that is hidden by high clouds?

The toggle below shows the GOES-15 Brightness Temperature Difference fields (with a pattern characteristic of mostly high (ice) clouds with a few breaks in the high cloud allowing the satellite to view lower water-based clouds) and the GOES-R IFR Probability field.  IFR Probability is correctly alerting any forecaster to the probability that IFR conditions are occurring in the Central Valley.  IFR Probability fuses information from the Satellite (not particularly helpful in this case) and information from the Rapid Refresh Model predictions of low-level saturation.  The Rapid Refresh is correctly diagnosing the presence of saturation, and IFR Probabilities are enhanced over the Central Valley.

BTD_GOESIFR_1115_08dec2015toggle

GOES-15 Brightness Temperature Difference and GOES-R IFR Probability fields, 1115 UTC on 8 December 2015 (Click to enlarge)

SacramentoNWS

A Blend of Fog and Stratus over the Midwest

GOESIFRP_BTD_0200_04Dec2015toggle

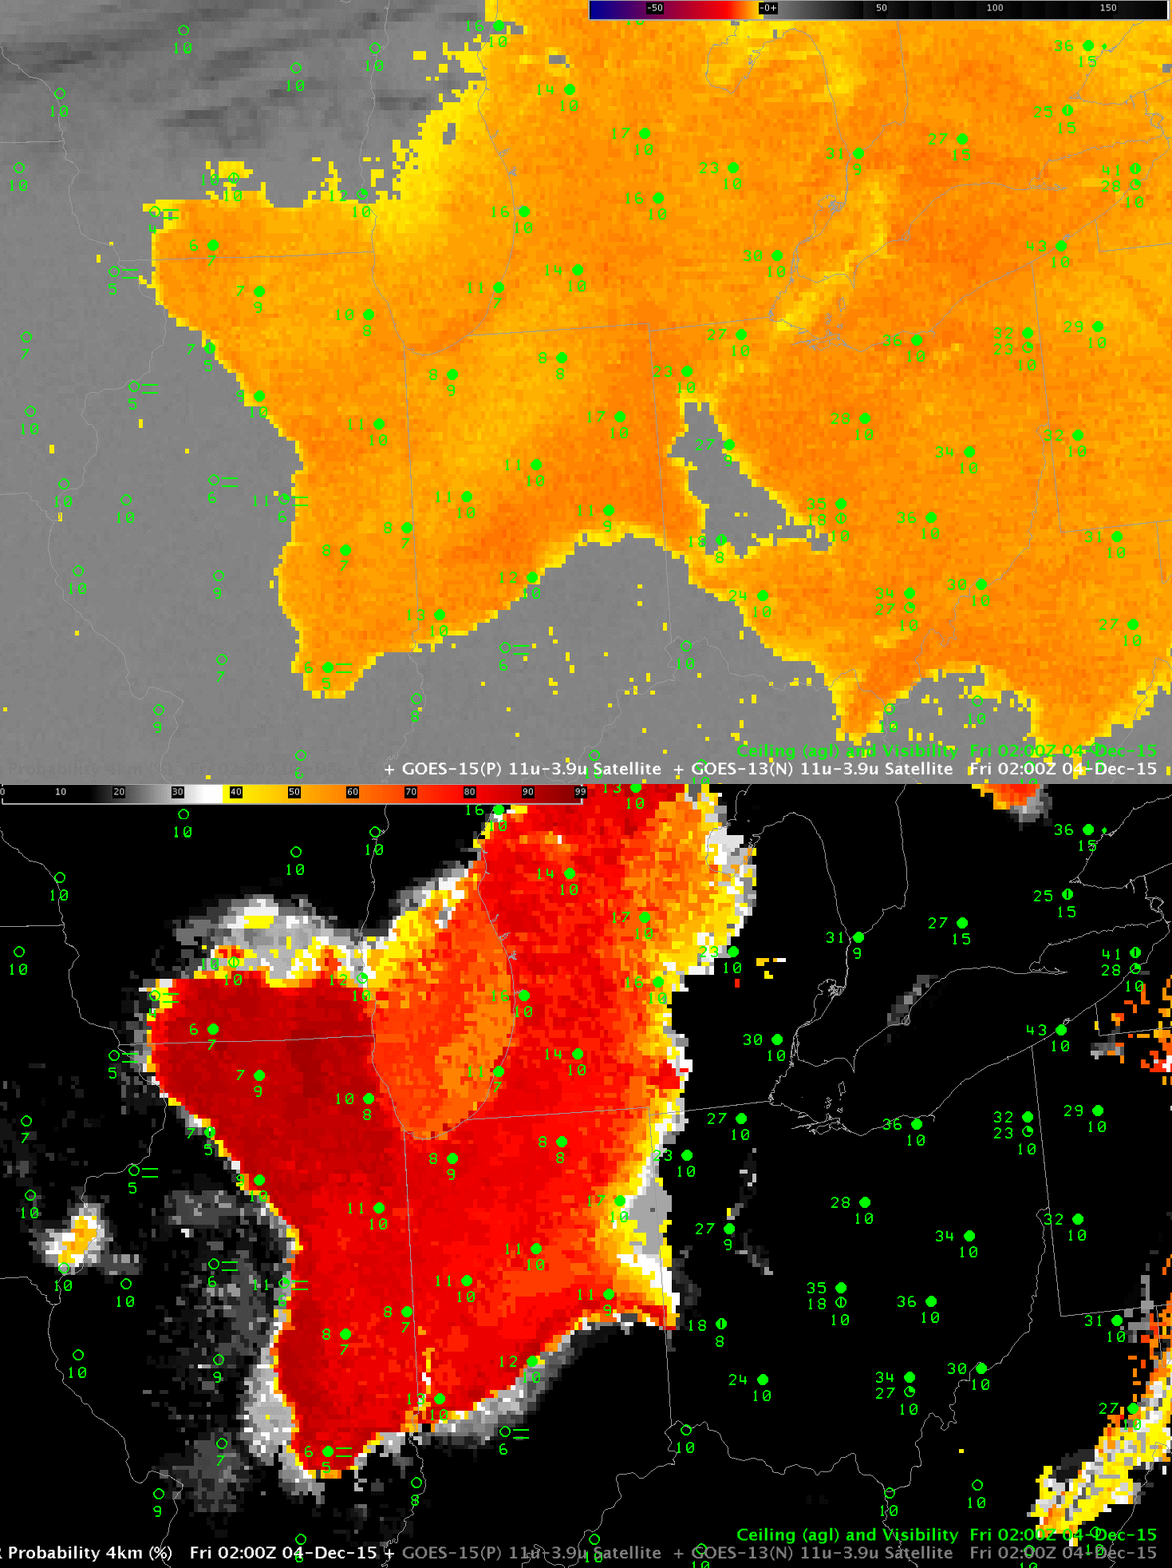
GOES-13 Brightness Temperature Difference (10.7 µm – 3.9 µm) fields (color enhanced) and GOES-R IFR Probability fields, and surface observations of ceilings and visibilities, 0200 UTC on 4 December 2015 (Click to enlarge)

Consider the toggle above between GOES-13 Brightness Temperature Difference and GOES-R IFR Probability fields at 0200 UTC on 4 December over the Midwest. (A surface map from 1200 UTC on 4 December shows High Pressure stretched across Ohio and Indiana). IFR Conditions are not reported over Ohio, Indiana or Illinois above. Would you expect them to form? And where? The GOES-R IFR Probability product is distinguishing between low stratus (not quite fog) over Indiana/Illinois and mid-level stratus over Ohio. How do things evolve through the night?

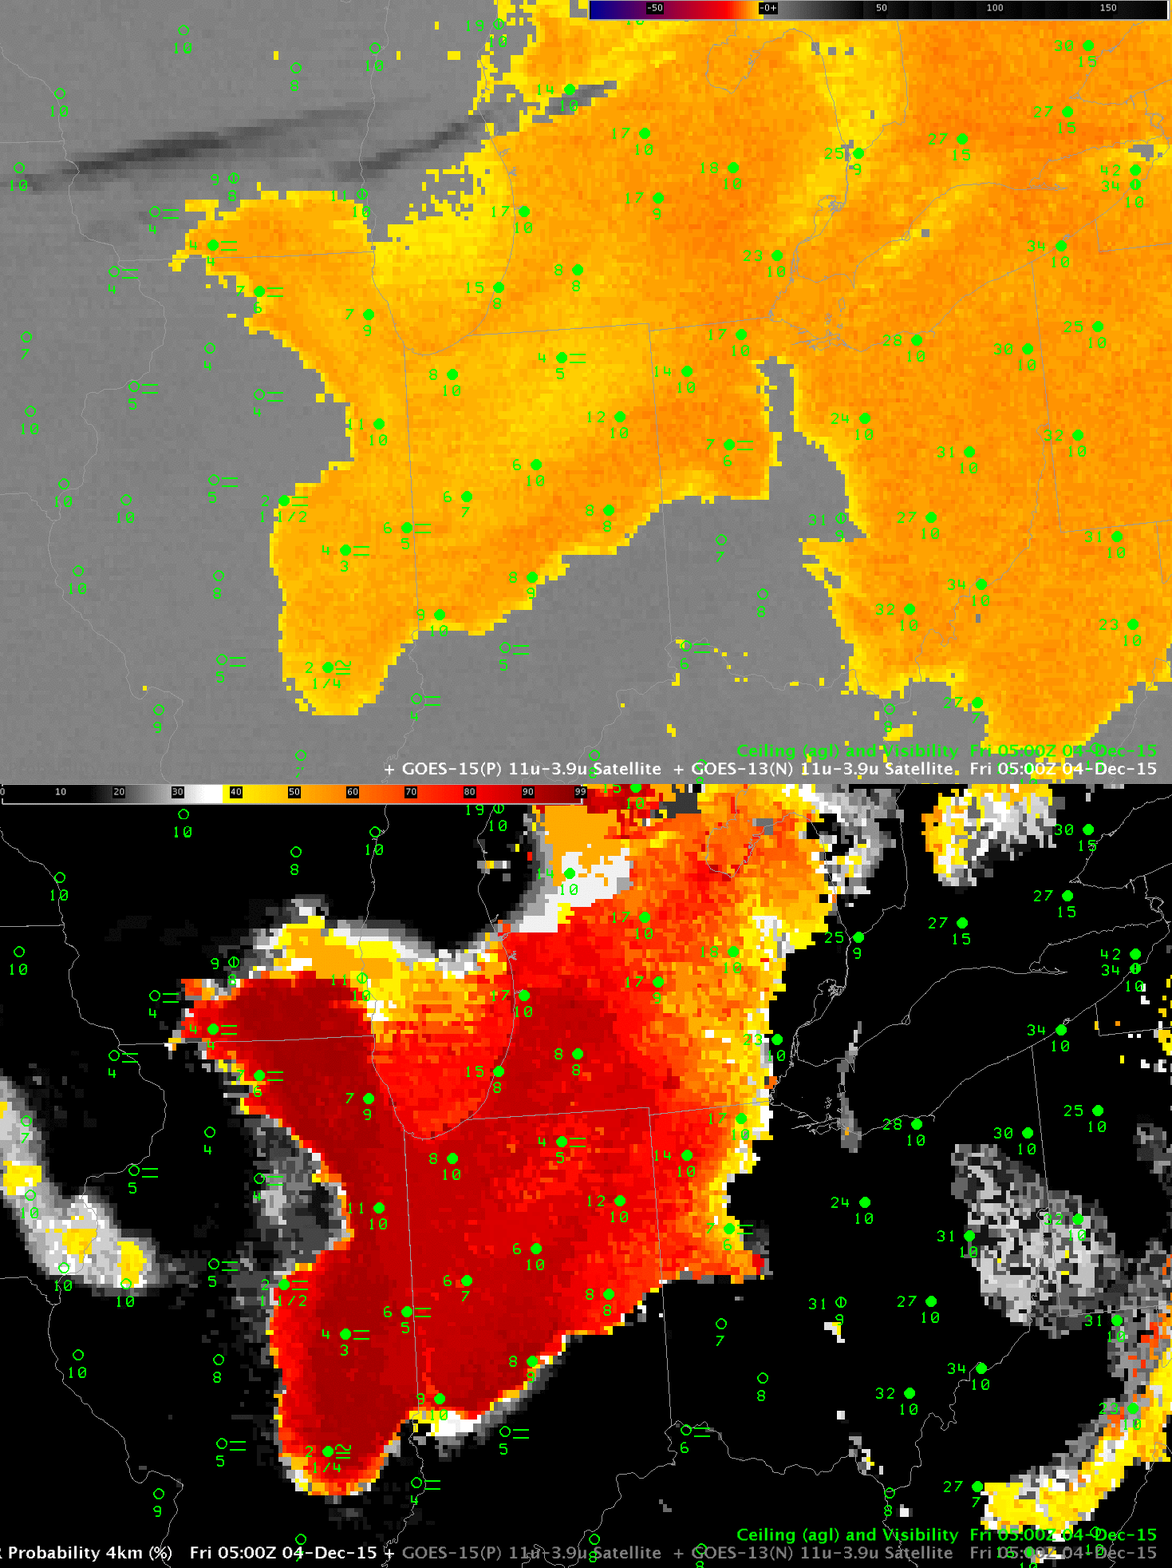
GOESIFRP_BTD_0500_04Dec2015toggle

GOES-13 Brightness Temperature Difference (10.7 µm – 3.9 µm) fields (color enhanced) and GOES-R IFR Probability fields, and surface observations of ceilings and visibilities, 0500 UTC on 4 December 2015 (Click to enlarge)

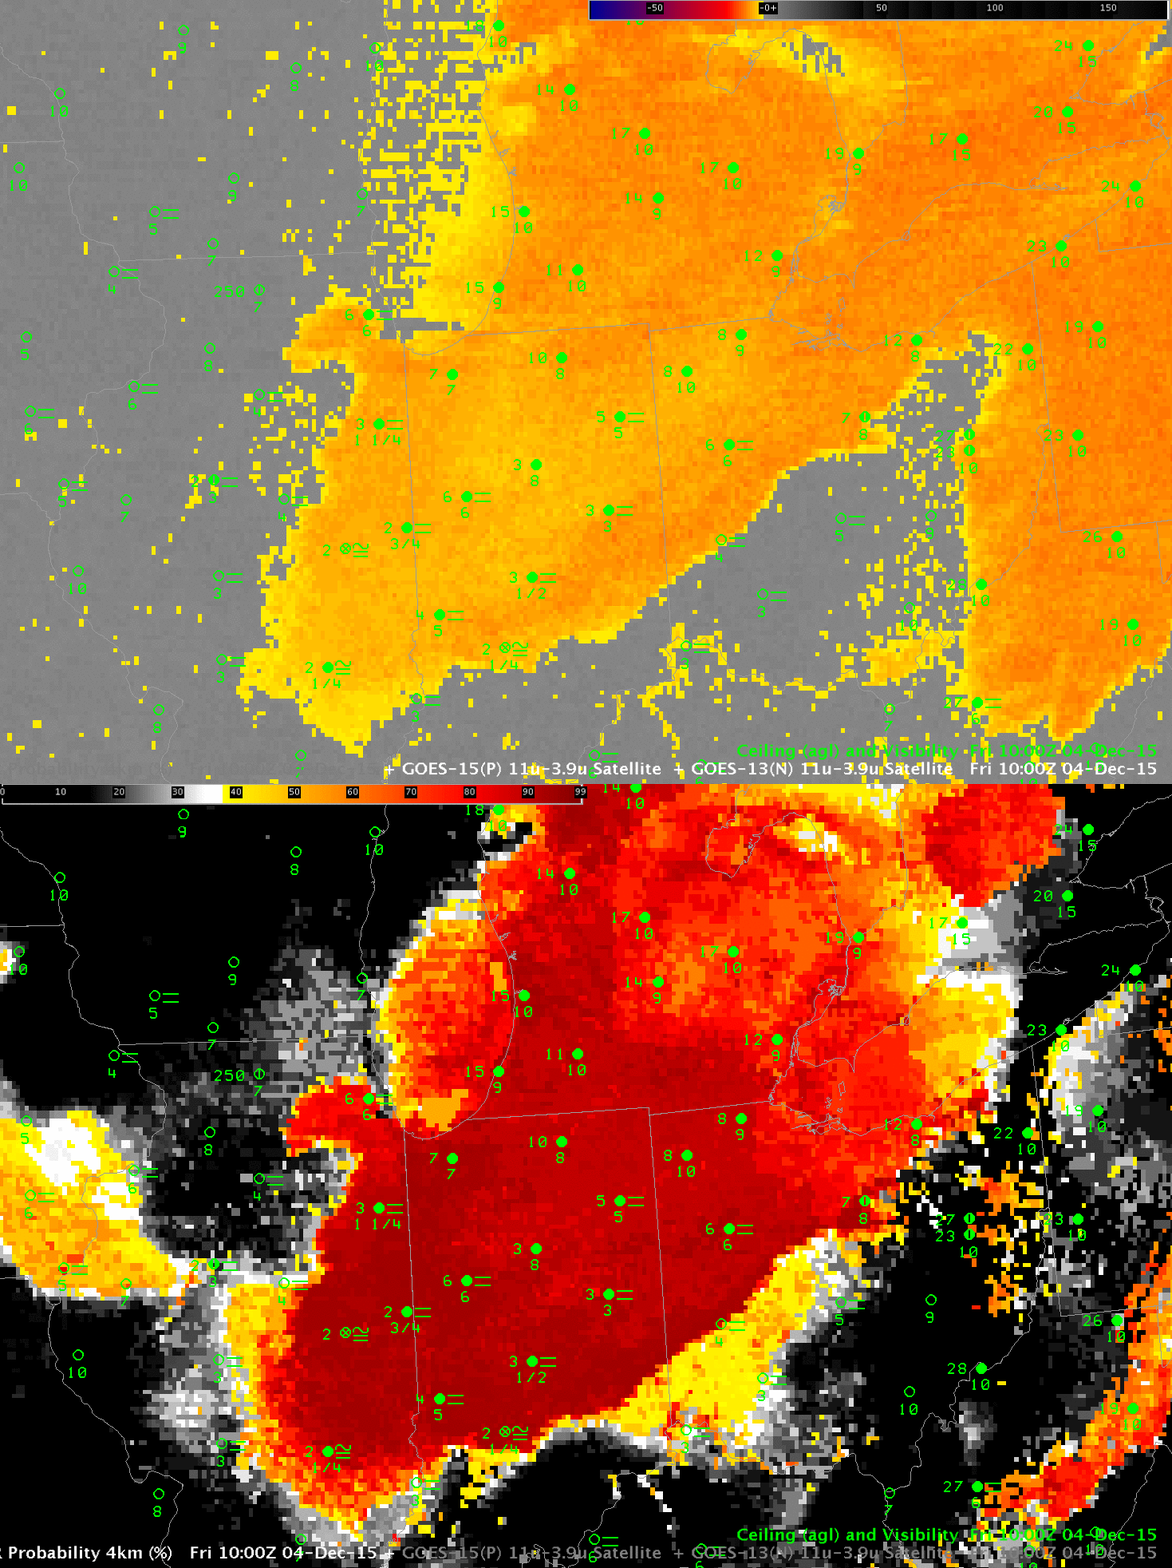
The 0500 UTC image, above, shows IFR conditions reports over south-central Illinois as ceilings lower and visibility degrades under the High Pressure System.  By 1000 UTC, below, the IFR Conditions over Illinois are more widespread and near-IFR conditions are present over much of Indiana.  Meanwhile, in Ohio, mid-level stratus continues.

GOESIFRP_BTD_1000_04Dec2015toggle

GOES-13 Brightness Temperature Difference (10.7 µm – 3.9 µm) fields (color enhanced) and GOES-R IFR Probability fields, and surface observations of ceilings and visibilities, 1000 UTC on 4 December 2015 (Click to enlarge)

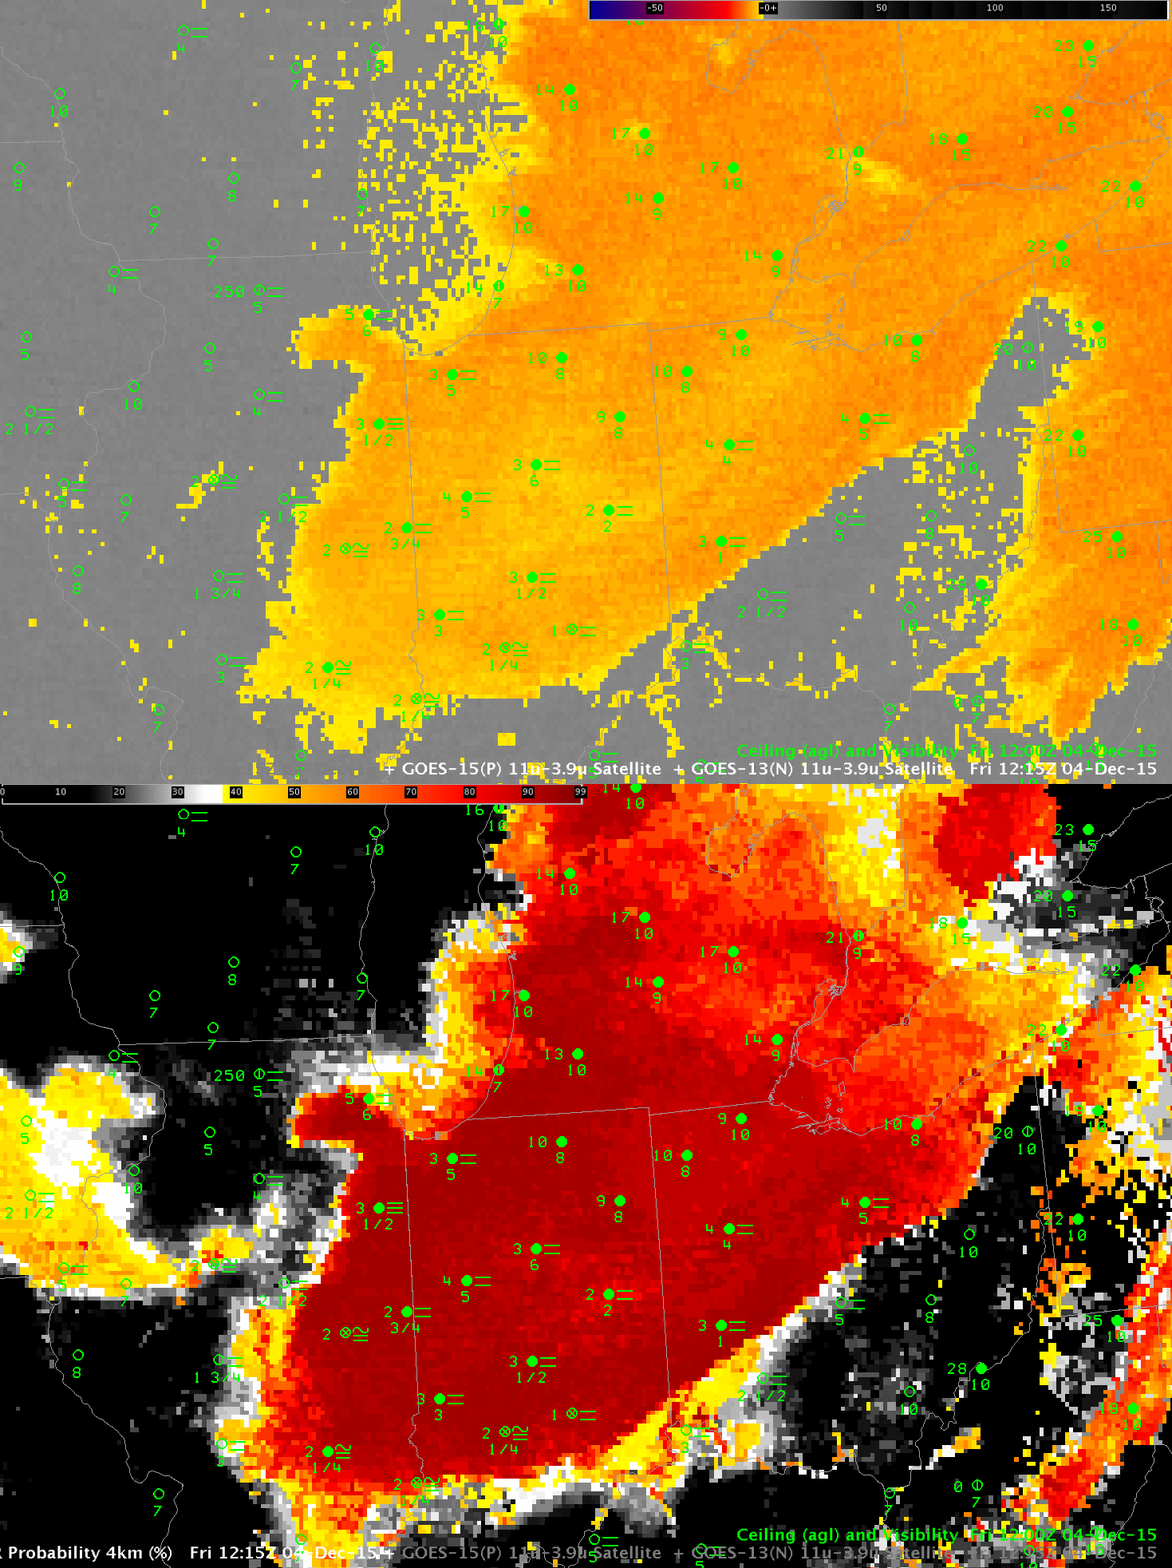
GOESIFRP_BTD_1215_04Dec2015toggle

GOES-13 Brightness Temperature Difference (10.7 µm – 3.9 µm) fields (color enhanced) and GOES-R IFR Probability fields, and surface observations of ceilings and visibilities, 1215 UTC on 4 December 2015 (Click to enlarge)

By 1215 UTC, IFR conditions have developed over Indiana just before sunrise. Note also the development of IFR conditions along the Ohio River, and that low ceilings did not develop in Michigan (despite the high IFR Probabilities) where winds never relaxed. Use the IFR Probability fields in concert with other observations to make a nearcast/forecast. This case is a good example of using IFR Probabilities as an alert to where IFR conditions may be developing (in addition to the discrimination between low stratus/fog and mid-level fog that is frequently discussed on this blog). IFR Probability can be interpreted as a probability that IFR conditions exist at present or will be existing presently.