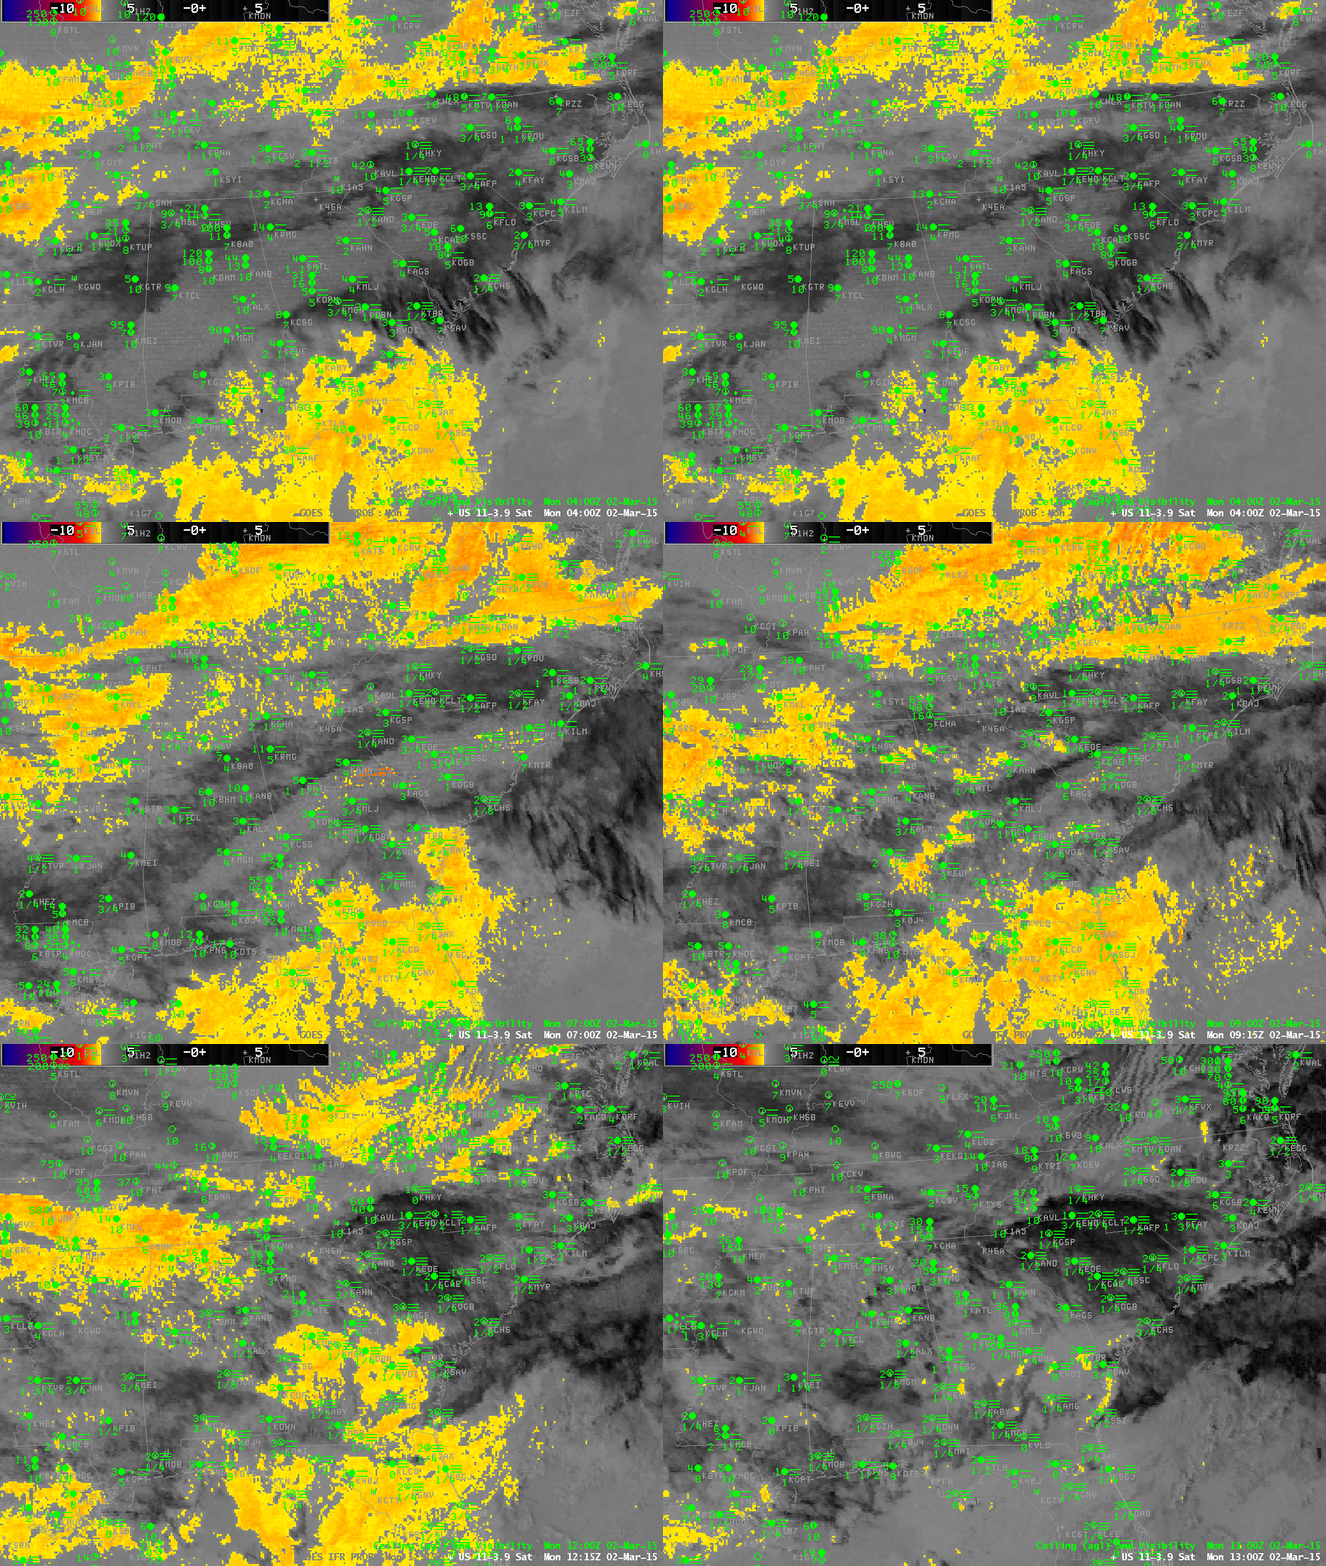
Brightness Temperature Difference Fields (10.7µm – 3.9µm) from GOES-East, hourly from 0400-1300 UTC on 2 March 2015 (Click to enlarge)
A series of frontal systems along the east coast caused multiple cloud layers and IFR conditions over much of the deep south and piedmont from Mississippi to Georgia and up through Virginia overnight on 1-2 March 2015. The animation of Brightness Temperature Difference (10.7µm – 3.9µm), above, is testimony to the difficulty in using that product as a fog detection device when multiple cloud layers are present: Many stations underneath cirrus show IFR Conditions. (Note also how the signal changes at 1300 UTC — the end of the animation — as the sun rises and increasing amounts of 3.9µm solar radiation is reflected off the clouds).
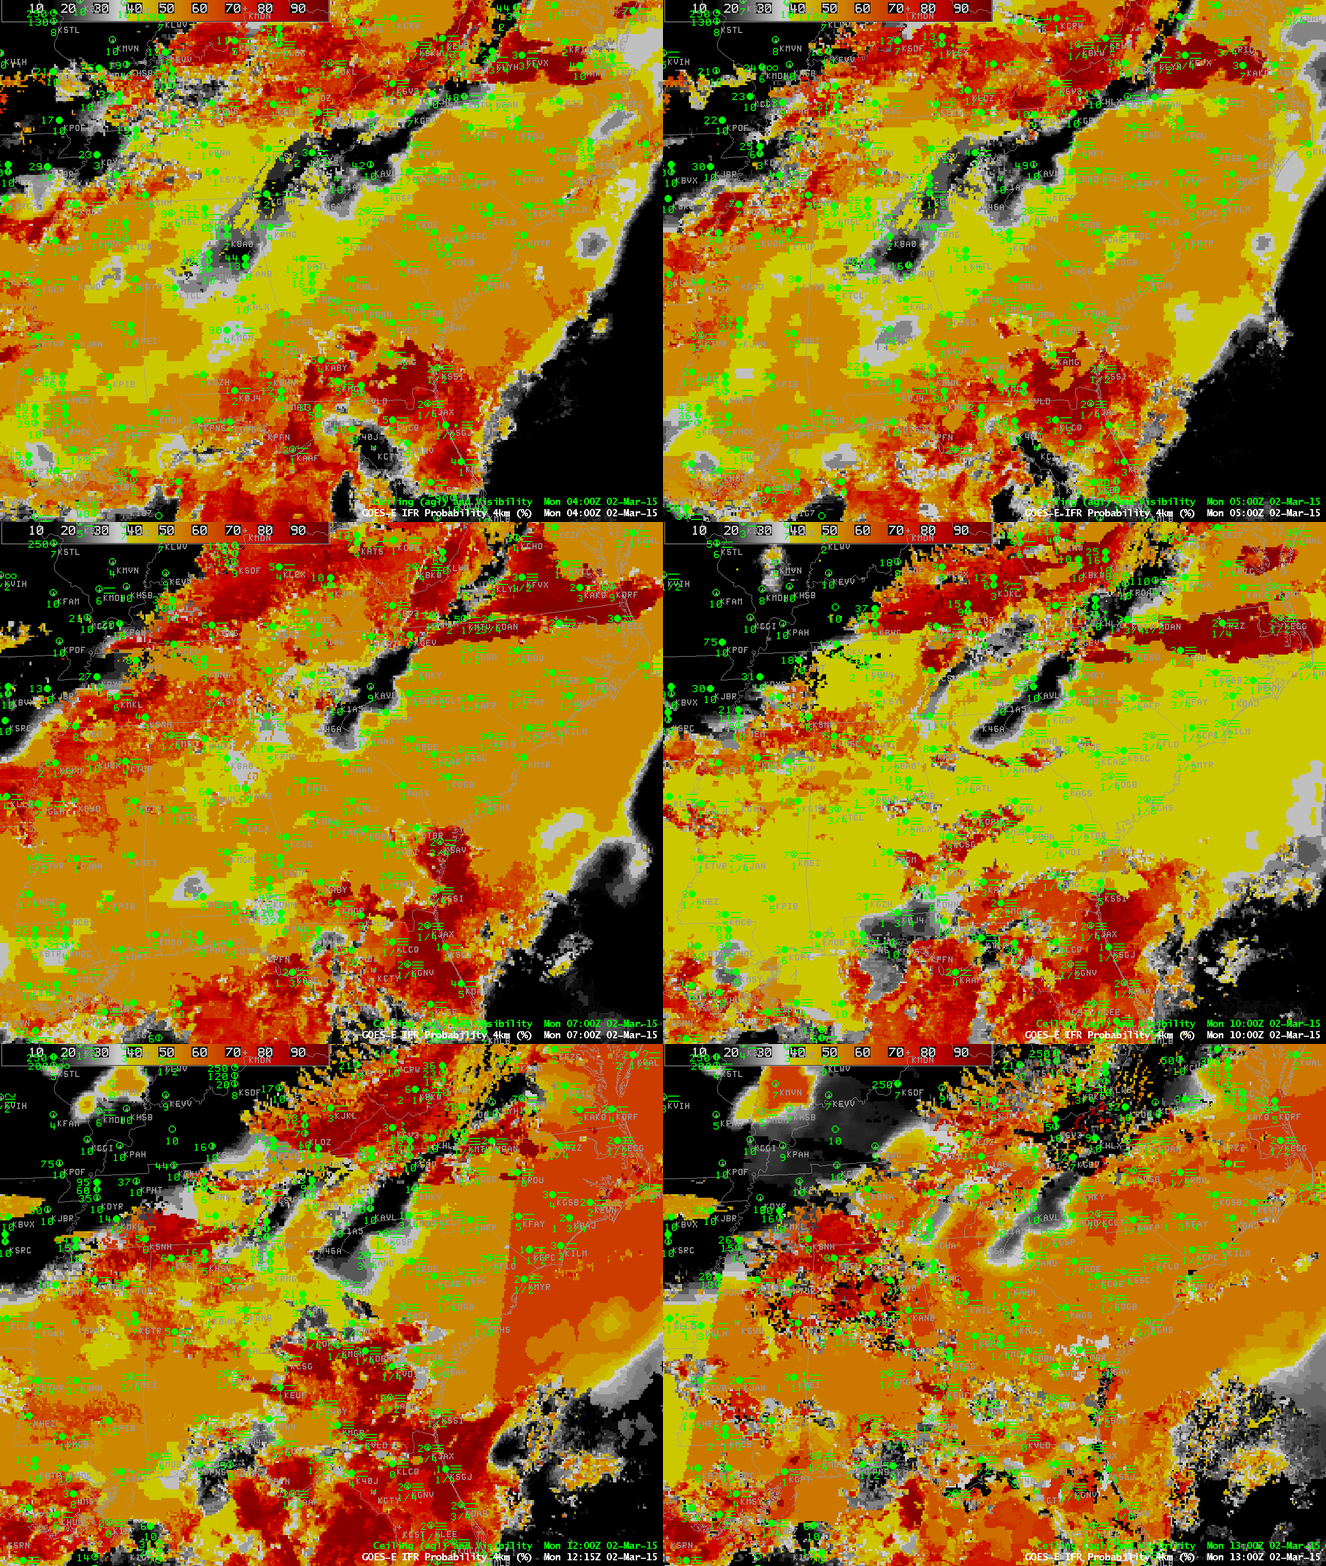
The GOES-R IFR Probability fields, below, better identify regions of reduced visibility underneath mixed cloud layers. It does this by incorporating model data (from the Rapid Refresh) into its suite of predictors. Thus, where low-level saturation is indicated under multiple cloud layers, IFR Conditions can be assumed to be occurring, and computed IFR Probabilities are large. The hourly animation of GOES-R IFR Probability, below, shows a good overlap between large IFR Probabilities and IFR (or near-IFR conditions). The flat IFR Probability field that is widespread over the Piedmont region of the Carolinas is typical of an IFR Probability field determined mostly by model output. Where high clouds break, pixelated regions develop (and IFR Probabilities increase) in the field.
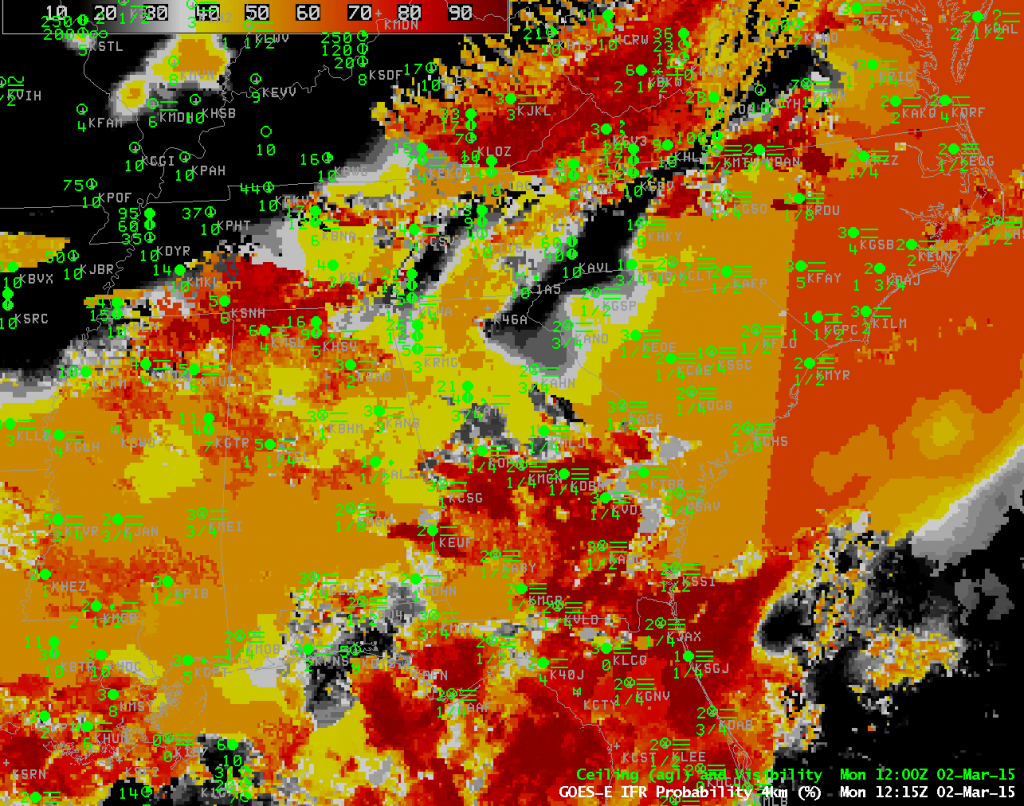
The 1215 UTC and 1300 UTC imagery in the IFR Probability animation above include a discernible nearly north-south line. (The 1215 UTC image is below). This is the terminator. To the right of that line, where IFR Probabilities are slightly larger (dark orange), daytime predictors are being used; to the left of that line, IFR Probabilities are slightly smaller (lighter orange) and nighttime predictors are being used. Why is the probability a bit larger in the daytime predictors? In part this is because visible imagery can be used to ascertain whether clouds are present. You can be a bit more confident that IFR conditions are present because clouds are present in the visible imagery.


