This post showed examples of Cloud Thickness and how its use as a predictor for dissipation time might be incorrect because of synoptic or mesoscale forcing.
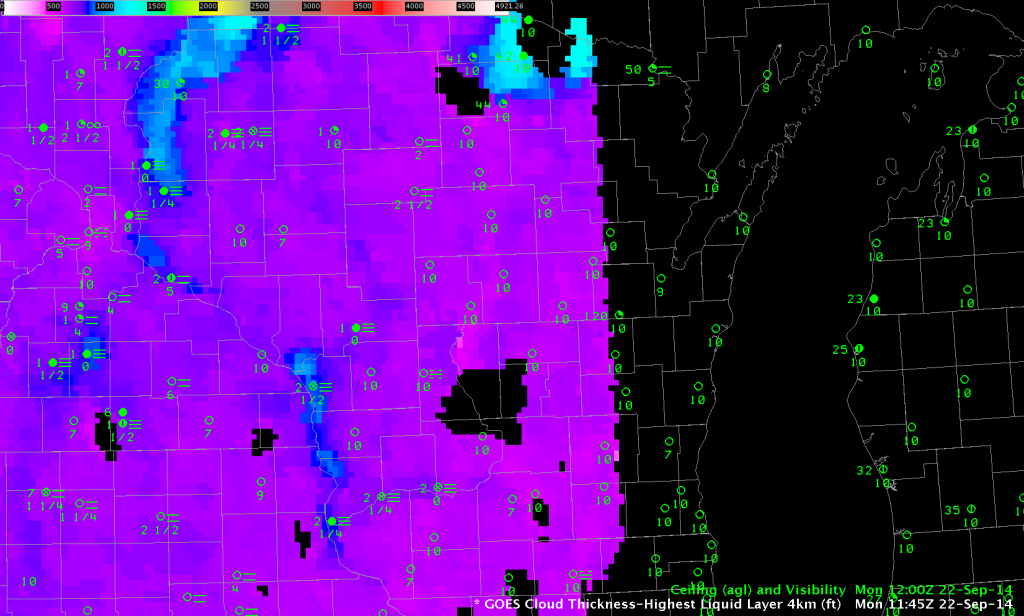
Radiation fog formed in River Valleys of Wisconsin early in the morning on 22 September, and the image below shows the final Cloud Thickness field computed before twilight conditions developed over western Wisconsin (twilight conditions are already occurring over eastern Wisconsin).

GOES-R Cloud Thickness (of the highest liquid water cloud layer) just before sunrise, 22 September 2014
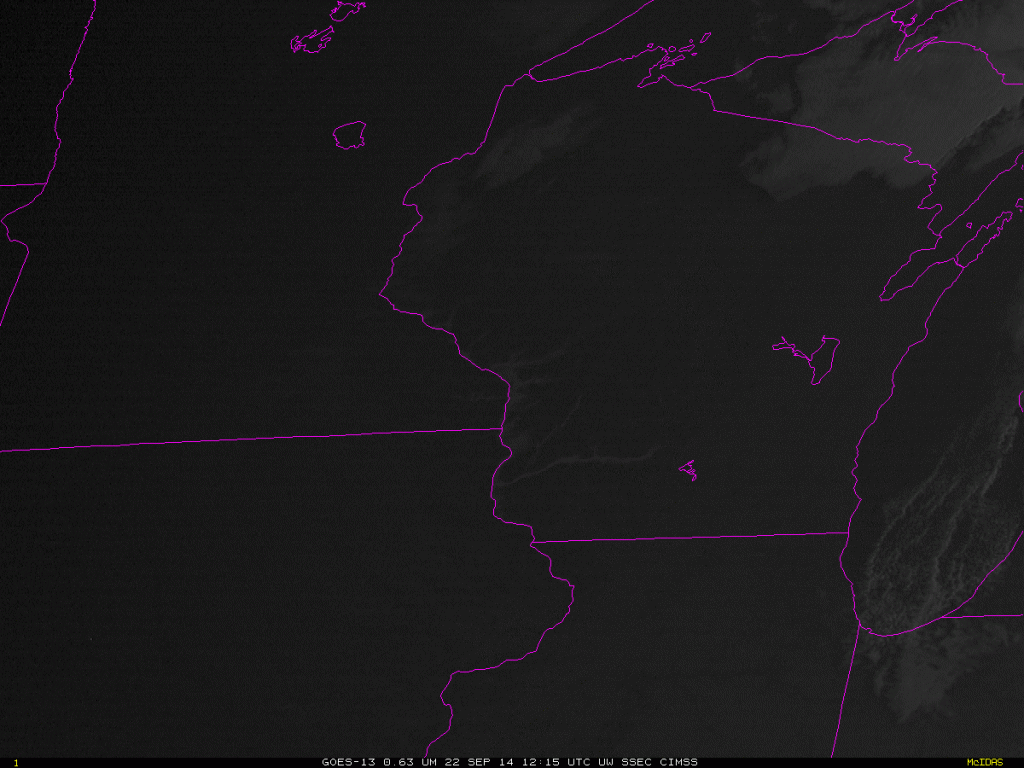
Cloud Thickness values near LaCrosse, WI, are around 900 feet; values are closer to 1200 feet over northeast Wisconsin along the St. Croix River. The chart suggests a dissipation time over the southwest part of Wisconsin of around 3 hours, and more than 4 hours over northwestern Wisconsin. The animation below shows that those estimates were accurate.

