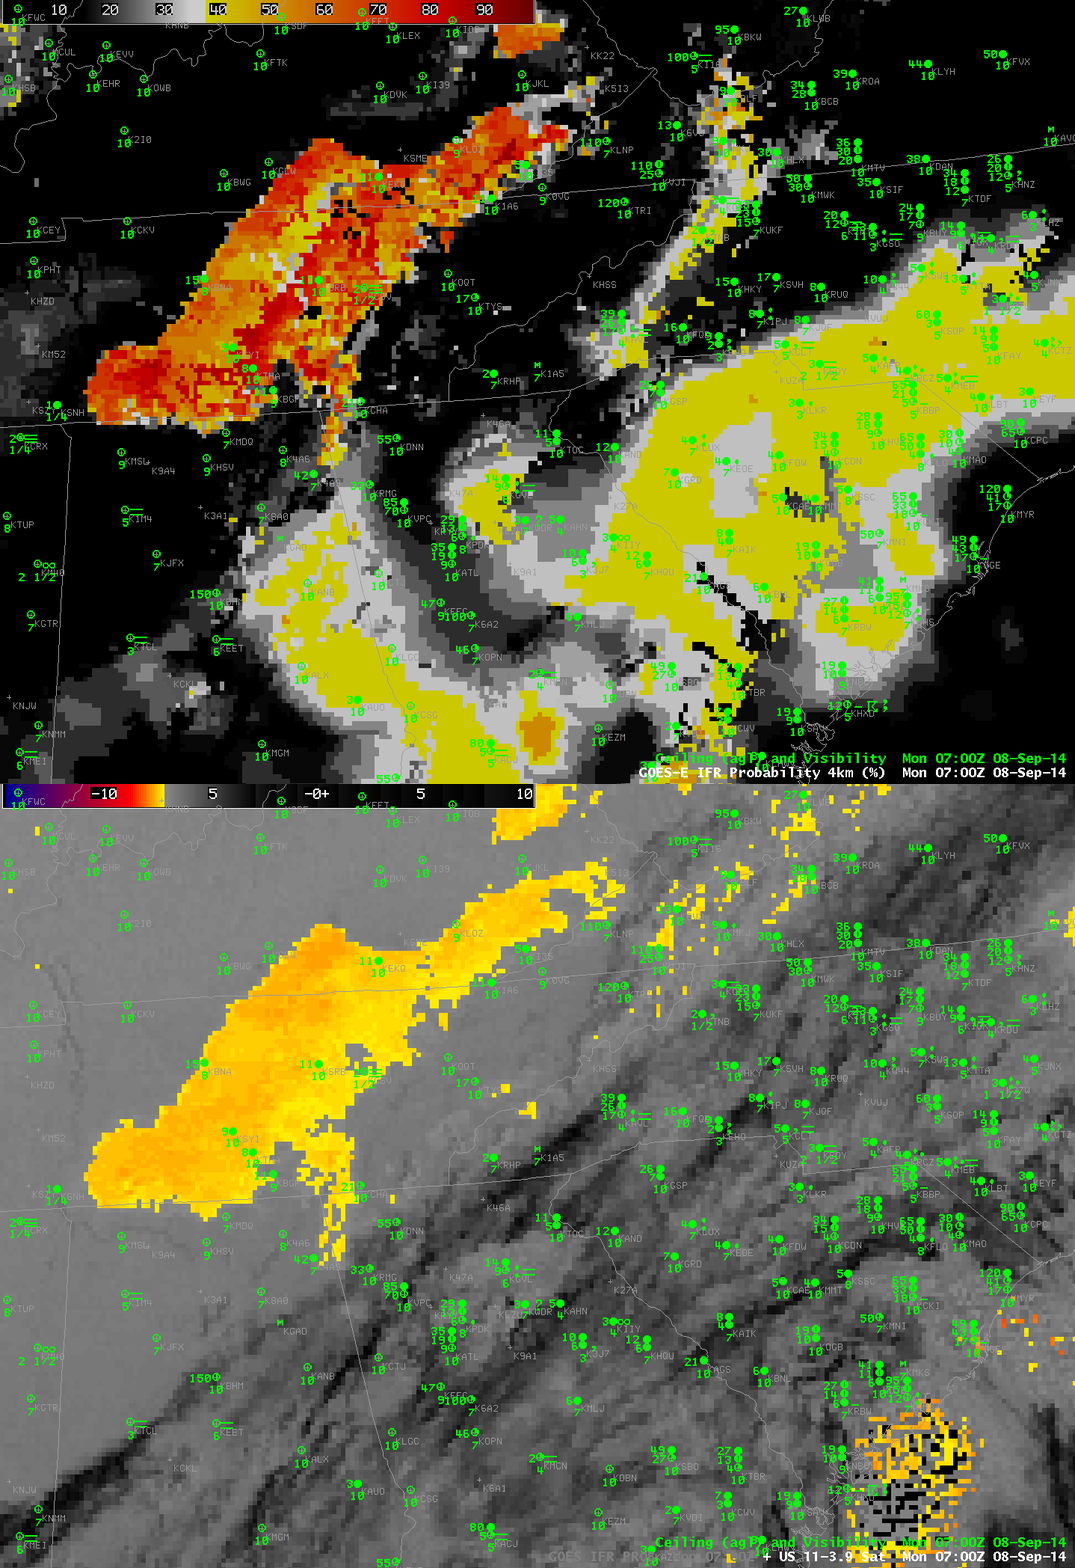
Toggle between GOES-R IFR Probabilities and GOES-East Brightness Temperature Differences (10.7 µm – 3.9 µm) over the southeast US, 0700 UTC 8 September 2014 (Click to enlarge)
When multiple cloud layers are present, such as when a cirrus shield overlays a region, the traditional method of detecting fog/low stratus, the brightness temperature difference product, struggles to identify regions of low clouds because the satellite sees only the signature of the high clouds. Low clouds are hidden from view. In such cases, it is vital to incorporate low-level information to identify regions where fog/low stratus might be present. The required low-level information can come from the model fields of the Rapid Refresh Model. The model predictors can be used to generate IFR Probabilities in regions where satellite predictors are unavailable because of the presence of high clouds.
In the toggle above, the Brightness Temperature Difference field shows high clouds over Georgia and the Carolinas. IFR Probabilities in this region are around 50% — relatively low because Cloud Predictors cannot be used in the algorithm. But IFR Conditions are present over North and South Carolina. Tailor your interpretation of the IFR Probability values to account for which predictors are used.
Over Tennessee, IFR Probabilities are much higher. In this region, satellite predictors can be used, and a strong satellite signal is present. IFR Conditions are not widespread, however. Use the IFR Probability field as one tool (but not the only tool) when making nowcasts about the possibilities of fog/low stratus.
