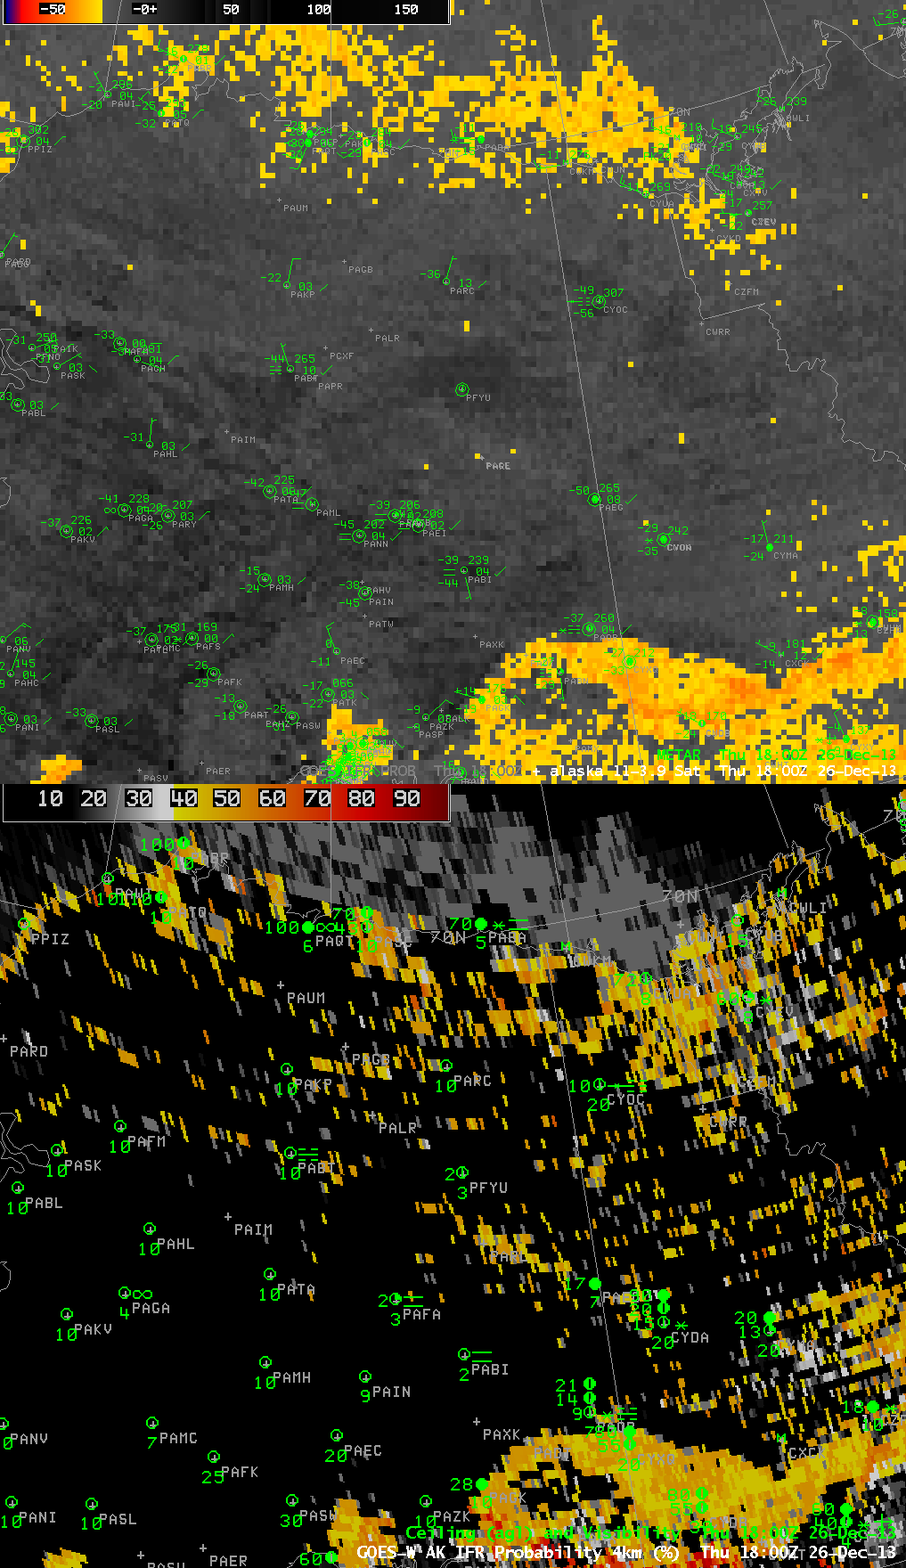
GOES-R IFR Probabilities from GOES-15 with surface ceilings/visibilities and GOES-15 Brightness Temperature Difference (10.7 µm – 3.9 µm) Fields with surface plots at 1800 UTC 26 December 2013 (click image to enlarge)
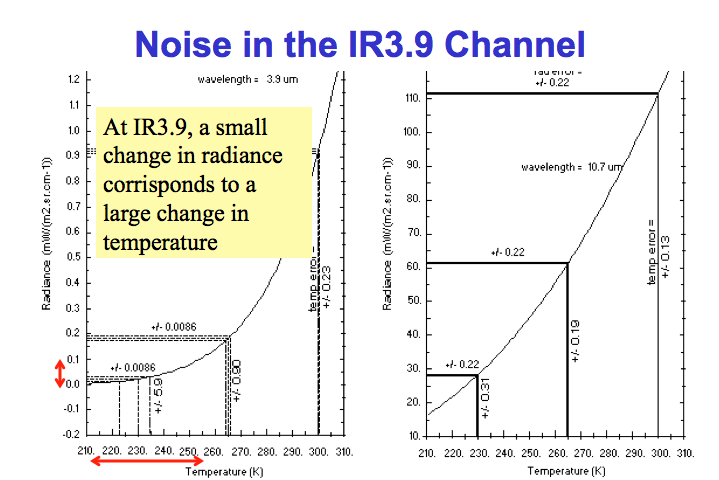
The image toggle above shows IFR Probability and the Brightness Temperature Difference Field over northern Alaska. Plotted METAR observations show very cold surface temperatures in the -30 to -50 F range. At such cold temperatures, the pseudo-emissivity computation can become noisy because a very small change in 10.7 µm radiance (used to compute the 3.9 µm radiance) can cause a large change in 3.9 µm brightness temperature. (The effect is shown graphically below — a small change in radiance at 3.9 µm leads to a very large temperature change). This noise can lead to a speckled appearance to the IFR probability fields. This effect can also occur in the northern Plains of the United States when surface temperatures dip below zero.
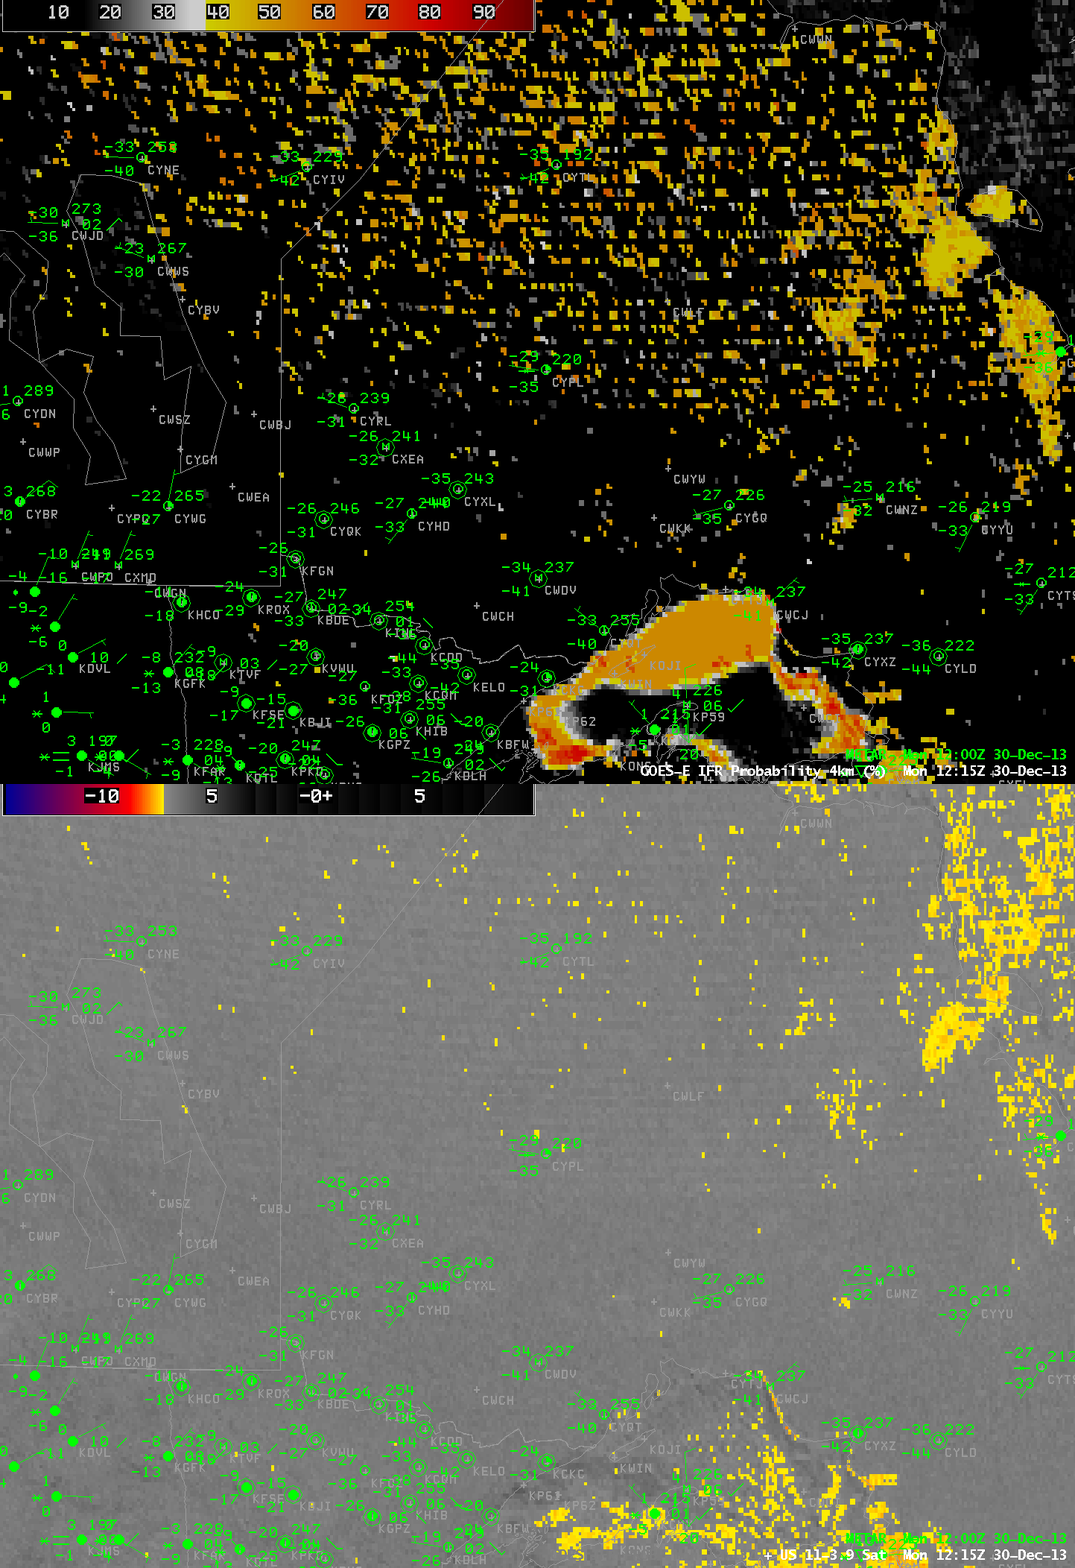
(update) Below is the IFR Probability in the heart of a Polar Airmass over northwestern Ontario.


