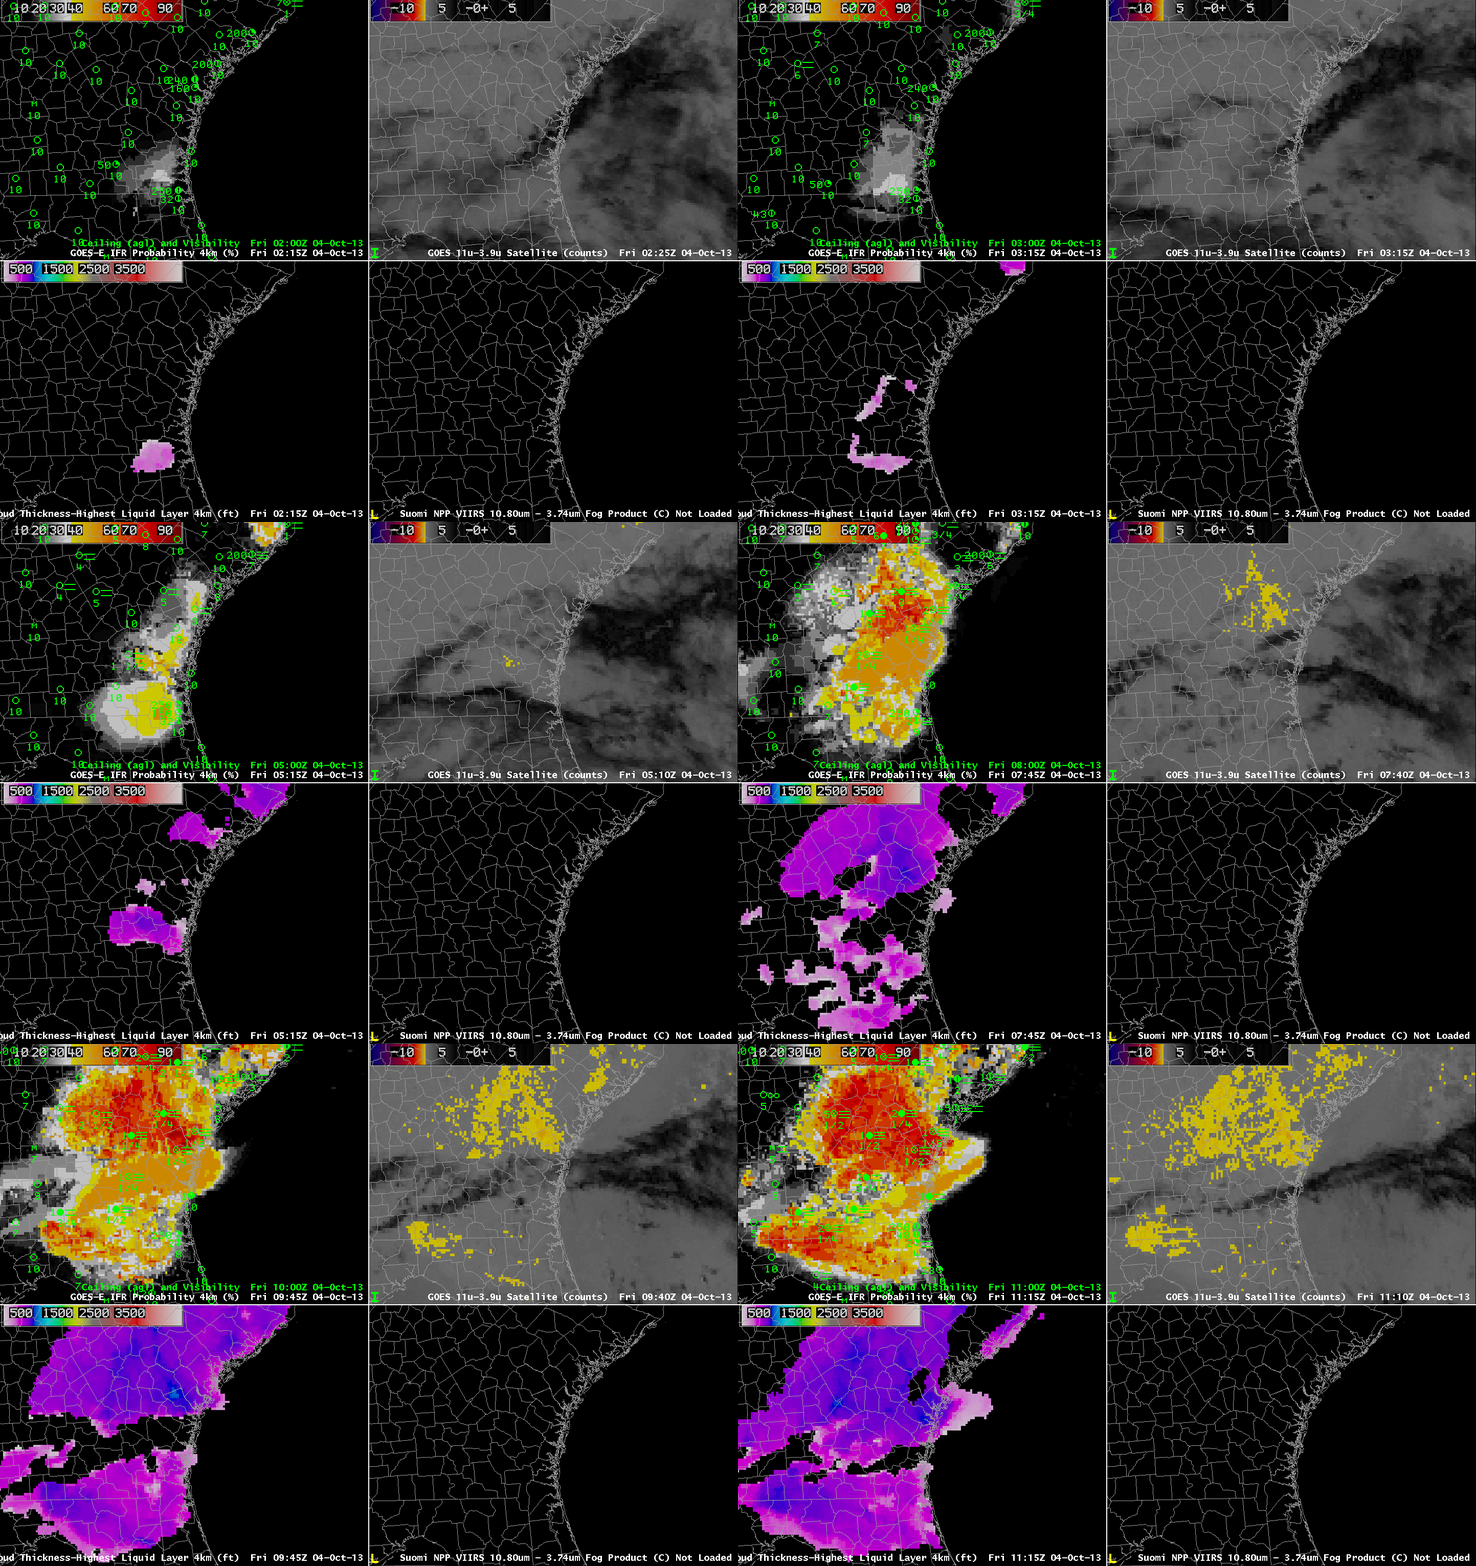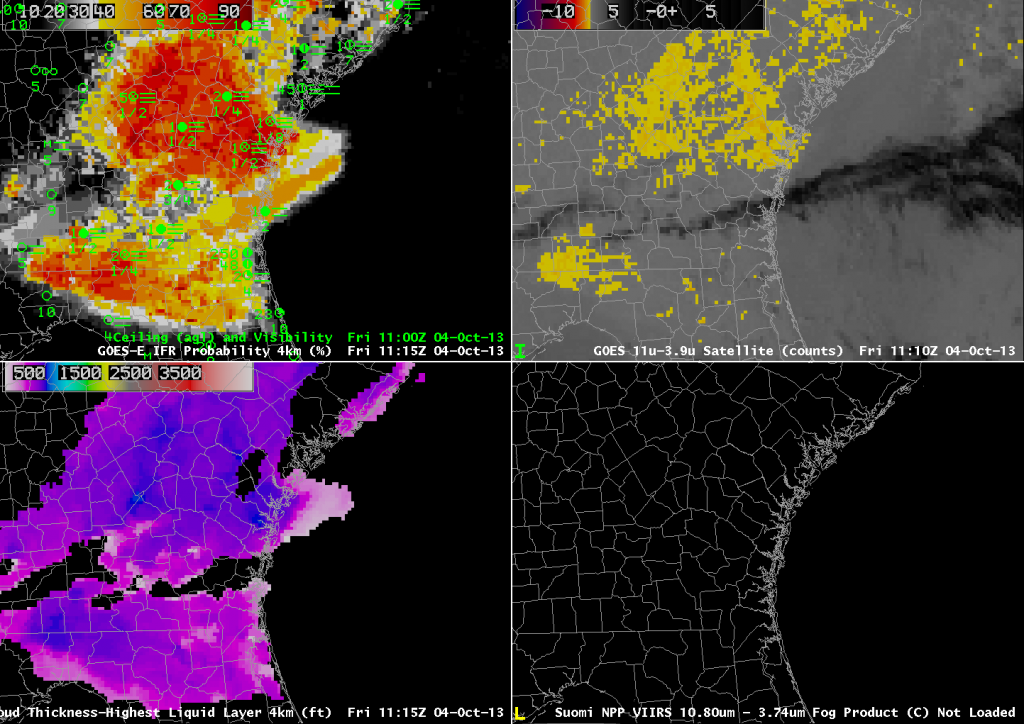
GOES-13-based GOES-R IFR Probabilities (Upper Left), GOES-13 Brightness Temperature Difference Product (10.7 µm – 3.9 µm) (Upper Right), GOES-13-based GOES-R Cloud Thickness (Lower Left), Suomi/NPP Brightness Temperature Difference (Lower Right), all times as indicated (click image to enlarge)
High Pressure of the southeast US allowed for clear skies and light winds overnight, and radiation fog developed over coastal portions of eastern Georgia. Because high clouds were present, the traditional method for detecting fog and low stratus, the brightness temperature difference between 10.7 µm and 3.9 µm on GOES could not capture the entire areal extent of the cloud. Fog is initially reported in eastern Georgia where IFR Probabilities are increasing underneath an ice-phase cloud deck that prevents the GOES satellite from seeing the development of low clouds and fog. Accordingly, the IFR probabilities are lower than they would be if satellite data were included. The uniform nature of the field is testament to the use of Rapid Refresh Data to drive the IFR Probability field. Shortly after 0600 UTC, a satellite signal develops over South Carolina as the high clouds shift to the south. When this happens, IFR probabilities increase (and acquire a more pixelated look). Regions under high clouds with IFR conditions persist through the end of the loop, however. It’s important to have a fused data product that allows two different complementary fields to diagnose where IFR conditions are likely. Where the brightness temperature difference cannot be used, Rapid Refresh Data gives vital information. Where brightness temperature difference data can be used, the Rapid Refresh Data can fine-tune things.
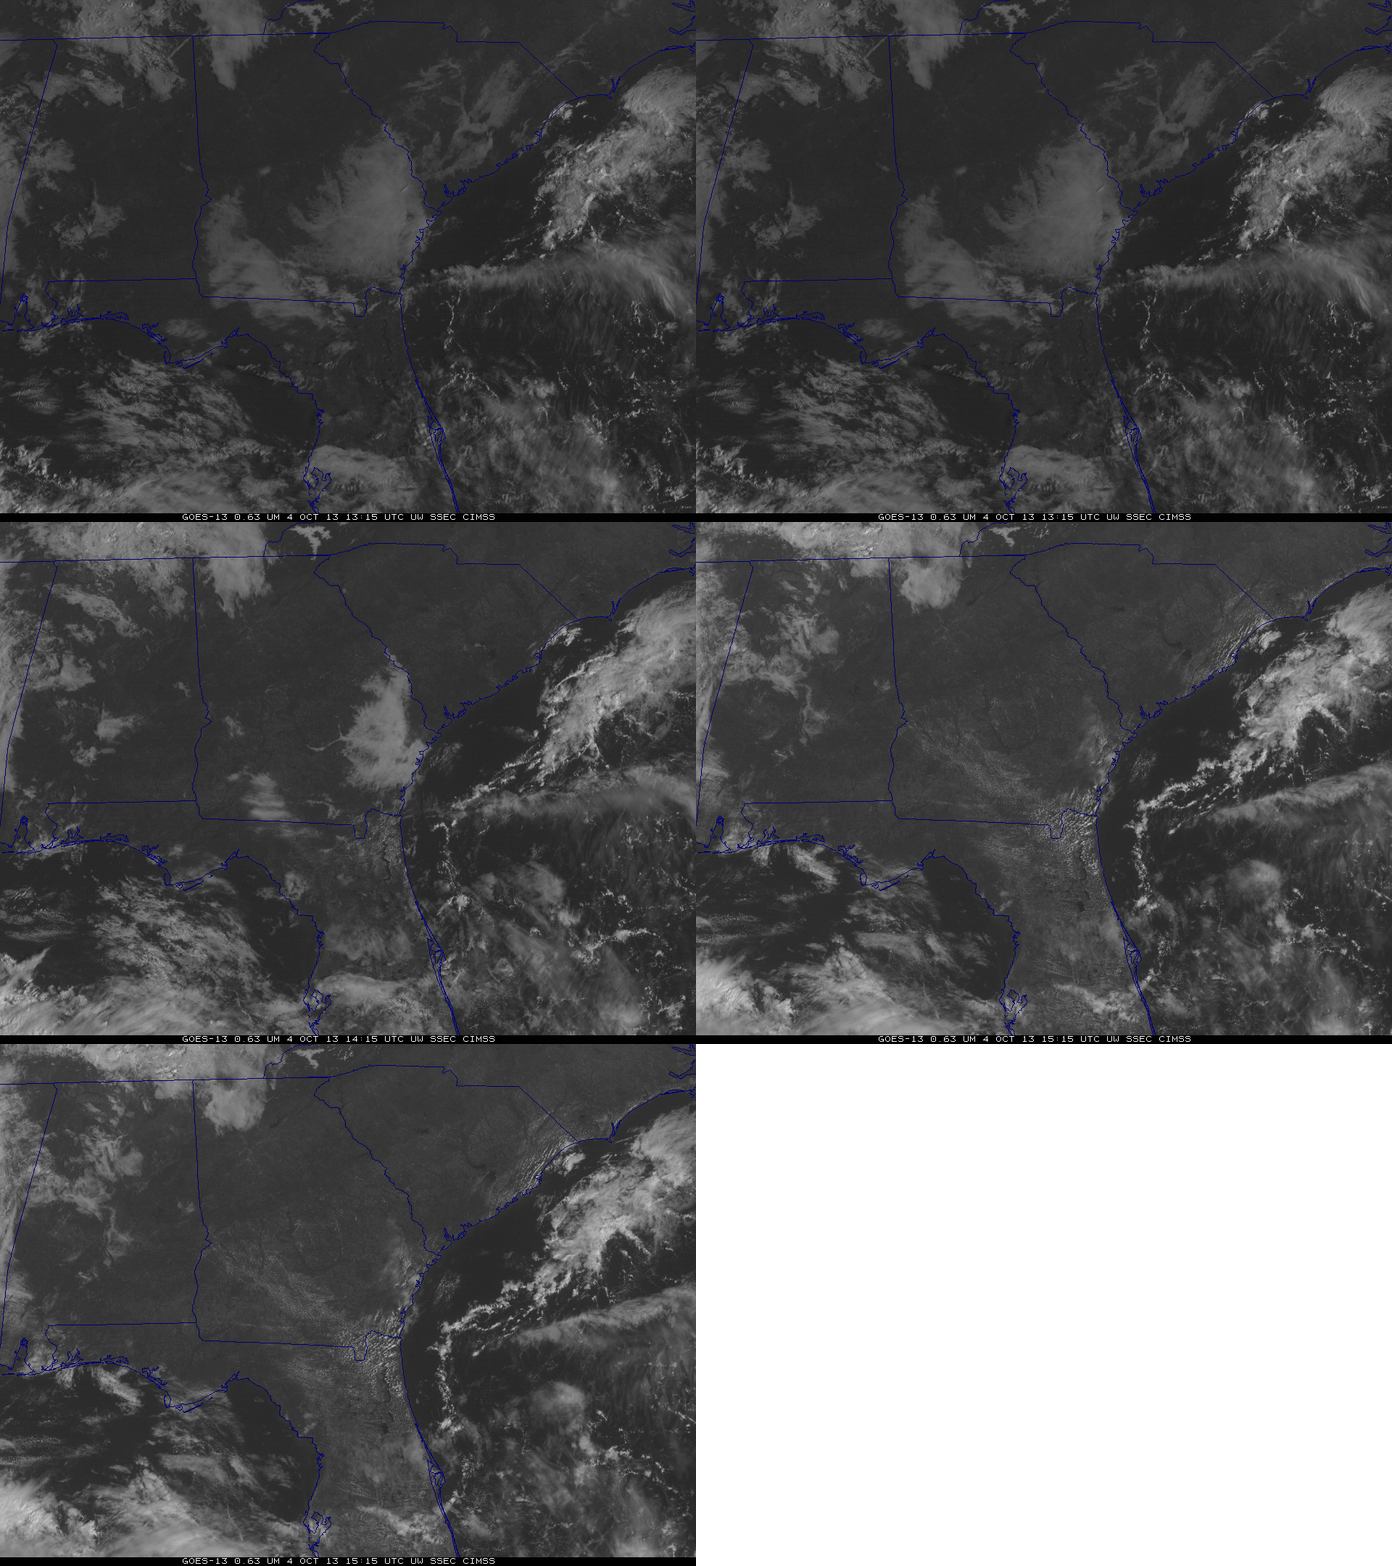
The 1115 UTC image, above, shows the GOES-R cloud thickness just before twilight conditions that accompany sunrise prohibit its computation. The cloud thickness in a radiation fog is related to dissipation time, and the cloud thickness is shown to be quite thin: Thickest values, in blue, are around 800 to 900 feet. This scatterplot relates cloud thickness to dissipation time, and it suggests a dissipation time of 1-2 hours. However, the visible imagery animation, below, shows actual dissipation occurred shortly after 1500 UTC. Note that there is considerable spread in that predictive scatterplot.


